

Cities, traffic, and CO2: A multidecadal assessment of trends, drivers, and scaling relationships
- PMID: 25847992
- PMCID: PMC4413274
- DOI: 10.1073/pnas.1421723112
Cities, traffic, and CO2: A multidecadal assessment of trends, drivers, and scaling relationships
Abstract
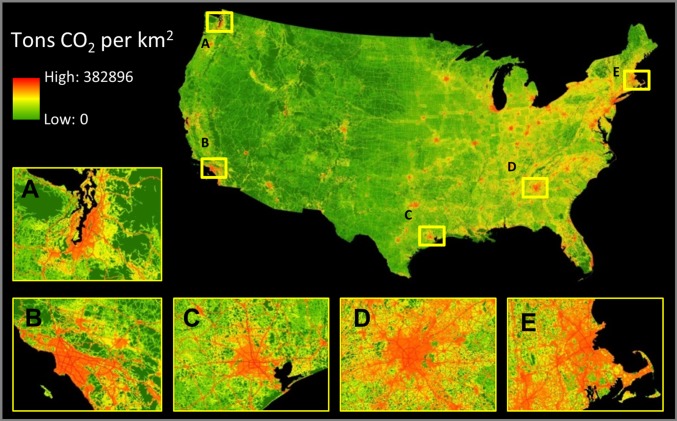
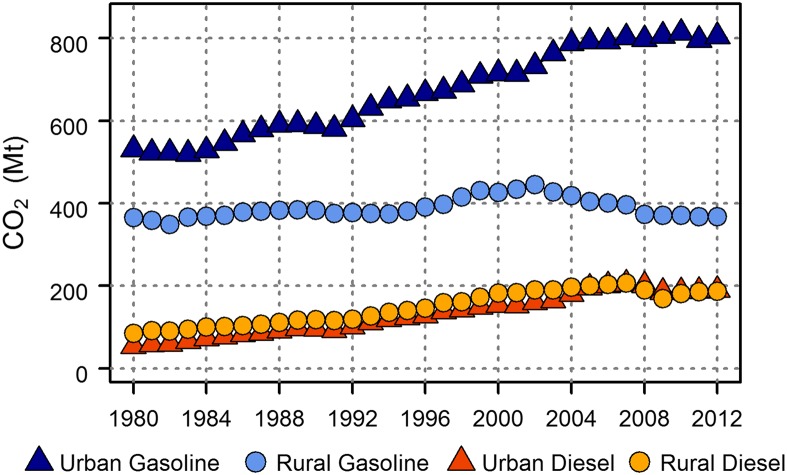
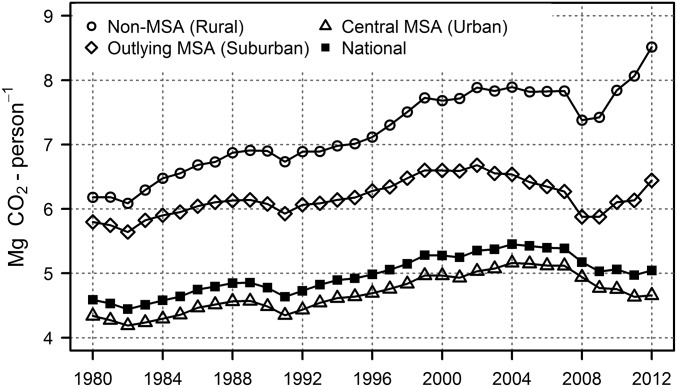
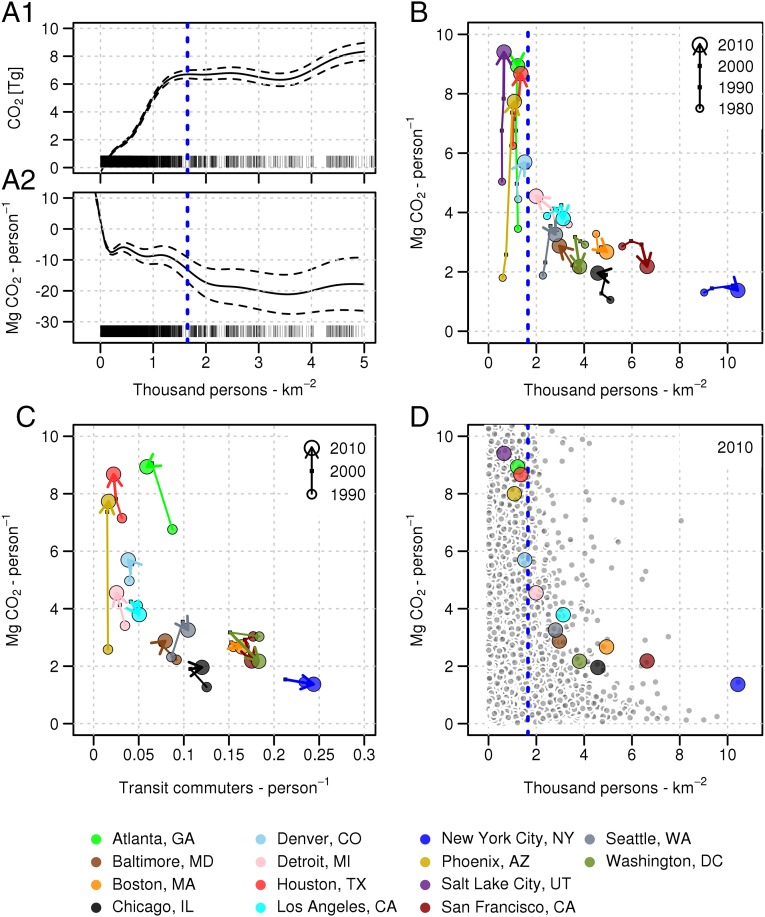
Emissions of CO2 from road vehicles were 1.57 billion metric tons in 2012, accounting for 28% of US fossil fuel CO2 emissions, but the spatial distributions of these emissions are highly uncertain. We develop a new emissions inventory, the Database of Road Transportation Emissions (DARTE), which estimates CO2 emitted by US road transport at a resolution of 1 km annually for 1980-2012. DARTE reveals that urban areas are responsible for 80% of on-road emissions growth since 1980 and for 63% of total 2012 emissions. We observe nonlinearities between CO2 emissions and population density at broad spatial/temporal scales, with total on-road CO2 increasing nonlinearly with population density, rapidly up to 1,650 persons per square kilometer and slowly thereafter. Per capita emissions decline as density rises, but at markedly varying rates depending on existing densities. We make use of DARTE's bottom-up construction to highlight the biases associated with the common practice of using population as a linear proxy for disaggregating national- or state-scale emissions. Comparing DARTE with existing downscaled inventories, we find biases of 100% or more in the spatial distribution of urban and rural emissions, largely driven by mismatches between inventory downscaling proxies and the actual spatial patterns of vehicle activity at urban scales. Given cities' dual importance as sources of CO2 and an emerging nexus of climate mitigation initiatives, high-resolution estimates such as DARTE are critical both for accurately quantifying surface carbon fluxes and for verifying the effectiveness of emissions mitigation efforts at urban scales.
Keywords: carbon dioxide; emissions; on-road; transportation; urban.
Conflict of interest statement
The authors declare no conflict of interest.
Figures
References
-
- DeCicco J, Fung F, An F. Global Warming of the Road: The Climate Impact of America’s Automobiles. Environmental Defense Fund; New York: 2006.
-
- US EPA 2014. Inventory of U.S. Greenhouse Gas Emissions and Sinks: 1990–2012 (US Environmental Protection Agency, Washington, DC), Rep No EPA 430-R-14-003.
-
- Gately CK, Hutyra LR, Wing IS, Brondfield MN. A bottom up approach to on-road CO2 emissions estimates: Improved spatial accuracy and applications for regional planning. Environ Sci Technol. 2013;47(5):2423–2430. - PubMed
-
- Andres RJ, et al. A synthesis of carbon dioxide emissions from fossil-fuel combustion. Biogeosciences. 2012;9(5):1845–1871.
-
- National Research Council, Committee on Methods for Estimating Greenhouse Gas Emissions 2010. Verifying Greenhouse Gas Emissions: Method to Support International Climate Agreements (National Academies Press, Washington, DC)
Publication types
MeSH terms
Substances
LinkOut - more resources
Full Text Sources
Other Literature Sources
Molecular Biology Databases
