. 2015 Apr 21;112(16):E2083-92.
doi: 10.1073/pnas.1418730112. Epub 2015 Apr 6.

Cortical activity is more stable when sensory stimuli are consciously perceived

Affiliations

Cortical activity is more stable when sensory stimuli are consciously perceived

Aaron Schurger et al. Proc Natl Acad Sci U S A. .

Abstract

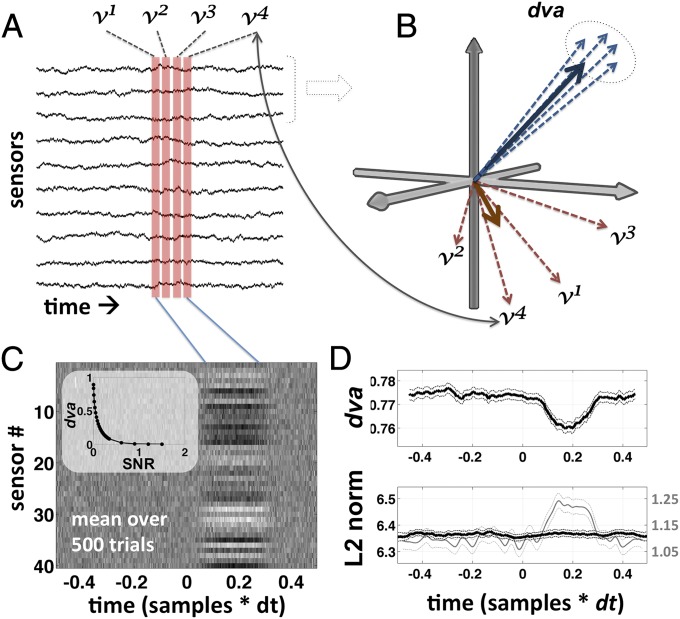
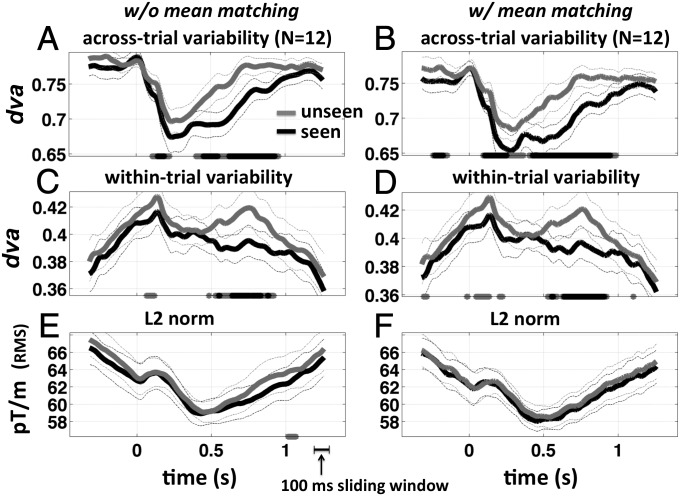
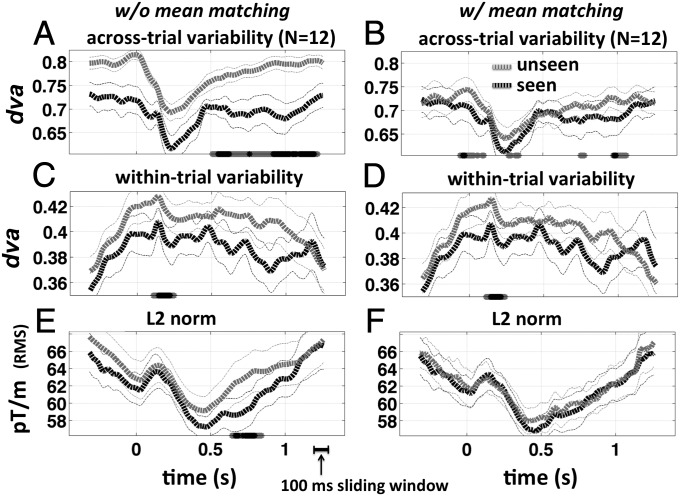
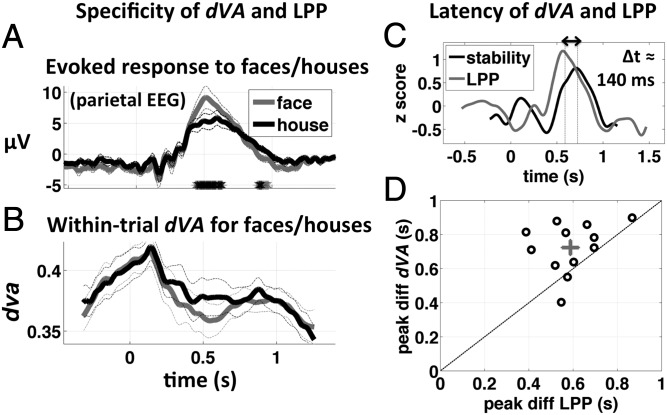
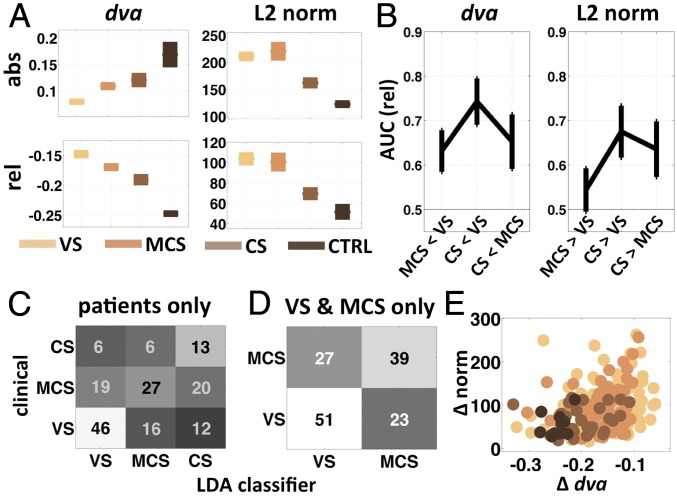
According to recent evidence, stimulus-tuned neurons in the cerebral cortex exhibit reduced variability in firing rate across trials, after the onset of a stimulus. However, in order for a reduction in variability to be directly relevant to perception and behavior, it must be realized within trial--the pattern of activity must be relatively stable. Stability is characteristic of decision states in recurrent attractor networks, and its possible relevance to conscious perception has been suggested by theorists. However, it is difficult to measure on the within-trial time scales and broadly distributed spatial scales relevant to perception. We recorded simultaneous magneto- and electroencephalography (MEG and EEG) data while subjects observed threshold-level visual stimuli. Pattern-similarity analyses applied to the data from MEG gradiometers uncovered a pronounced decrease in variability across trials after stimulus onset, consistent with previous single-unit data. This was followed by a significant divergence in variability depending upon subjective report (seen/unseen), with seen trials exhibiting less variability. Applying the same analysis across time, within trial, we found that the latter effect coincided in time with a difference in the stability of the pattern of activity. Stability alone could be used to classify data from individual trials as "seen" or "unseen." The same metric applied to EEG data from patients with disorders of consciousness exposed to auditory stimuli diverged parametrically according to clinically diagnosed level of consciousness. Differences in signal strength could not account for these results. Conscious perception may involve the transient stabilization of distributed cortical networks, corresponding to a global brain-scale decision.

Keywords: consciousness; correlated variability; directional variance; dynamical systems; pattern similarity.


Conflict of interest statement

The authors declare no conflict of interest.

Figures

Fig. 1.
Fig. 1.
Schematic illustration of dva. dva is explained graphically in A and B; C and D show the results of a simulation used to illustrate its properties. v1, v2, v3, and v4 are samples taken at four successive time steps in a single trial epoch, across a multichannel sensor array (A; time is on the horizontal axis and sensor on the vertical). v1, …, v4 can also be treated as vectors in n dimensions, where each element (dimension) carries a measurement from one of the n channels (B). dva is a measure of dispersion in the directionality of the vectors (dashed circle in B). dva can be computed for any number of channels, but in B we illustrate a hypothetical subset of three channels. dva is mathematically independent of the length of the vectors (L2 norm or spatial power), and depends only on their orientation with respect to one another. According to our hypothesis successive patterns of activity on seen trials, within a certain window of time, are more like the blue vectors—consistently pointing in the same direction. (C) The average over 500 simulated trials where a random stable pattern emerges from 100 to 300 ms (with time on the horizontal axis and sensor on the vertical; Materials and Methods). (D) The average dva and L2 norm over this set of simulated trials. Note that dva is sensitive to the presence of the pattern even though there is no difference in the mean norm in this simulation (Materials and Methods). Note also that the total power, or norm, of the mean (i.e., the norm over each column in C; gray line in D) is not equivalent to the mean norm (black line in D). This can explain why conscious perceptions is commonly associated with larger-amplitude evoked potentials: Trial averaging highlights stable/reliable patterns and suppresses unstable/unreliable ones, even if the spatial energy is the same on single trials. The relationship between dva and the SNR is highly nonlinear (C, Inset), which must be taken in to account when analyzing the data.
Fig. 2.
Fig. 2.
Reproducibility, stability, and vector norm for object trials. Across-trial and within-trial dva and spatial L2 norm, for noncontrol (object) trials, are shown both with (left column) and without (right column) mean matching. (A) Across-trial directional variance (1 – reproducibility) as a function of time for unseen (gray) and seen (black) target-present trials. Stars at the bottom of each panel mark time points where the difference unseen – seen is significantly greater than chance (gray, P < 0.05; black, P < 0.01, both corrected for temporal nonindependence using a cluster-based permutation test). (C) Within-trial directional variance (1 – stability). (E) L2 norm of the mean vector within the sliding window. (B, D, and F) Same as A, C, and E after performing the mean-matching procedure (1) on the L2 norm. Analyses were performed using a 100-ms sliding window.
Fig. 3.
Fig. 3.
Reproducibility, stability, and vector norm for blank control trials. AF are the same as in Fig. 2, but for target-absent (control) trials. In this case, reports of “seeing” an object reflect endogenously generated perceptual false positives. Data were noisier because there were fewer trials of this type. Because no object was present on the screen, these trials count as instances where perceptual decision making was decoupled and deconfounded from bottom-up sensory information processing. Note that the significant difference in the norm at ∼600–800 ms (E) is in the opposite direction of what might otherwise lead to a lower average dva for seen trials (A), and thus the observed difference in across-trial variability (reproducibility) cannot be tied to a simple difference in signal strength. The difference in the norm is also the opposite of what one might intuitively predict for seen versus unseen trials. Recurrent network models, however, allow for higher energy in a network that fails to settle into a decision state. The timing of the early difference in within-trial variability (stability) is consistent with that of the visual-awareness negativity (88).
Fig. 4.
Fig. 4.
Specificity and latency of dva and the LPP. In this figure we compare the specificity of dva and the LPP to the “seen – unseen” dimension and also compare the latency of the peak difference in dva (seen − unseen) with that of the LPP. (A) Evoked potential at parietal EEG electrode Pz and (B) within-trial directional variance for seen face (gray) and seen house (black) stimuli at maximum color contrast. The LPP, which is higher in amplitude for seen versus unseen subjective reports, is also significantly higher in amplitude for face versus house stimuli (A). Gray and black stars at the bottom of the panel indicate time points where the difference is greater than chance at P < 0.05 and P < 0.01, respectively (corrected for temporal nonindependence). No significant differences between face and house stimuli were found for within-trial directional variance (stability, B), suggesting that stability is a more specific indicator of a positive subjective report. (C) Amplitude-normalized time course of the difference potential at electrode Pz (P300, gray) and the difference in directional variance, seen – unseen object. The difference in the latency of the peaks was 140 ms (P < 0.01, two-sided signed-rank test; Materials and Methods). (D) Scatter plot of the time of peak difference between evoked potentials at Pz, versus the time of peak difference in directional variance (each circle is one subject, n = 12). Gray cross shows the mean and SE of both variables. The peak stability effect follows the peak difference in the LPP, consistent with the notion of the LPP as an “ignition” event, the outcome of which is a transient period of relative stability of perceptual information.
Fig. 5.
Fig. 5.
Stability and norm in DOC patients. (A) Mean (± SEM) dva and L2 norm over the time period from 600 to 1,000 ms after the onset of the first tone in the tone sequence (0–400 ms after onset of the last tone; SI Appendix, Fig. S9) for each of the three patient categories and the healthy control subjects. Bottom row of A shows the same two measures, each relative to its value at the onset of the first tone (t0). (B) The area under the receiver operating characteristic (AUC) gives an unbiased measure of the degree to which each of the three pairs of patient categories can be distinguished from each other based on dva (Left) and the spatial L2 norm (Right). (C and D) Confusion matrices summarizing the results of a linear discriminant analysis (LDA) applied to the patient data. The analysis was run once on all of the patient data (C; 50% correct, P < 0.01, chance = 33%) and again on only the data from MCS and VS patients (D; 65% correct, P < 0.01, chance = 50%), which are more challenging to distinguish. (E) A scatter plot of the dva versus norm, both relative to t0 (A, bottom row), with each patient category color coded as in A. abs, absolute; rel, relative; Δ, change relative to baseline.

Comment in

Similar articles

Cited by

References

    1. Churchland MM, et al. Stimulus onset quenches neural variability: A widespread cortical phenomenon. Nat Neurosci. 2010;13(3):369–378. - PMC - PubMed
    1. He BJ. Spontaneous and task-evoked brain activity negatively interact. J Neurosci. 2013;33(11):4672–4682. - PMC - PubMed
    1. Schurger A, Pereira F, Treisman A, Cohen JD. Reproducibility distinguishes conscious from nonconscious neural representations. Science. 2010;327(5961):97–99. - PubMed
    1. Xue G, et al. Greater neural pattern similarity across repetitions is associated with better memory. Science. 2010;330(6000):97–101. - PMC - PubMed
    1. Hopfield JJ. Neural networks and physical systems with emergent collective computational abilities. Proc Natl Acad Sci USA. 1982;79(8):2554–2558. - PMC - PubMed

Publication types

LinkOut - more resources