. 2015 Apr 21;112(16):E2093-101.
doi: 10.1073/pnas.1504394112. Epub 2015 Apr 6.

Architecture of the cerebral cortical association connectome underlying cognition

Affiliations

Architecture of the cerebral cortical association connectome underlying cognition

Mihail Bota et al. Proc Natl Acad Sci U S A. .

Abstract

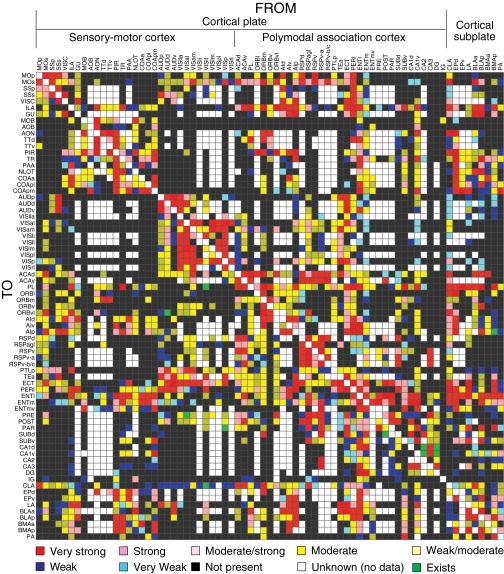
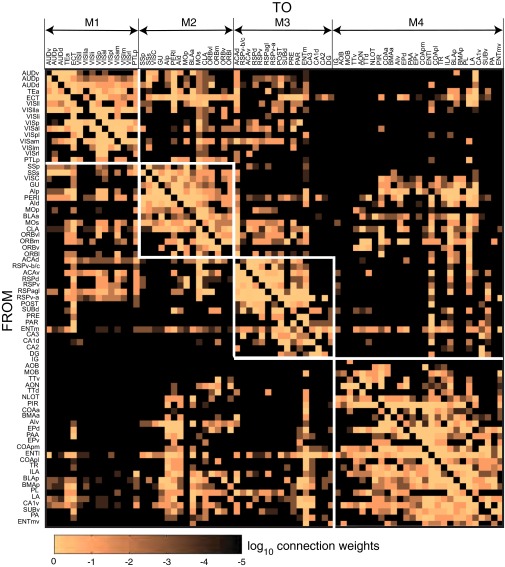
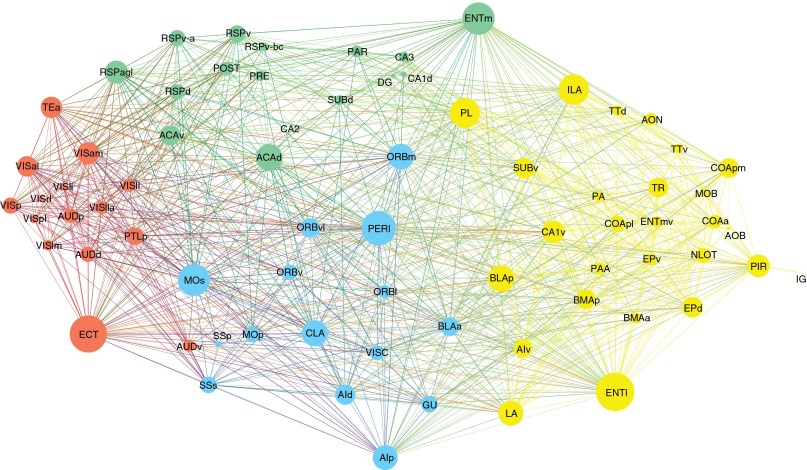
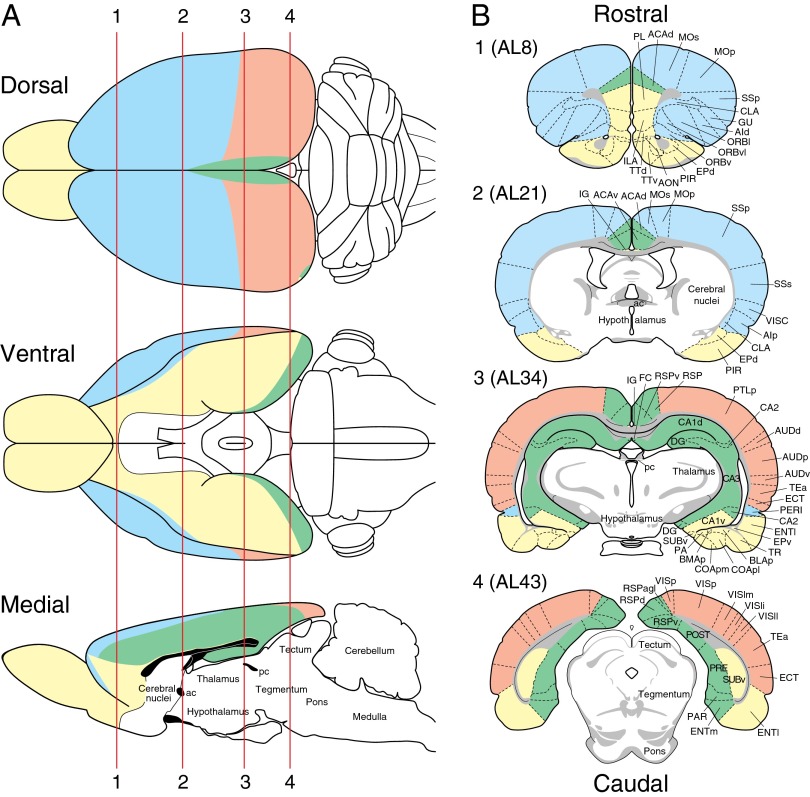
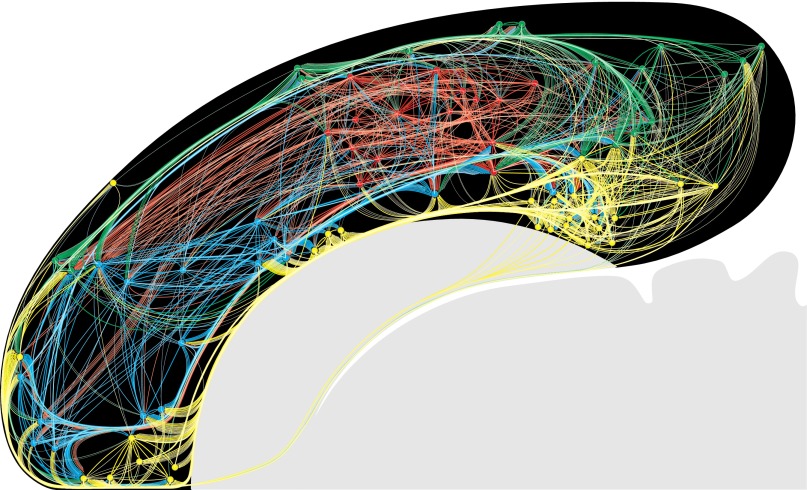
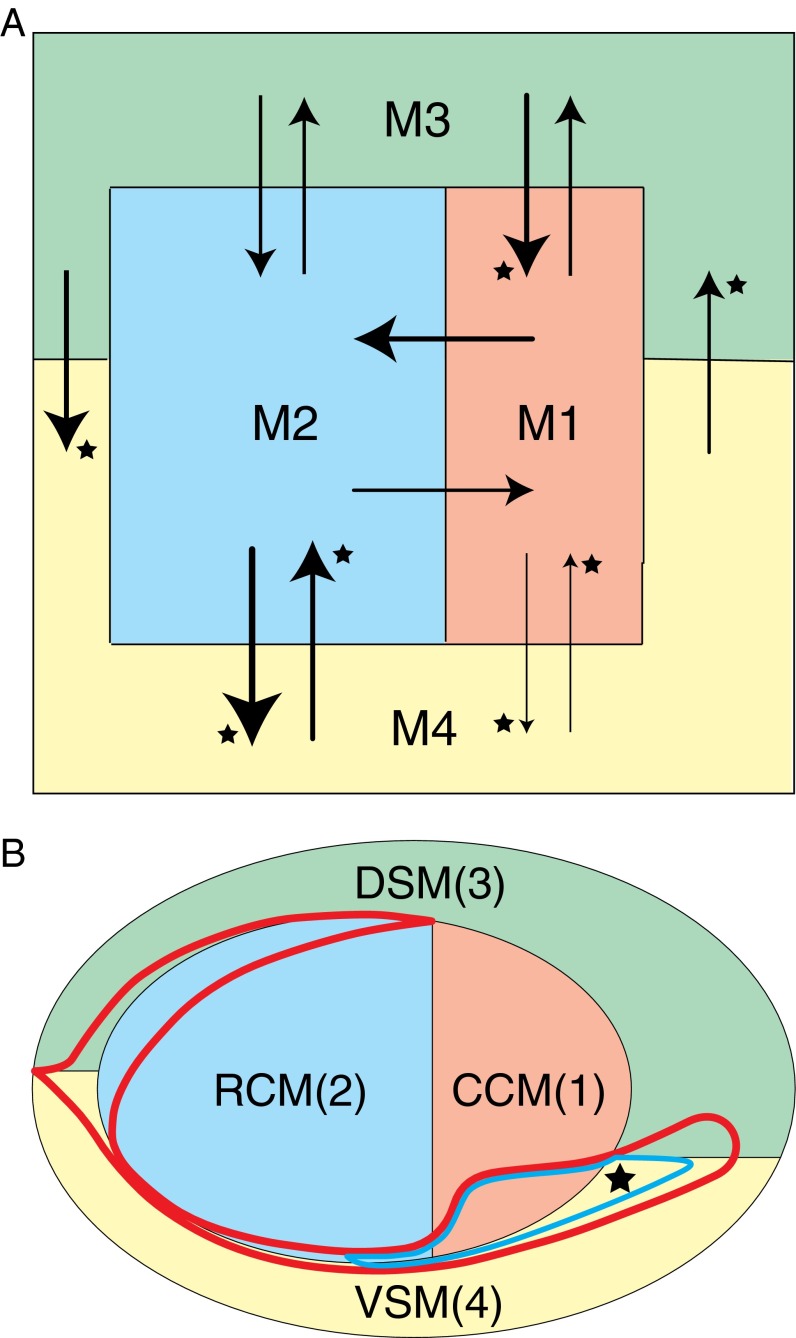
Cognition presumably emerges from neural activity in the network of association connections between cortical regions that is modulated by inputs from sensory and state systems and directs voluntary behavior by outputs to the motor system. To reveal global architectural features of the cortical association connectome, network analysis was performed on >16,000 reports of histologically defined axonal connections between cortical regions in rat. The network analysis reveals an organization into four asymmetrically interconnected modules involving the entire cortex in a topographic and topologic core-shell arrangement. There is also a topographically continuous U-shaped band of cortical areas that are highly connected with each other as well as with the rest of the cortex extending through all four modules, with the temporal pole of this band (entorhinal area) having the most cortical association connections of all. These results provide a starting point for compiling a mammalian nervous system connectome that could ultimately reveal novel correlations between genome-wide association studies and connectome-wide association studies, leading to new insights into the cellular architecture supporting cognition.

Keywords: cerebral cortex; connectomics; mammal; network analysis; neural connections.


Conflict of interest statement

The authors declare no conflict of interest.

Figures

Fig. 1.
Fig. 1.
Rat cortical association connectome. Directed synaptic macroconnection matrix with gray-matter region sequence (top left to right, list of macroconnection origins, from; left side top to bottom, same list of macroconnection terminations, to) in the Swanson-04 (16) structure–function nomenclature hierarchy. The main diagonal (top left to bottom right) is empty because connections within a region are not considered in the analysis. Color scale of connection weight is at bottom; abbreviations are in Fig. S2.
Fig. 2.
Fig. 2.
Four modules of rat cortical association network (M1–M4). Directed synaptic macroconnections are arranged here by connection weight, rather than by nomenclature hierarchy (Fig. 1). The matrix (log-weighted scaled connection weighs, bottom) shows four highly interconnected modules (inside white boxes along main diagonal) that together include all 73 regions in the analysis, with intermodular connections shown outside the boxes. “Not present” and “unknown” are black; abbreviations are in Fig. S2.
Fig. 3.
Fig. 3.
Circuit diagram constructed using Gephi’s weighted 3D force-directed algorithm. Node color indicates module number (M1, red; M2, blue; M3, green; M4, yellow), with size proportional to node degree (Fig. S1C). Edge color indicates output of correspondingly colored node; edge thickness is proportional to connection weight. “Very weak” and “weak” weights were dropped from analysis, minimizing the influence of false-positive results. Abbreviations are in Fig. S2.
Fig. 4.
Fig. 4.
Spatial distribution of cortical association modules. (A) Modules (M1–M4) in Figs. 2 and 3 plotted on a flatmap of right half of rat central nervous system (16); M1, red; M2, blue, M3, green, M4, yellow. See ref. for high-resolution details. (B) The cortical association connectome (Fig. 1) shown in the context of the complete rat central nervous system connectome that has just 15% matrix coverage (fill ratio) because most literature outside the cortical association domain is not yet expertly curated (44). Abbreviations are in Fig. S2. (C) Histologically defined human cortical regions corresponding to rat cortical regions (correspondence documented in Fig. S2) plotted on a flatmap (45) and color coded as in A. AH, Ammon’s horn; AON, anterior olfactory nucleus; BLC, basolateral amygdalar complex; CLA/6B, claustrum/layer 6b; COC, cortical amygdalar complex; DG, dentate gyrus; EP, entopeduncular nucleus; INS, insular region; OB, olfactory bulb; TT, tenia tecta; SBC, subicular complex. Numbers correspond to Brodmann’s areas (Fig. S2). (D) Predicted fate map of major cerebral cortical regions with general location of rat M1–M4 (color coded as in A and C); illustrated on the right embryonic forebrain vesicle viewed from medial aspect (4-wk human; equivalent to 11-d rat, 9/10-d mouse); adapted from ref. . E, epithalamus; H, hypothalamus; N, cerebral nuclei; T, dorsal thalamus; V, ventral thalamus.
Fig. 5.
Fig. 5.
Module distribution on surface and transverse views. (A) Surface views of the rat brain with four RCAM module domains color coded as in Figs. 3 and 4. Four vertical red lines indicate transverse levels through the brain shown in B. (B) Four transverse levels through the rat brain with modules color coded as in A; specifically, Atlas levels (AL) 8, 21, 34, and 43 of ref. are shown. ac, anterior commissure; pc, posterior commissure; all other abbreviations are in Fig. S2.
Fig. 6.
Fig. 6.
All 1,923 RCAMs mapped onto the flatmap and color coded as in Figs. 3 and 4. Connection routes were placed to follow known white-matter tracts (16) and/or to follow the shortest path between origin and termination nodes (circles), without crossing unrelated nodes between them, for clarity. For a high-resolution view with labeled nodes, see Fig. S4.
Fig. 7.
Fig. 7.
Basic logic of cortical association module organization. (A) Schematic diagram of topological relationships between cortical association modules M1–M4 (color-coded as in Figs. 4 and 5 and abstracted from the patterns in Fig. 4 and Fig. S3) with aggregate connection weights between them. Weight estimates are based on total connection number, scaled from 1 to 5 (indicated by line thickness); statistically significant differences (Table S3) are starred. (B) An alternate schematic view of topological relationship between modules M1–M4, rich-club regions (within thick red outline), and three highest ranked hubs (within thinner blue line with star, which indicates the most connected node of all, the lateral entorhinal area) nested in rich-club territory. The rich club and hubs are shown on the flatmap in Fig. S3C. CCM, caudal core module (M1, red); DSM, dorsal shell module (M3, green); RCM, rostral core module (M2, blue); VSM, ventral shell module (M4, yellow).
Fig. 8.
Fig. 8.
Data coverage effect on final connectome pattern. (A) Eight versions of cortical association connectome saved during curation with indicated percent coverage (fill ratio) and number of modules (in parentheses). Matrices are based on 69 regions because the total increased to 73 during the process of curation. (B) Empirical matrix module number (blue point at 81% coverage), eight less-covered matrices (remaining eight blue points), median module number for randomly degraded matrices (solid red line) with corresponding minimum (red shaded area lower bound) and maximum (red shaded area upper bound). (C) Agreement matrix similarities between empirical matrix (81% coverage) and eight incompletely covered matrices (blue points) and randomly degraded matrices (gray points), expressed as Pearson correlation of upper matrix triangles.

References

    1. Kandel ER, Hudspeth AJ. The brain and behavior. In: Kandel ER, Schwartz JH, Jessell TM, Siegelbaum SA, Hudspeth AJ, editors. Principles of Neural Science. 5th Ed. McGraw-Hill; New York: 2013. pp. 5–20.
    1. Swanson LW. Brain Architecture: Understanding the Basic Plan. 2nd Ed Oxford Univ Press; Oxford: 2012.
    1. Catani M, Mesulam M. What is a disconnection syndrome? Cortex. 2008;44(8):911–913. - PubMed
    1. Nieuwenhuys R, Voogd J, van Huijzen C. The Human Central Nervous System. 4th Ed Springer; Berlin: 2008.
    1. Bota M, Dong H-W, Swanson LW. From gene networks to brain networks. Nat Neurosci. 2003;6(8):795–799. - PubMed

LinkOut - more resources