. 2015 May;47(5):486-95.
doi: 10.1038/ng.3275. Epub 2015 Apr 13.

Transposon mutagenesis identifies genetic drivers of Braf(V600E) melanoma

Affiliations

Transposon mutagenesis identifies genetic drivers of Braf(V600E) melanoma

Michael B Mann et al. Nat Genet. 2015 May.

Abstract

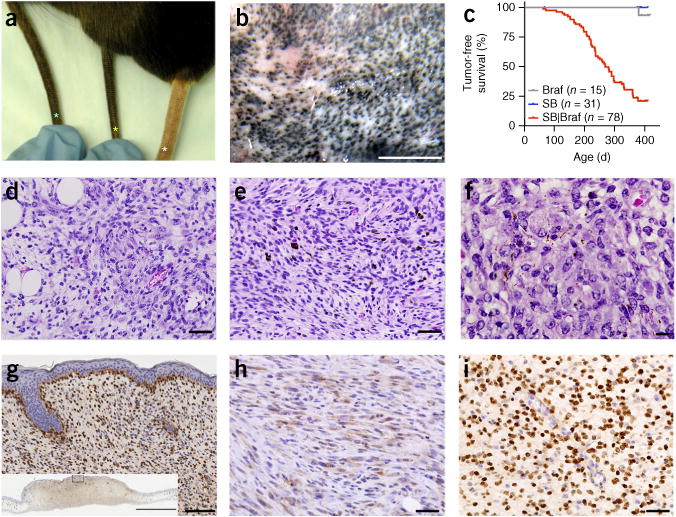
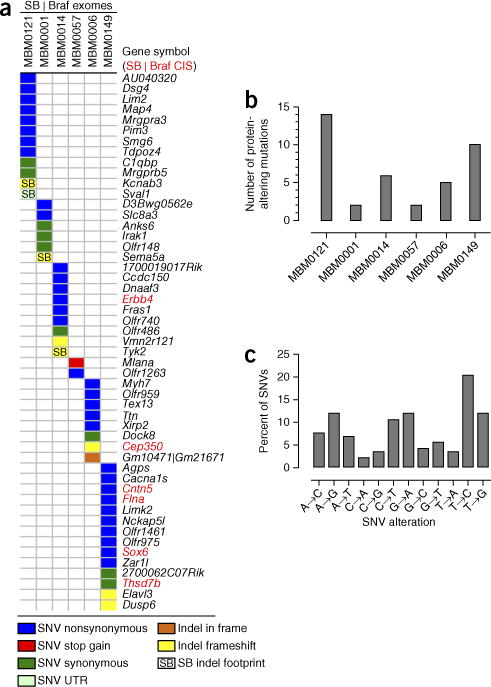
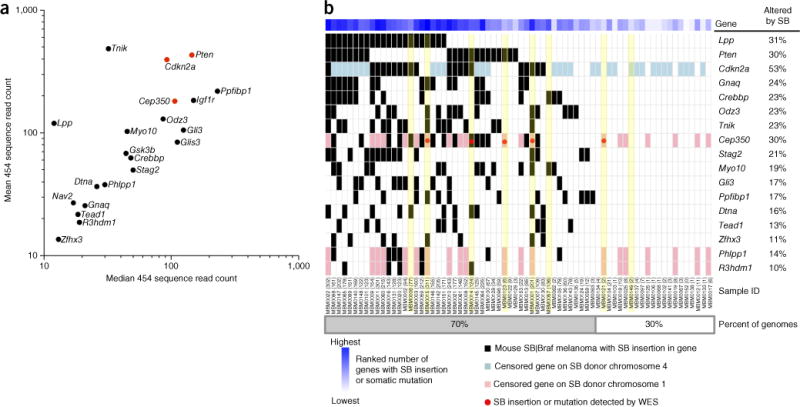
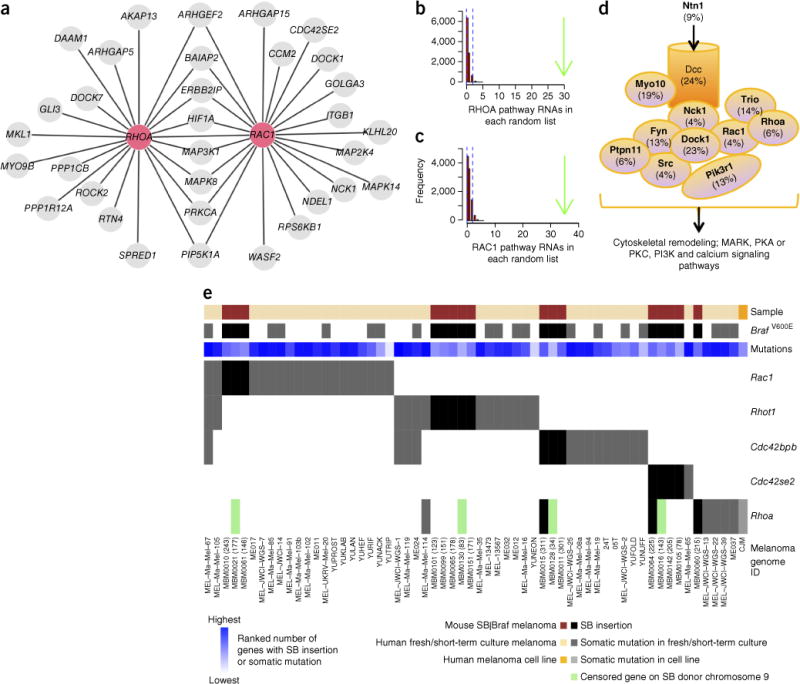
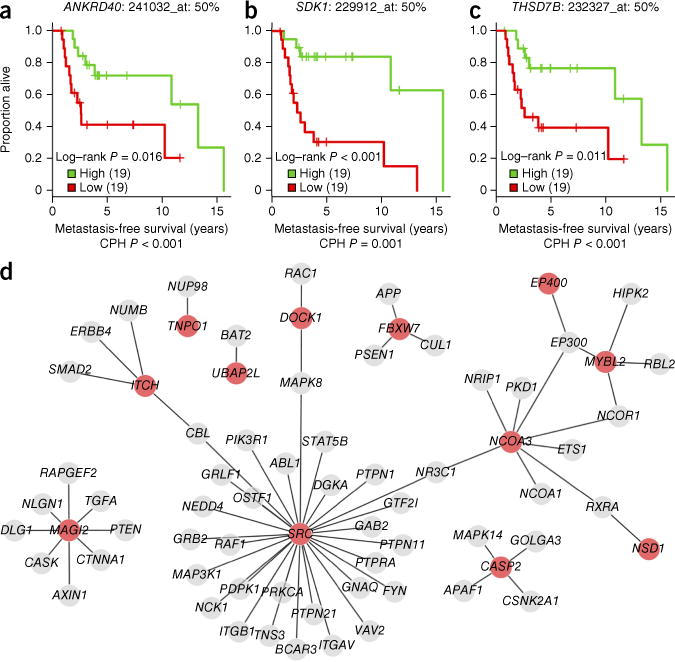
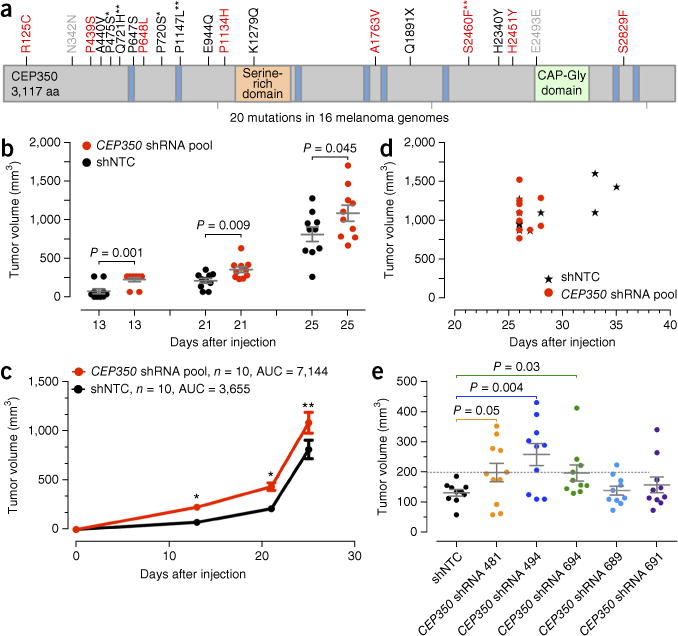
Although nearly half of human melanomas harbor oncogenic BRAF(V600E) mutations, the genetic events that cooperate with these mutations to drive melanogenesis are still largely unknown. Here we show that Sleeping Beauty (SB) transposon-mediated mutagenesis drives melanoma progression in Braf(V600E) mutant mice and identify 1,232 recurrently mutated candidate cancer genes (CCGs) from 70 SB-driven melanomas. CCGs are enriched in Wnt, PI3K, MAPK and netrin signaling pathway components and are more highly connected to one another than predicted by chance, indicating that SB targets cooperative genetic networks in melanoma. Human orthologs of >500 CCGs are enriched for mutations in human melanoma or showed statistically significant clinical associations between RNA abundance and survival of patients with metastatic melanoma. We also functionally validate CEP350 as a new tumor-suppressor gene in human melanoma. SB mutagenesis has thus helped to catalog the cooperative molecular mechanisms driving BRAF(V600E) melanoma and discover new genes with potential clinical importance in human melanoma.


Conflict of interest statement

COMPETING FINANCIAL INTERESTS

The authors declare no competing financial interests.

Figures

Figure 1
Figure 1
SB-mediated mutagenesis promotes melanoma formation in BrafV600E mutant mice. (a) Pigmentation changes in SB|Braf mice appear uniform at 25 weeks of age with all 4-OHT–painted surfaces appearing almost completely black; this was most obvious on tail skin in comparing sibling mice. Green, yellow and white asterisks denote Braf, SB|Braf and SB sibling mice, respectively. (b) Image of the underside of a dorsal skin specimen after it was removed during necropsy of an SB|Braf mouse. In wild-type mice, the dorsal skin was uniformly non-pigmented, but many individual black clones of BrafV600E-positive nevi that covered 4-OHT–painted surfaces were found in SB|Braf mice. Scale bar, 5 mm. (c) Kaplan-Meier survival curves comparing experimental SB|Braf and control sibling SB and Braf mice (log-rank test, P < 0.0001). (d–i) Histology and tumor classification from sections of skin masses stained with hematoxylin and eosin (d–f) and undergoing immunohistochemistry (IHC) analysis (g–i). (d) Melanoma showing both a loose cell pattern and a more typical melanoma pattern with nerve-like structures (400×). (e) Melanoma displaying focal schwannomatous features containing pigment granules (400×). (f) Melanoma differentiation focus with tumor cells containing pigment granules (1,000×). (g) S-100 expression in the nucleus of melanoma cells from an unpigmented melanoma (100×); inset, low magnification depicting robust S-100 expression throughout the tumor and adjacent normal skin lacking S-100 expression. (h) Cytoplasmic staining for the melanocyte-specific protein Tyrp1 using antiserum to Tyrp1 (PEP1) (400×). (i) Robust staining of nuclear SB transposase in SB|Braf melanoma cells (400×). Scale bars, 100 μm (d–l); inset, 3 mm (g).
Figure 2
Figure 2
Whole-exome sequencing of SB|Braf genomes. (a) Statistically significant SNV and indel mutations from six melanomas, including SB|Braf CISs (red) and six genes with known roles in melanoma biology (Dusp6, Irak1, Map4, Mlana, Ttn and Xirp2). (b) The protein-altering mutations found in each of the six genomes. (c) SNV mutational signature. Details regarding SNV and indel mutations appear in Supplementary Tables 16–20.
Figure 3
Figure 3
Landscape of candidate driver genes mutated in SB|Braf melanoma. (a) Driver genes for early progression consisting of 21 CIS genes with mean and median SB insertions containing 10 or more 454 sequence reads per tumor. All genes contained SB insertions in three or more melanomas and had corrected P < 0.05 by gCIS–0 kb analysis. Genes with red data points were mutated in at least 30% of SB|Braf melanomas. (b) Heat map showing the landscape of SB insertions in 17 candidate driver genes for early progression across SB|Braf melanoma genomes (one genome per column). Right, CIS gene symbols and the percentage of melanomas (n = 70) where each gene is altered by SB insertion. Four genes, Cdkn2a, Cep350, Phlpp1 and R3hdm1, occur on donor chromosome 1 or 4, and an adjustment for censored genomes was therefore made to the calculated percentage of altered melanomas by only considering non-donor chromosome genomes: Cdkn2a (20/38), Cep350 (15/50), Phlpp1 (7/50) and R3hdm1 (4/50). Bottom, 70% (49/70) of SB|Braf melanoma genomes had one or more SB insertions in 17 candidate driver genes for early progression. The genomes selected for whole-exome sequencing are highlighted in yellow. A quantitative catalog of SB insertions on an individual tumor basis can be found in Supplementary Figure 18. WES, whole-exome sequencing.
Figure 4
Figure 4
Reduced netrin signaling in SB|Braf melanoma extends the phenotypic consequence of alterations in the Rho family of GTPases. (a) Network of the functional connections from GeneSetDB linking RHOA and RAC1. In total, 30 and 35 CISs (gray nodes) had functional links (black lines) to RHOA and RAC1, respectively. (b,c) Permutation analyses demonstrated that the likelihood of identifying the numbers of CIS genes functionally linked to RHOA (b) and RAC1 (c) by chance alone was exceedingly low (empirical P < 0.0001). Histograms illustrate the results of permutation analyses: x axes show the number of genes in each of 10,000 random sets of genes that have a functional link to RHOA or RAC1 signaling in the database of molecular interactions, and y axes show frequency. Blue dashed lines indicate 95% confidence intervals, and green arrows indicate the number of CISs with functional links to RHOA or RAC1 signaling in the database of molecular interactions. (d) Schematic of the netrin signaling network, including core protein components encoded by genes mutated in SB|Braf genomes. Data for direct interactions of netrin signaling proteins (shown by the overlap of ovals) were from GeneCards and Pathway Commons. Symbols in bold correspond with CISs; Dcc was not a CIS, but inactivating SB insertions were observed in 24% of SB|Braf melanomas. (e) Heat map depicting the mutually exclusive distribution of mutations among Rho family members in SB|Braf melanomas and human melanoma genomes from published results,,,,–.
Figure 5
Figure 5
Significant clinical associations between SB|Braf CIS genes, RNA abundance and patient survival. (a–c) Survival plots for patients with metastatic melanoma based on the expression of three representative SB|Braf CIS orthologs. A poor patient survival outcome is predicted by reduced expression of ANKRD40 (a), SDK1 (b) and THSD7B (c). (d) Six CIS interaction networks of functional connections between 12 human SB|Braf CIS gene orthologs that show clinical association with RNA abundance and patient survival (red nodes) and other SB|Braf CIS orthologs (gray nodes), including the known cancer drivers FBXW7, FYN, GNAQ, NSD1, NUP98, PTEN and RAC1.
Figure 6
Figure 6
CEP350 is a melanoma tumor suppressor. (a) CEP350 alterations encoded in human melanoma genomes. Amino acid positions in gray, black and red text denote synonymous, nonsynonymous and non-damaging, and nonsynonymous and damaging alterations, respectively. Single and double asterisks denote 2 genomes with ≥2 mutations. (b–e) CEP350 depletion accelerates xenograft progression in vivo. Primary shRNA experiment consisting of 1 million A375 cells stably expressing control shNTC construct (MOI of 6; n = 10) or 3 non-overlapping, pooled shRNA constructs for CEP350 (clones 689, 691 and 694, each at MOI of 2; n = 10) injected subcutaneously into immunodeficient NSG mice. (b) Xenograft volumes calculated over a 1-month period. (c) The cohorts receiving the CEP350 shRNA pool grew significantly faster than matched cohorts receiving control shNTC. The growth curves differed significantly (P < 0.0001) when compared by two-way, repeated-measures ANOVA with Bonferroni correction for multiple comparisons. *P < 0.05, **P < 0.01, significant differences between the shNTC and CEP350 shRNA groups. (d) Time to necropsy was substantially reduced in cohorts with CEP350 shRNA. (e) Secondary shRNA experiment consisting of 1 million A375 cells stably expressing control shNTC construct (MOI of 6; n = 10) or one of five individual CEP350 shRNA constructs (MOI of 6; n = 10 per group) injected subcutaneously into NSG mice. Xenograft volumes calculated 15 d after injection show that tumor volumes met or exceeded the maximal shNTC volumes for between 20–70% of mice per cohort, with statistically significant accelerated tumor volumes achieved by CEP350 shRNA clones 481, 494 and 694. P values were calculated by one-factor ANOVA (P = 0.112) with Bonferroni post-test. Error bars, mean ± s.e.m. AUC, area under the curve.

References

    1. Chin L, Garraway LA, Fisher DE. Malignant melanoma: genetics and therapeutics in the genomic era. Genes Dev. 2006;20:2149–2182. - PubMed
    1. Yokoyama S, et al. A novel recurrent mutation in MITF predisposes to familial and sporadic melanoma. Nature. 2011;480:99–103. - PMC - PubMed
    1. Robles-Espinoza CD, et al. POT1 loss-of-function variants predispose to familial melanoma. Nat Genet. 2014;46:478–481. - PMC - PubMed
    1. Trigueros-Motos L. Mutations in POT1 predispose to familial cutaneous malignant melanoma. Clin Genet. 2014;86:217–218. - PubMed
    1. Nazarian R, et al. Melanomas acquire resistance to B-RAFV600E inhibition by RTK or N-RAS upregulation. Nature. 2010;468:973–977. - PMC - PubMed

Publication types

MeSH terms

Associated data