. 2015 May;47(5):544-9.
doi: 10.1038/ng.3274. Epub 2015 Apr 13.

Genetic conflict reflected in tissue-specific maps of genomic imprinting in human and mouse

Affiliations

Genetic conflict reflected in tissue-specific maps of genomic imprinting in human and mouse

Tomas Babak et al. Nat Genet. 2015 May.

Abstract

Genomic imprinting is an epigenetic process that restricts gene expression to either the maternally or paternally inherited allele. Many theories have been proposed to explain its evolutionary origin, but understanding has been limited by a paucity of data mapping the breadth and dynamics of imprinting within any organism. We generated an atlas of imprinting spanning 33 mouse and 45 human developmental stages and tissues. Nearly all imprinted genes were imprinted in early development and either retained their parent-of-origin expression in adults or lost it completely. Consistent with an evolutionary signature of parental conflict, imprinted genes were enriched for coexpressed pairs of maternally and paternally expressed genes, showed accelerated expression divergence between human and mouse, and were more highly expressed than their non-imprinted orthologs in other species. Our approach demonstrates a general framework for the discovery of imprinting in any species and sheds light on the causes and consequences of genomic imprinting in mammals.


Figures
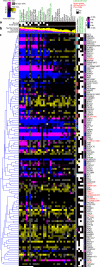
Figure 1
Figure 1
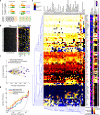
Atlas of genomic imprinting in mouse. All known and novel validated imprinted genes with at least one expressed SNP in both crosses are shown. (a), Tissue type. (b), Proportion of genes imprinted, detected using the same number of allele-specific sequencing reads in all samples. (c), Atlas generated using all sequencing reads. Genes are colored by their Imprinting Score (blue/pink) when allelic counts supported a parent-of-origin bias, and on their levels of gene expression in yellow (asinh(FPKM)) when parent-of-origin bias was absent. The y-axis was clustered treating parent-of-origin expression (blue/pink) equivalently by setting imprinting scores to positive values and non-imprinted expression (yellow) to negative values, thereby grouping similarly expressed and imprinted genes together. The x-axis was sorted on the proportion of genes imprinted. Maternal expression in e9.5 placenta is not shown since we could not reliably exclude signal stemming from contaminating maternal tissue (Supplementary Fig. 20). Genomic clusters of at least two genes (within 1 MB) were each assigned a unique color, shown on the right when these genes also cluster by imprinting pattern. ASE data used to generate the plot are available in Supplementary File 1. Previously published samples: Pre-optic area, e15 Brain, Prefrontal cortex, e9.5 Embryo, Trophoblast stem cells, e17.5 Placenta, Embryonic fibroblasts, differentially methylated regions (DMRs), uniparental disomy phenotypes (Mousebook/Harwell Phenotype Maps) (e.g. Mat-UPD indicates that gene is within a region that affects a phenotype when both copies of the region are maternal). *Promising novel imprinted gene candidates only imprinted in one tissue (Supplementary Table 3).
Figure 2
Figure 2
Atlas of genomic imprinting in human. (a), ASE caused by genetic polymorphisms will tend to be biased towards the same allele (orange) in heterozygotes, which are at most 50% of individuals. In contrast, ASE due to imprinting will be present in all individuals, but will not favor either allele. (b), ASE for all genes powered (see Methods) in all available GTEx.v3 samples. ASE is scaled from −1 (100% expression of one allele) to +1 (100% expression from the other allele) and sorting genes on Ʃ yielded 7 known imprinted genes (green) among the top 12. (c), Resolving mean(|ASE|) further by plotting against mean(ASE) reveals the tendency for imprinted genes to switch bias between alleles (i.e. y ≈ 0) and for the strongest imprinted genes to have allele-specific methylation (ASM; shown are genes identified in 10/22 or more biological samples) marks. (d), Number of known imprinted genes, detected among all genes sorted using various scoring schemes. Combining ASM and RNA scores (into CS) improves overall performance. Hippocampus shown in (c-d), other tissues behaved similarly. (e),Monoallelic expression of imprinted genes in 45 human tissues. Genes with a CS<0 (no evidence for imprinting) are colored blue. Clustering was done using Manhattan distance. Right panels: Pedigree analysis shown as average parent-of-origin bias of 2 parents and 11 children. Precision is the proportion of positive calls that are known imprinted genes given the 45 tissue-specific CS values to establish a threshold (see Methods). *Validated by mmPCR-Seq. Known (black): Geneimprint, novel (colored in red).
Figure 3
Figure 3
Species comparisons of imprinting. (a), Conservation of allelic bias between human and mouse. Average allelic bias is generally conserved between the two species. Tissue-specific imprinting was strongest between CNS and non-CNS samples and is conserved between species. (b), Genes that are imprinted in both species (B; nhuman=47, nmouse=54) have stronger allelic bias relative to species-specific (SS; nhuman=47, nmouse=71) imprinted genes (median in red, box delineates 25th/75th quartiles, whiskers show range of non-outliers) (c), Examples of top maternal/paternal pairings (also see Supplementary Fig. 16). (d), Strongly imprinted genes (high allelic bias in many tissues) have more divergent gene expression between human and mouse relative to all genes (Wilcoxon p=0.012; Supplementary Fig. 18, Supplementary Fig. 19; box plot metrics same as b). z-scores were computed against gene expression divergence of randomly selected genes matched for breadth of expression (see Methods). Expr = asinh(FPKM), median subtracted for each gene within species. (e), Significance of within-human expression variation comparisons for top 15, 20, and 25 most strongly imprinted genes (1,000 permutations); colors=strongest imprinting bins from d, grayscale=genes randomized to demonstrate null. (f) Example of a gene with elevated expression in species and tissues where it is imprinted. Ctx=cortex, Cer=cerebellum. (g) Sorted log-ratios of mean mouse/human (imprinted) expression vs. mean platypus/chicken (not imprinted) orthologs in gene-tissue combinations where imprinted in both human and mouse. Expression was elevated in mouse/human (p=0.0033; c.f. randomly selected non-imprinted genes in the same tissues).

References

    1. Barlow DP. Gametic imprinting in mammals. Science. 1995;270:1610–3. - PubMed
    1. Barlow DP, Bartolomei MS. Genomic imprinting in mammals. Cold Spring Harb Perspect Biol. 2014;6 - PMC - PubMed
    1. Moore T, Haig D. Genomic imprinting in mammalian development: a parental tug-of war. Trends Genet. 1991;7:45–9. - PubMed
    1. Spencer HG, Clark AG. Non-conflict theories for the evolution of genomic imprinting. Heredity (Edinb) 2014 - PMC - PubMed
    1. Wilkins JF, Haig D. What good is genomic imprinting: the function of parent- specific gene expression. Nat Rev Genet. 2003;4:359–68. - PubMed

Publication types