. 2015 May;16(5):525-33.
doi: 10.1038/ni.3133. Epub 2015 Apr 6.

Rapid linkage of innate immunological signals to adaptive immunity by the brain-fat axis

Affiliations

Rapid linkage of innate immunological signals to adaptive immunity by the brain-fat axis

Min Soo Kim et al. Nat Immunol. 2015 May.

Abstract

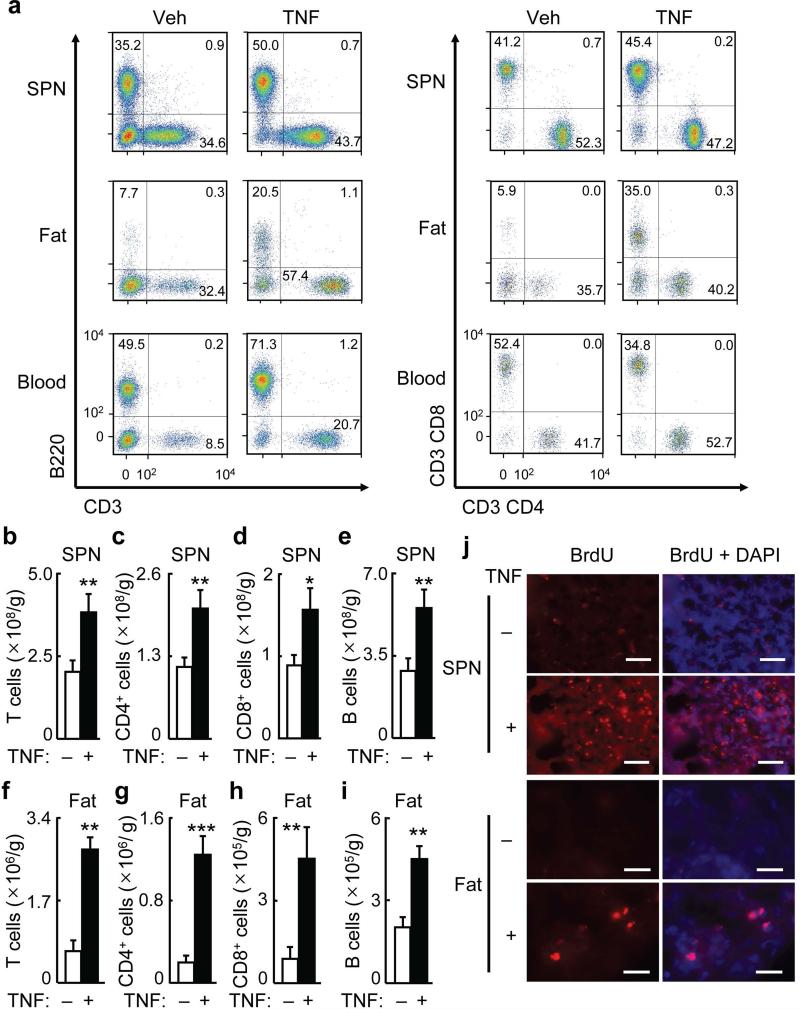
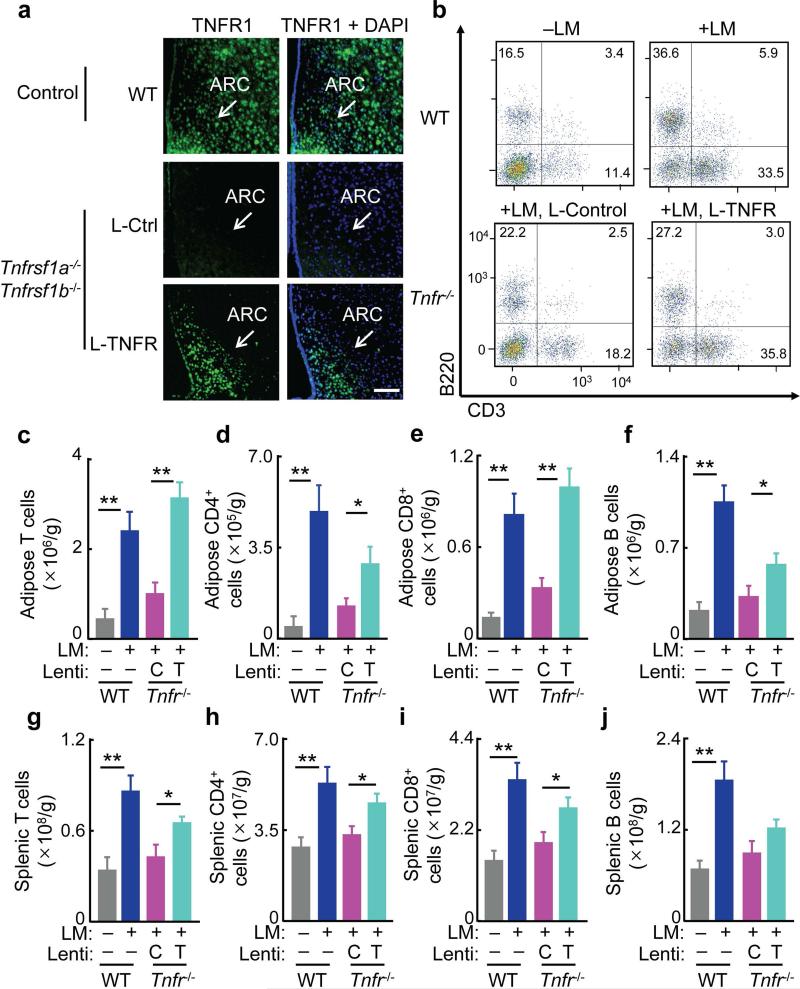
Innate immunological signals induced by pathogen- and/or damage-associated molecular patterns are essential for adaptive immune responses, but it is unclear if the brain has a role in this process. Here we found that while the abundance of tumor-necrosis factor (TNF) quickly increased in the brain of mice following bacterial infection, intra-brain delivery of TNF mimicked bacterial infection to rapidly increase the number of peripheral lymphocytes, especially in the spleen and fat. Studies of various mouse models revealed that hypothalamic responses to TNF were accountable for this increase in peripheral lymphocytes in response to bacterial infection. Finally, we found that hypothalamic induction of lipolysis mediated the brain's action in promoting this increase in the peripheral adaptive immune response. Thus, the brain-fat axis is important for rapid linkage of innate immunity to adaptive immunity.


Figures

Figure 1
Figure 1
Central TNF injection rapidly increases splenic and adipose lymphocytes. C57BL/6 mice received daily TNF (10 pg) (+) vs. vehicle (Veh, −) injection in hypothalamic third ventricle for 3 days, and tissues were harvested for flow cytometry (a–i), while some mice received i.p. BrdU injection at 2 hours prior to collection of tissues for BrdU staining (j). (a) Dot plots of T cells (CD3+), B cells (B220+), CD4+ cells (CD3+CD4+), and CD8+ cells (CD3+CD8+) in the spleen (SPN) (upper panels), epididymal fat (middle panels), and blood (lower panels). Dot plots represent 8–11 mice per group. (b–e) Numbers of T cells (CD3+) (b), CD4+ cells (CD3+CD4+) (c), CD8+ cells (CD3+CD8+) (d), B cells (B220+) (e) cells per gram of SPN. (f–I) Numbers of T cells (CD3+) (f), CD4+ cells (CD3+CD4+) (g), CD8+ cells (CD3+CD8+) (h), B cells (B220+) (i) cells per gram of epididymal fat. (j) BrdU staining (red) of spleen and epididymal fat sections. DAPI staining (blue) was used to reveal all cells in tissue sections. Images represent 3–4 mice per group. Scale bar = 50 μm. *P < 0.05, **P < 0.01, ***P < 0.001 (two-tailed Student's t-test); n = 8–11 mice per group (b–i). All data (mean) represent at least three independent experiments with similar observations (error bars, s.e.m.).
Figure 2
Figure 2
Bacterial infection-induced adaptive immune response requires brain TNF. C57BL/6 mice given pre-injection of the TNF antagonist WP9QY (W) or the vehicle artificial cerebrospinal fluid (Veh) into the hypothalamic ventricle 1 d before infection with L. monocytogenes (+LM) or vehicle (−LM) and then maintained with daily hypothalamic injection of WP9QY or vehicle for 3 d. After 3-day bacterial infection, mice were sacrificed and tissues were harvested for flow cytometry analysis. (a) Dot plots of T cells (CD3+), CD4+ cells (CD3+CD4+), CD8+ cells (CD3+CD8+) and B cells (B220+) in the epididymal fat and spleen (SPN). Dot plots represent 6–8 mice per group. (b–e) Numbers of T cells (CD3+) (b), CD4+ cells (CD3+CD4+) (c), CD8+ cells (CD3+CD8+) (d) and B cells (B220+) (e) per gram of epididymal fat. (f–i) Numbers of T cells (CD3+) (f), CD4+ cells (CD3+CD4+) (g), CD8+ cells (CD3+CD8+) (h) and B cells (B220+) (i) per gram of spleen. *P < 0.05, **P < 0.01, ***P < 0.001 (ANOVA, Tukey's post-hoc); n = 6–8 mice per group (b– i). All data (mean) represent two independent experiments with similar observations (error bars, s.e.m.).
Figure 3
Figure 3
Hypothalamic TNF receptor is required for adaptive immune response in infection. Standard C57BL/6 mice were bilaterally injected in the arcuate nucleus (ARC) with lentiviral TNFR1 and TNFR2 shRNA (TNFR1 & TNFR2-s, T-s) vs. nontargeting control shRNA (Control-s, C-s), and after 1-week recovery, these mice were infected with Listeria monocytogenes (LM, +) vs. vehicle (−) via intravenous injection. Control mice that did not receive LM injection were included as basal controls (Ctrl). After 3-day bacterial infection, mice were sacrificed and tissues were harvested for flow cytometry analysis. (a) TNFR1 or TNFR2 immunostaining (green) of the MBH. DAPI staining (blue) was used to reveal all cells in tissue sections. Images represent 3–4 mice per group. Scale bar = 200 μm. (b) Dot plots of T cells (CD3+) and B cells (B220+) in epididymal fat and spleen (SPN). Dot plots represent 5–7 mice per group. (c–j) Numbers of T cells (CD3+) (c,g), CD4+ cells (CD3+CD4+) (d,h), CD8+ cells (CD3+CD8+) (e,i) and B cells (B220+) (f,j) per gram of epididymal fat (c–f) or SPN (g–j). *P < 0.05, **P < 0.01 (ANOVA, Tukey's post-hoc); n = 5–7 mice per group (c–j). All data (mean) represent two independent experiments with similar observations (error bars, s.e.m.).
Figure 4
Figure 4
Hypothalamic TNFR restoration improves adaptive immunity in TNFR-null mice. TNFR-null mice (Tnfrsf1a−/− Tnfrsf1b−/−, Tnfr−/−) and wild-type (WT) mice were bilaterally injected in the arcuate nucleus (ARC) with lentiviral TNFR1 (L-TNFR, T) vs. lentiviral control (L-Ctrl, C), and after 1-week recovery, these mice were infected with Listeria monocytogenes (+LM or +) via intravenous injection. WT mice without receiving LM injection (–LM or –) were included to provide the basal profiles. After 3-day bacterial infection, mice were sacrificed and tissues were harvested for flow cytometry analysis. (a) TNFR1 immunostaining (green) of the MBH. DAPI staining (blue) was used to reveal all cells in tissue sections. Images represent 3–4 mice per group. Scale bar = 200 μm. (b) Dot plots of T cells (CD3+) and B cells (B220+) in epididymal fat. Dot plots represent 5–7 mice per group. (c–j) Numbers of T cells (CD3+) (c,g), CD4+ cells (CD3+CD4+) (d,h), CD8+ cells (CD3+CD8+) (e,i) and B cells (B220+) (f,j) per gram of epididymal fat (c–f) and spleen (g–j). *P < 0.05, **P < 0.01 (ANOVA, Tukey's post-hoc); n = 5–7 mice per group (c–j). All data (mean) represent two independent experiments with similar observations (error bars, s.e.m.).
Figure 5
Figure 5
Central induction of lipolysis mediates initiation of adaptive immune response. (a–f) C57BL/6 mice received TNF (10 pg) (+) vs. vehicle (−) injection in hypothalamic third ventricle (a,b) as described in Fig. 1, or were injected with Listeria monocytogenes (LM, +) vs. vehicle (−) (c,d), co-treated with TNF antagonist WP9QY (W) and LM injection (e) as described in Fig. 2, or treated with lentiviral TNFR1 & TNFR2 shRNA (T-s) vs. lentiviral scramble shRNA (C-s) (f) as described in Fig. 3, and following these treatments at the same time points as described in Fig. 1 to 3, epididymal fat and blood were harvested for measuring adipose mRNA levels of indicated genes (a, d) and serum FFA levels (b,c,e,f). (g–j) C57BL/6 mice received daily i.p. injections of palmitic acid (PA), lenoleic acid (LA) vs. vehicle (Veh) for 3 days, and tissues were then harvested for flow cytometry analysis. Data show numbers of T cells (CD3+) (g,k), CD4+ cells (CD3+CD4+) (h,l), CD8+ cells (CD3+CD8+) (i,m) and B cells (B220+) (j,n) per gram of epididymal fat (g–j) or spleen (SPN) (k–n). *P < 0.05, **P < 0.01 (ANOVA, Tukey's post-hoc); n = 4–6 mice per group (a–f), n = 5–6 mice per group (g–n). All data (mean) represent at least three independent experiments with similar observations (error bars, s.e.m.).
Figure 6
Figure 6
Fatty acid inhibition attenuates brain TNF- or infection-induced adaptive immunity. Standard C57BL/6 mice received an i.p. injection of cerulenin (Cer, +) vs. vehicle saline (−) on the day prior to other treatments (a–p), followed by daily hypothalamic third-ventricle injections of 10 pg TNF (+) vs. vehicle aCSF (−) together with daily i.p. injections of cerulenin for 3 days (a–h), or followed by a single intravenous injection of Listeria monocytogenes (LM, +) vs. the vehicle (−) while daily i.p. injections of cerulenin continued for 3 days (i–p). Following these treatments, tissues were harvested and subjected to flow cytometry analysis. Data show numbers of T cells (CD3+) (a,e,i,m), CD4+ cells (CD3+ CD4+) (b,f,j,n), CD8+ cells (CD3+ CD8+) (c,g,k,o) and B cells (B220+) (d,h,l,p) per gram of epididymal fat (a–d,i–l) or spleen (SPN) (e–h,m–p) in TNF-injected (a–h) or LM-infected mice (i–p). *P < 0.05, **P < 0.01, ***P < 0.001 (ANOVA, Tukey's post-hoc); n = 5–7 mice per group. All data (mean) represent at least three independent experiments with similar observations (error bars, s.e.m.).
Figure 7
Figure 7
Acute effect of the brain–fat axis on adaptive immunity is mediated by adipose nerve. C57BL/6 mice received epididymal fat denervation (Den) vs. sham surgery and at the same time were implanted with cannula in hypothalamic third ventricle, and following 1-week recovery, these animals received 3-day daily injections of TNF (10 pg) (+) vs. vehicle (−) via the pre-implanted cannula for 3 days, and tissues were harvested for flow cytometry. (a) Dot plots of T cells (CD3+), B cells (B220+), CD4+ cells (CD3+ CD4+) and CD8+ cells (CD3+ CD8+) in epididymal fat. Dot plots represent 7–8 mice per group. (b–i) Numbers of T cells (CD3+) (b,f), CD4+ cells (CD3+ CD4+) (c,g), CD8+ cells (CD3+ CD8+) (d,h) and B cells (B220+) (e,i) per gram of epididymal fat (b–e) and spleen (f–i). *P < 0.05, **P < 0.01 (ANOVA, Tukey's post-hoc); n = 7–8 mice per group (b–j). All data (mean) represent three independent experiments with similar observations (error bars, s.e.m.).
Figure 8
Figure 8
Chronic neuroinflammation desensitizes the central regulation of adaptive immunity. Adult C57BL/6 mice received HFD feeding to develop obesity, and matched mice maintained on a normal chow were used as normal controls. These mice received daily injections of TNF (+) vs. vehicle (−) in the hypothalamic third ventricle for 3 days, and tissues were harvested for flow cytometry (a–h) and inflammatory gene expression in the hypothalamus (i–l). Data in (a–h) show numbers of T cells (CD3+) (a,e), CD4+ cells (CD3+ CD4+) (b,f), CD8+ cells (CD3+ CD8+) (c,g) and B cells (B220+) (d,h) per epididymal fat (a–d) or per gram of spleen (e–h). *P < 0.05, **P < 0.01, ***P < 0.001(ANOVA, Tukey's post-hoc); All data (mean) represent two independent experiments with similar observations (error bars, s.e.m.).

Comment in

Similar articles

Cited by

References

    1. Beutler B. Innate immunity: an overview. Mol. Immunol. 2004;40:845–859. - PubMed
    1. Janeway CA, Jr., Medzhitov R. Innate immune recognition. Annu. Rev. Immunol. 2002;20:197–216. - PubMed
    1. Rubartelli A, Lotze MT. Inside, outside, upside down: damage-associated molecular-pattern molecules (DAMPs) and redox. Trends. Immunol. 2007;28:429–436. - PubMed
    1. Hoebe K, Janssen E, Beutler B. The interface between innate and adaptive immunity. Nat. Immunol. 2004;5:971–974. - PubMed
    1. Kabelitz D, Medzhitov R. Innate immunity--cross-talk with adaptive immunity through pattern recognition receptors and cytokines. Curr. Opin. Immunol. 2007;19:1–3. - PubMed

Publication types

MeSH terms

Substances