. 2015 May;16(5):517-24.
doi: 10.1038/ni.3146. Epub 2015 Apr 6.

Let-7 microRNAs target the lineage-specific transcription factor PLZF to regulate terminal NKT cell differentiation and effector function

Affiliations

Let-7 microRNAs target the lineage-specific transcription factor PLZF to regulate terminal NKT cell differentiation and effector function

Leonid A Pobezinsky et al. Nat Immunol. 2015 May.

Abstract

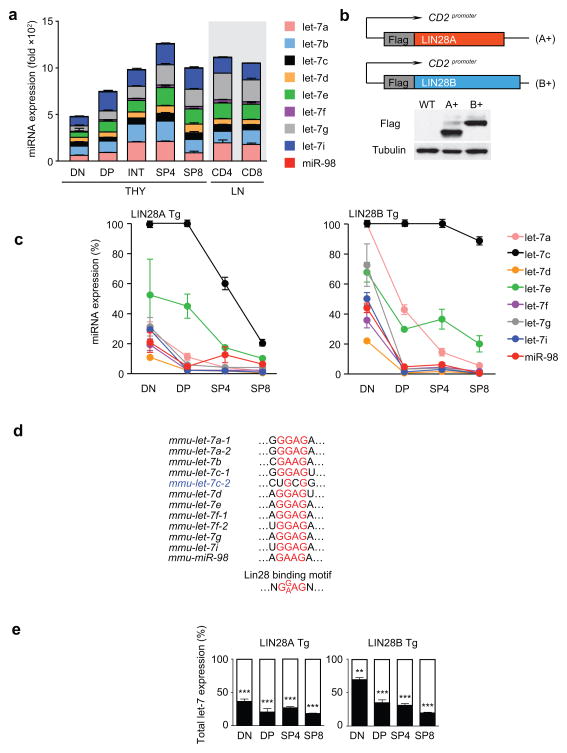
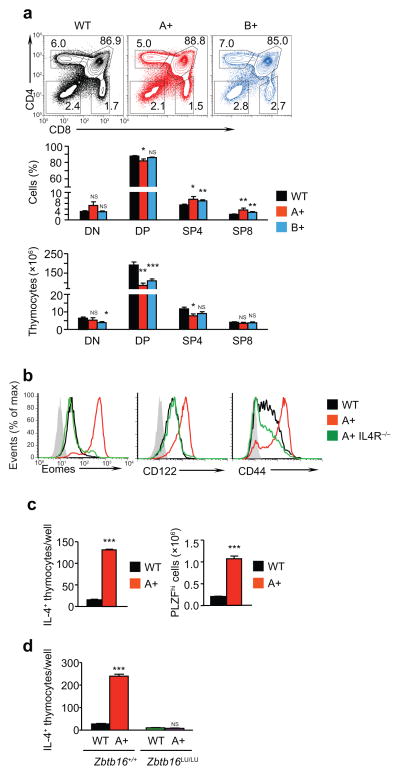
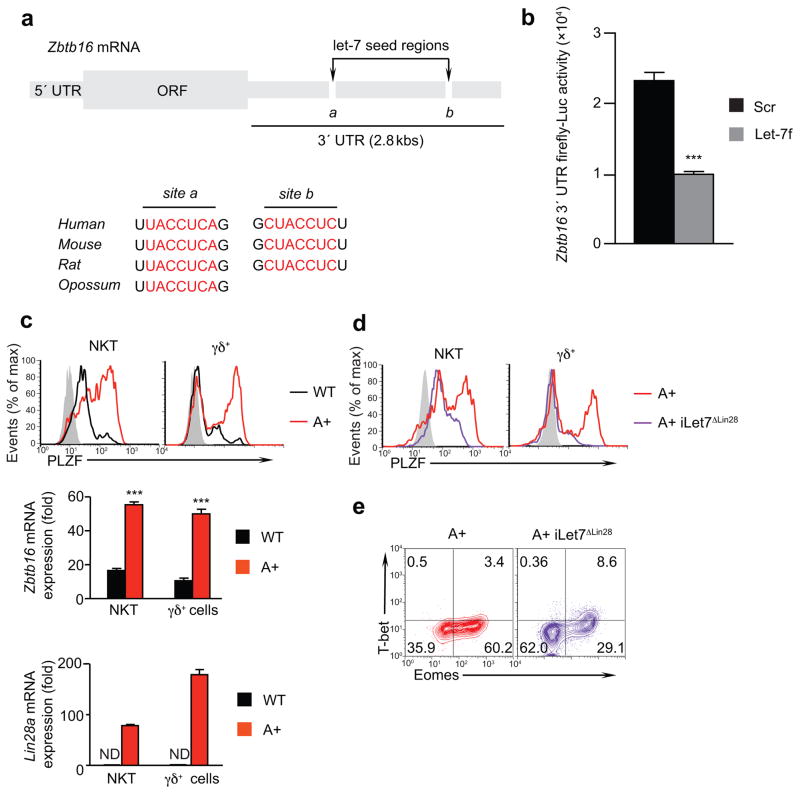
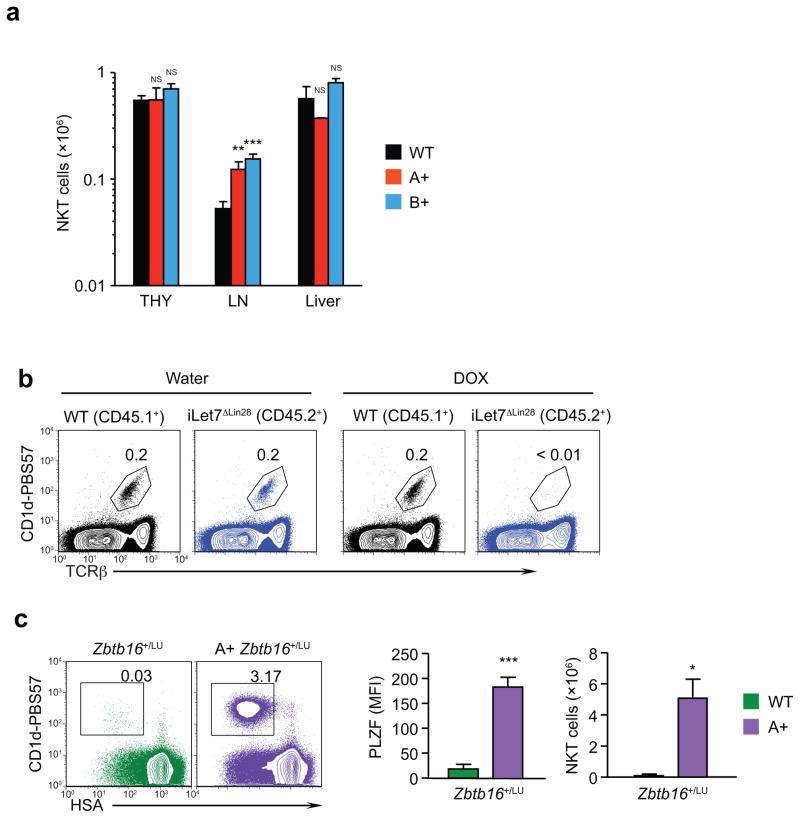
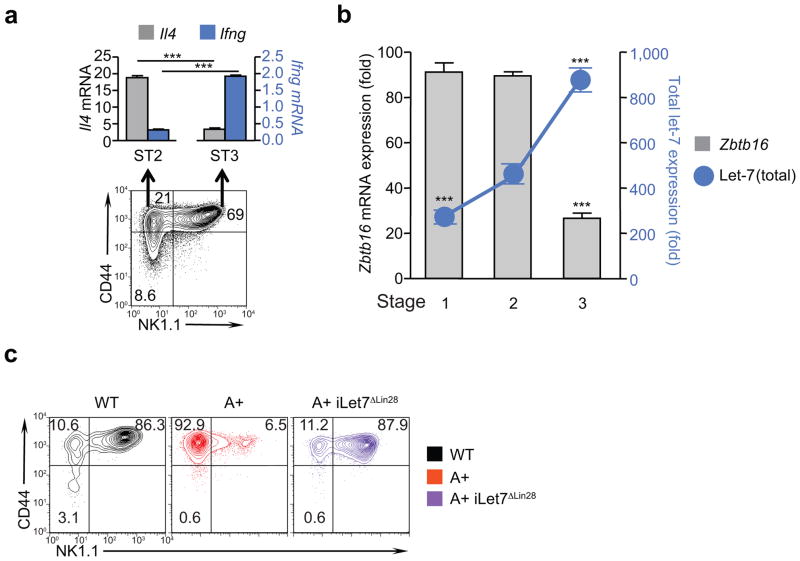
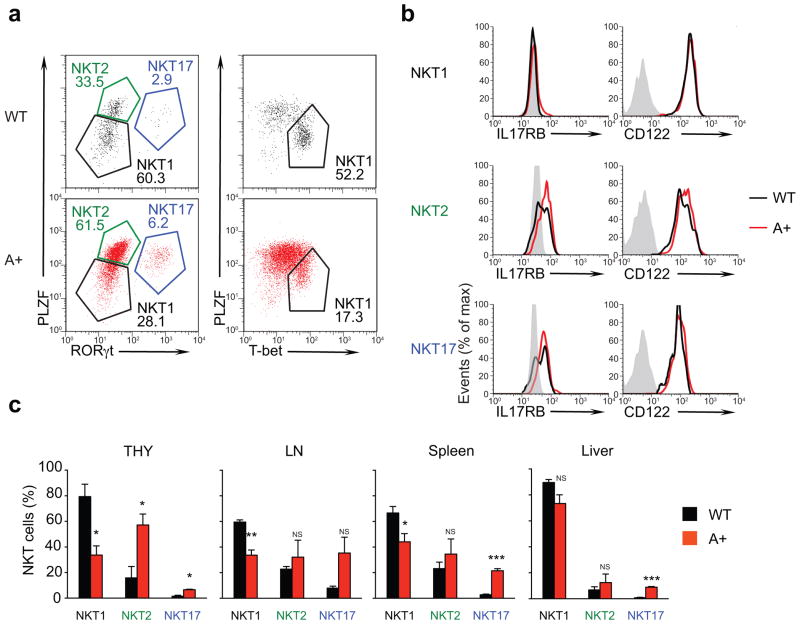
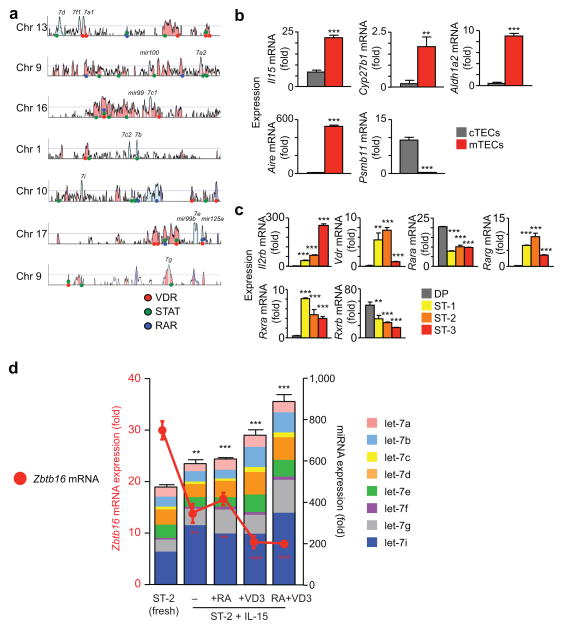
Lethal-7 (let-7) microRNAs (miRNAs) are the most abundant miRNAs in the genome, but their role in developing thymocytes is unclear. We found that let-7 miRNAs targeted Zbtb16 mRNA, which encodes the lineage-specific transcription factor PLZF, to post-transcriptionally regulate PLZF expression and thereby the effector functions of natural killer T cells (NKT cells). Dynamic upregulation of let-7 miRNAs during the development of NKT thymocytes downregulated PLZF expression and directed their terminal differentiation into interferon-γ (IFN-γ)-producing NKT1 cells. Without upregulation of let-7 miRNAs, NKT thymocytes maintained high PLZF expression and terminally differentiated into interleukin 4 (IL-4)-producing NKT2 cells or IL-17-producing NKT17 cells. Upregulation of let-7 miRNAs in developing NKT thymocytes was signaled by IL-15, vitamin D and retinoic acid. Such targeting of a lineage-specific transcription factor by miRNA represents a previously unknown level of developmental regulation in the thymus.


Figures

Figure 1
Figure 1. let-7 miRNA expression in wild-type and LIN28 Tg thymocytes
(a) Expression of individual let-7 miRNAs in purified thymocyte and T cell populations as determined by quantitative RT-PCR. miRNA expression is shown relative to U6 snoRNA control. Data are displayed as mean ± SE of quadruplicate samples from a representative of 3 independent experiments. (b) Schematic representation of LIN28 transgenic constructs used to generate LIN28 Tg mice (top). LIN28A (209aa) and LIN28B (247aa) protein content of total thymocytes from wild-type and LIN28 Tg mice as determined by Western blotting (bottom) with similar results in 3 independent experiments. (c) Expression of individual let-7 family members in thymocytes from LIN28A Tg and LIN28B Tg mice. Expression of let-7 family members in each LIN28 Tg thymocyte subset is expressed relative to that in the corresponding wild-type thymocyte subset. Data are displayed as mean ± SE of triplicate samples from a representative of 3 independent experiments. (d) Alignment of the distal LIN28 binding motif in let-7 pre-element sequences in let-7 family members. (e) Overall let-7 expression in thymocyte subsets from LIN28 Tg mice relative to wild-type mice (which was set equal to 100%), as determined by quantitative RT-PCR. Data are displayed as mean ± SE of quadruplicate samples and are representative of at least 3 independent experiments. Values from LIN28 Tg mice relative to wild-type mice were assessed for statistical significance. *, p<.05; **, p<.01; ***, p<.001; NS, not significant p>.05.
Figure 2
Figure 2. Analysis of thymocytes in LIN28 Tg mice
(a) CD4 versus CD8 expression on thymocytes from wild-type (n=12), LIN28A Tg (A+, n=7), and LIN28B Tg (B+, n=10) mice (top). Frequency (middle) and absolute number (bottom) of thymocyte sub-populations in indicated mice. Data are displayed as mean ± SE of each thymocyte subset from individual mice in 12 independent experiments. In each group, values from LIN28 Tg mice were compared to wild-type mice. (b) Phenotypic analysis of SP8 thymocytes for naïve or memory markers by intracellular staining for Eomes and surface staining for CD122 and CD44. Negative control staining is shown in gray. (c) Quantification of IL-4-producing thymocytes by ELISpot (left) and quantification of PLZFhi thymocytes by intracellular staining and flow cytometry (right). (d) Quantification of IL-4-producing thymocytes from wild-type and LIN28 Tg mice containing homozygous amounts of either wild-type or mutant PLZF. Data are displayed as mean ± SE of triplicate samples (c) or quadruplicate samples (d) from a representative of 3 independent experiments. Values from LIN28 Tg mice are compared to those from wild-type mice in each group. *, p<.05; **, p<.01; ***, p<.001; NS, not significant p>.05.
Figure 3
Figure 3. let-7 miRNAs target Zbtb16 mRNA
(a) Schematic of Zbtb16 mRNA highlighting the two let-7 binding sites in its 3′-UTR (top). Sequence alignment of the two let-7 binding sites (site a and site b) in the 3′-UTR of Zbtb16 mRNA from several different species (bottom). (b) let-7 targeting of the Zbtb16 3′-UTR in a luciferase reporter assay. 293T cells were co-transfected with a firefly luciferase reporter along with either a let-7 miRNA or a control scrambled miRNA. Firefly luciferase activity was normalized to control renilla luciferase activity. Data are displayed as mean ± SE of quadruplicate samples from a representative of 3 independent experiments. Values from cells transfected with let-7 were compared to those transfected with scrambled miRNA. (c) PLZF protein expression in wild-type and LIN28 Tg thymocytes was determined by intracellular staining and flow cytometry (top). Control staining is shown in gray. Thymocyte content of Zbtb16 mRNA (middle) and LIN28 mRNA (bottom) was determined by quantitative RT-PCR relative to Rpl13a expression. Data are displayed as mean ± SE of quadruplicate samples from a representative of 3 independent experiments. In each group, values from LIN28 Tg mice are compared to those from wild-type mice. ND, not detected. (d) PLZF protein expression was determined by intracellular staining and flow cytometry in thymocytes from LIN28 Tg mice and LIN28.iLet7ΔLIN28 Tg mice. Control staining is shown in gray. (e) Intracellular T-bet versus Eomes expression in SP8 thymocytes from LIN28 Tg and LIN28.iLet7ΔLIN28 Tg mice. *, p<.05; **, p<.01; ***, p<.001;
Figure 4
Figure 4. Effect of let-7 and PLZF on NKT thymocytes
(a) Absolute numbers of NKT cells in the thymus and periphery of wild-type and LIN28 Tg mice. Data are displayed as mean ± SE from thymi (wild-type, n=9; LIN28A Tg, n=6; and LIN28B Tg, n=7), LNs (wild-type, n=7; LIN28A Tg, n=5; and LIN28B Tg, n=7), and livers (wild-type, n=3; LIN28A Tg, n=2; and LIN28B Tg, n=3) from mice of each strain from 9 independent experiments. In each group, values from LIN28 Tg mice are compared to those from wild-type mice. (b) Mixed bone marrow chimeras were constructed by injecting equal mixtures of wild-type and iLet7ΔLIN28 Tg bone marrow cells into lethally irradiated CD45.1 B6 host mice. Beginning on day 2 after chimera construction and continuing for 8 weeks when the mice were analyzed, mice were given either plain or doxycycline-supplemented drinking water. Protocol for chimera construction is visually displayed in Supplementary Fig. 1. Flow cytometric analyses of chimeric thymi 8 weeks later is shown. The box in each histogram identifies NKT thymocytes and numbers indicate their frequency. (c) Comparison of NKT thymocytes in wild-type and PLZFwt/lu heterozygous mice (left). Box in each histogram identifies NKT thymocytes and numbers indicate their frequency among total thymocytes. PLZF expression in NKT thymocytes was quantified as mean fluorescent intensity (MFI) (middle). Absolute NKT thymocyte numbers are shown (right). Data are displayed as mean + SE of 3–6 individual mice in 3 independent experiments. In each group, values from LIN28 Tg mice are compared to those from wild-type mice. *, p<.05; **, p<.01; ***, p<.001; NS, not significant p>.05.
Figure 5
Figure 5. Reduced let-7 expression prevents generation of IFN-γ-producing NKT cells
(a) IL-4 and IFN-γ mRNA content in purified CD24lo NKT thymocytes from B6 mice at different stages of differentiation, referred to as stages 1–3 (upper panel). Data are displayed as mean ± SE of quadruplicate samples and are representative of 3 independent experiments. Numbers in histogram indicate cell frequency within that quadrant. (b) Zbtb16 mRNA (left axis) and let-7 miRNA content (right axis) in NKT thymocytes at various stages of differentiation as determined by quantitative RT-PCR. Data are displayed as mean ± SE of quadruplicate samples from a representative of 3 independent experiments. Values of Zbtb16 mRNA and let-7 miRNA in stage 1 and stage 3 cells are each compared to their respective values in stage 2 cells. (c) CD44 and NK1.1 expression on NKT thymocytes from dox treated wild-type, LIN28A Tg, and LIN28A.iLet7ΔLIN28 Tg mice. mRNA and miRNA expression were determined relative to Rpl13a or U6 controls, respectively. ***, p<.001.
Figure 6
Figure 6. Impact of let-7 on NKT effector cell lineages
(a) NKT thymocytes were assessed for transcription factor expression by intracellular staining for PLZF vs RORγt and PLZF vs T-bet (numbers indicate frequency of gated cells), and (b) for surface expression of IL17RB and CD122. Control staining is shown in gray. (c) Frequency of NKT1, NKT2, and NKT17 effector cells among NKT cells in the thymus, LN, spleen, and liver of wild-type and LIN28 Tg mice. Data are displayed as mean ± SE of 3 individual mice from 3 independent experiments. In each group, values from LIN28 Tg mice are compared to those from wild-type mice. *, p<.05; **, p<.01; ***, p<.001; NS, not significant, p>.05.
Figure 7
Figure 7. Signals that up-regulate let-7 expression in developing NKT thymocytes
(a) Vista conservation analysis of human and murine let-7 genomic regions. Peaks represent degree of conservation. Colored circles indicate potential binding sites for VDR, Vitamin D Receptor (red); STAT, Signal Transducer and Activator of Transcription (green); and RAR, Retinoic Acid Receptors (blue). (b) Gene expression in purified cTECs and mTECs as determined by quantitative RT-PCR. As indicators of cell purity, the Aire gene is only expressed in mTECs, whereas the Psmb11 gene encoding the β5t proteosomal protein is only expressed in cTECs. Data are displayed as mean ± SE of quadruplicate samples from a representative of 3 independent experiments. For each gene, values from mTECs are compared to cTECs. (c) Gene expression in DP thymocytes and NKT thymocytes at different stages of differentiation as determined by quantitative RT-PCR. Data are displayed as mean ± SE of quadruplicate samples from a representative of 3 independent experiments. For each gene, values in developing NKT thymocytes are compared to that of DP thymocytes. (d) Purified CD44hiNK1.1 thymocytes at NKT developmental stage 2 were analyzed fresh or after 48h culture under various conditions and assessed for expression of Zbtb16 mRNA (left axis) and let-7 miRNAs (right axis) by quantitative RT-PCR. Data are displayed as mean ± SE of quadruplicate samples from a representative of 3 independent experiments. Values for Zbtb16 mRNA and let-7 miRNAs from stage 2 NKT cells after 48h culture are compared to their values in fresh stage 2 NKT cells. mRNA and miRNA expression was determined relative to Rpl13a or U6 controls, respectively. *, p<.05; **, p<.01; ***, p<.001.

Similar articles

Cited by

References

    1. Brunkow ME, Jeffery EW, Hjerrild KA, Paeper B, Clark LB, Yasayko SA, Wilkinson JE, Galas D, Ziegler SF, Ramsdell F. Disruption of a new forkhead/winged-helix protein, scurfin, results in the fatal lymphoproliferative disorder of the scurfy mouse. Nat Genet. 2001;27:68–73. - PubMed
    1. Taniuchi I, Osato M, Egawa T, Sunshine MJ, Bae SC, Komori T, Ito Y, Littman DR. Differential requirements for Runx proteins in CD4 repression and epigenetic silencing during T lymphocyte development. Cell. 2002;111:621–633. - PubMed
    1. He X, He X, Dave VP, Zhang Y, Hua X, Nicolas E, Xu W, Roe BA, Kappes DJ. The zinc finger transcription factor Th-POK regulates CD4 versus CD8 T-cell lineage commitment. Nature. 2005;433:826–833. - PubMed
    1. Sun G, Liu X, Mercado P, Jenkinson SR, Kypriotou M, Feigenbaum L, Galera P, Bosselut R. The zinc finger protein cKrox directs CD4 lineage differentiation during intrathymic T cell positive selection. Nat Immunol. 2005;6:373–381. - PubMed
    1. Kovalovsky D, Uche OU, Eladad S, Hobbs RM, Yi W, Alonzo E, Chua K, Eidson M, Kim HJ, Im JS, Pandolfi PP, Sant’Angelo DB. The BTB-zinc finger transcriptional regulator PLZF controls the development of invariant natural killer T cell effector functions. Nat Immunol. 2008;9:1055–1064. - PMC - PubMed

Publication types

MeSH terms