. 2015 Aug;11(8):994-1004.
doi: 10.1016/j.jalz.2015.01.006. Epub 2015 Apr 4.

Florbetapir PET, FDG PET, and MRI in Down syndrome individuals with and without Alzheimer's dementia

Affiliations

Florbetapir PET, FDG PET, and MRI in Down syndrome individuals with and without Alzheimer's dementia

Marwan N Sabbagh et al. Alzheimers Dement. 2015 Aug.

Abstract

Introduction: Down syndrome (DS) is associated with amyloid b (Ab) deposition.

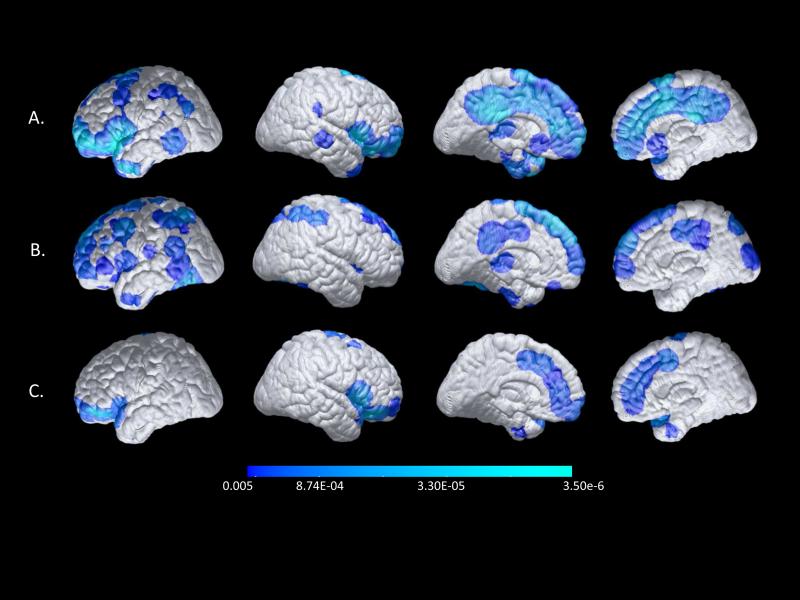
Methods: We characterized imaging measurements of regional fibrillar Ab burden, cerebral metabolic rate for glucose (rCMRgl), gray matter volumes (rGMVs), and age associations in 5 DS with dementia (DS/AD1), 12 DS without dementia (DS/AD2), and 9 normal controls (NCs).

Results: There were significant group differences in mean standard uptake value ratios (SUVRs) for florbetapir with DS/AD1 having the highest, followed by DS/AD2, followed by NC. For [18F]-fluorodeoxyglucose positron emission tomography, posterior cingulate rCMRgl in DS/AD1 was significantly reduced compared with DS/AD2 and NC. For volumetric magnetic resonance imaging (vMRI), hippocampal volumes were significantly reduced for the DS/AD1 compared with DS/AD2 and NC. Age-related SUVR increases and rCMRgl reductions were greater in DS participants than in NCs.

Discussion: DS is associated with fibrillar Ab, rCMRgl, and rGMV alterations in the dementia stage and before the presence of clinical decline. This study provides a foundation for the studies needed to inform treatment and prevention in DS.

Keywords: Alzheimer's disease; Dementia; Down syndrome; FDG-PET; Florbetapir; Imaging; PET.


Figures

Figure 1
Figure 1
a) Mean Cortical Florbetapir SUVRs, PC CMRgl, and hippocampal GMV in the DS/AD+, DS/AD-, and NC groups (top row). b) Associations between each of these measures and age in the overall DS and NC groups (bottom row). Mean cortical florbetapir SUVR, posterior cingulate CMRgl, and hippocampal gray matter volumes.A) Greater florbetapir mean cortical-to-pons SUVr values for amyloid deposition (left); lower posterior cingulate CMRgl values (middle); and hippocampus gray matter volume (right) in DS/AD+, DS/AD- and in NC. B) Florbetapir mean cortical-to-pons SUVr values (left) and posterior cingulate CMRgl (middle), but not the hippocampus volume (right), had significantly greater association with age in DS participants (DS and DS/AD combined) than in NC.
Figure 2
Figure 2
Statistical brain maps showing significantly greater cerebral-to-pontine florbetapir SUVRs in a) the DS/AD+ versus NC group, b) the DS/AD+ versus DS/AD- group, and c) the DS/AD- verus NC group. Significant CMRgl reductions (P ≤ 0.001, uncorrected for multiple comparisons) are projected onto the lateral and medial surfaces of the brain.
Figure 2
Figure 2
Statistical brain maps showing significantly greater cerebral-to-pontine florbetapir SUVRs in a) the DS/AD+ versus NC group, b) the DS/AD+ versus DS/AD- group, and c) the DS/AD- verus NC group. Significant CMRgl reductions (P ≤ 0.001, uncorrected for multiple comparisons) are projected onto the lateral and medial surfaces of the brain.
Figure 3
Figure 3
Statistical brain maps showing significantly lower CMRgl in a) the DS/AD+ versus NC group, b) the DS/AD+ versus DS/AD- group, and c) the DS/AD- verus NC group. Significant SUVR increases (P ≤ 0.001, uncorrected for multiple comparisons) are projected onto the lateral and medial surfaces of the brain.
Figure 3
Figure 3
Statistical brain maps showing significantly lower CMRgl in a) the DS/AD+ versus NC group, b) the DS/AD+ versus DS/AD- group, and c) the DS/AD- verus NC group. Significant SUVR increases (P ≤ 0.001, uncorrected for multiple comparisons) are projected onto the lateral and medial surfaces of the brain.
Figure 4
Figure 4
Statistical brain maps showing significantly lower GMV in a) the DS/AD+ versus NC group, b) the DS/AD+ versus DS/AD- group, and c) the DS/AD- verus NC group. Significant GMV reductions (P ≤ 0.001, uncorrected for multiple comparisons) are projected onto the lateral and medial surfaces of the brain.
Figure 4
Figure 4
Statistical brain maps showing significantly lower GMV in a) the DS/AD+ versus NC group, b) the DS/AD+ versus DS/AD- group, and c) the DS/AD- verus NC group. Significant GMV reductions (P ≤ 0.001, uncorrected for multiple comparisons) are projected onto the lateral and medial surfaces of the brain.

References

    1. Davidson MA. Primary care for children and adolescents with down syndrome. Pediatr Clin North Am. 2008;55:1099–1111. - PubMed
    1. Mann DM, Esiri MM. The pattern of acquisition of plaques and tangles in the brains of participants under 50 years of age with down's syndrome. J Neurol Sci. 1989;89:169–179. - PubMed
    1. Wisniewski KE, Dalton AJ, McLachlan C, Wen GY, Wisniewski HM. Alzheimer's disease in down's syndrome: Clinicopathologic studies. Neurology. 1985;35:957–61. - PubMed
    1. Zigman WB, Lott IT. Alzheimer's disease in Down syndrome: neurobiology and risk. Ment Retard Dev Disabil Res Rev. 2007;13(3):237–46. - PubMed
    1. Bittles AH, Bower C, Hussain R, Glasson EJ. The four ages of Down syndrome. Eur J Public Health. 2007 Apr;17(2):221–5. - PubMed

Publication types