. 2015 Apr 7;10(4):e0119454.
doi: 10.1371/journal.pone.0119454. eCollection 2015.

Genetic mapping of QTLs controlling fatty acids provided insights into the genetic control of fatty acid synthesis pathway in peanut (Arachis hypogaea L.)

Affiliations

Genetic mapping of QTLs controlling fatty acids provided insights into the genetic control of fatty acid synthesis pathway in peanut (Arachis hypogaea L.)

Ming Li Wang et al. PLoS One. .

Abstract

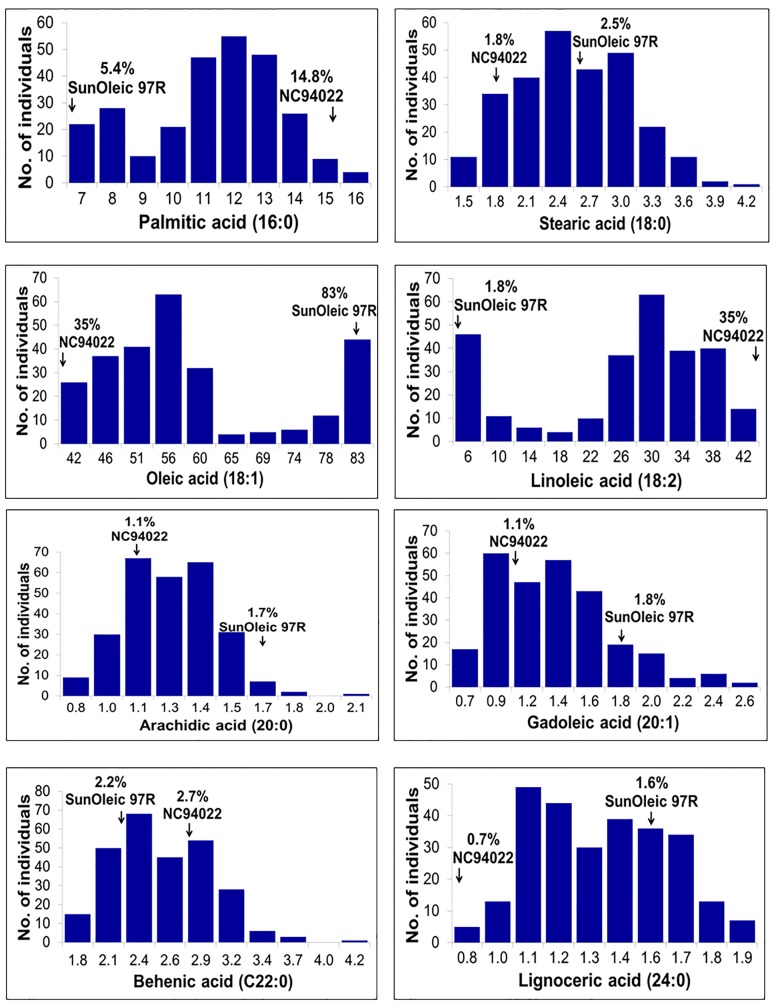
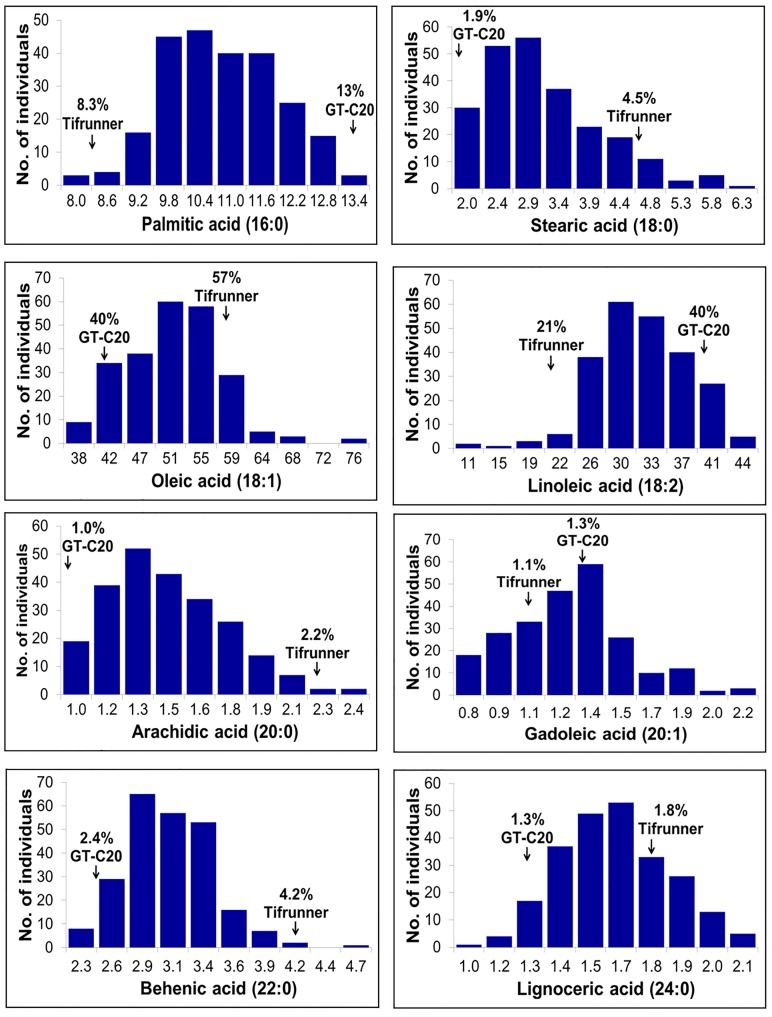
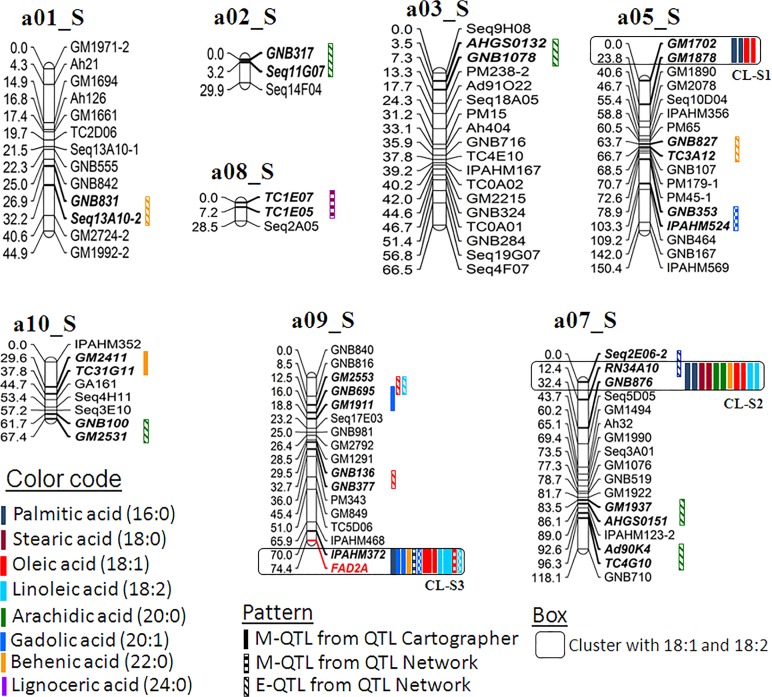
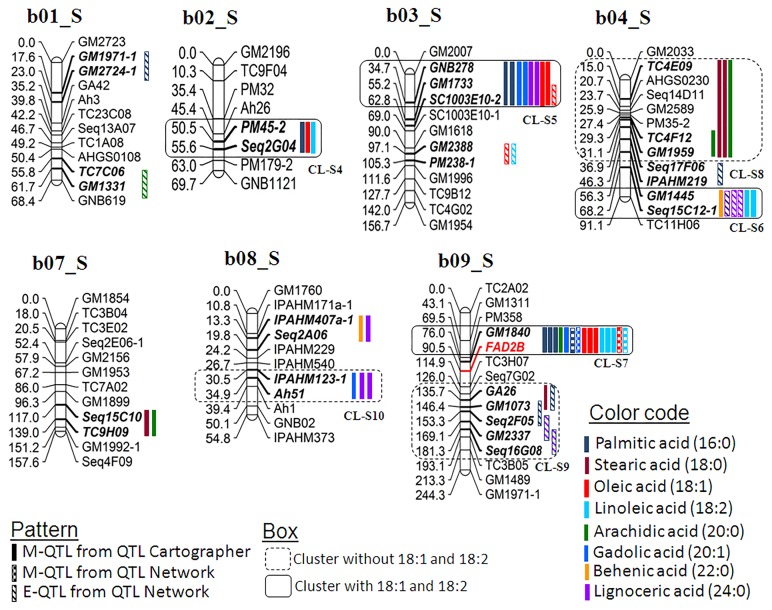
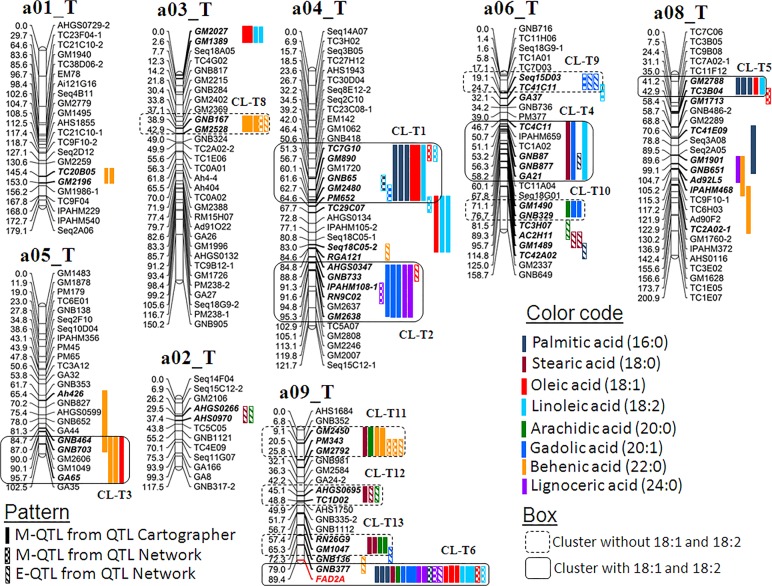
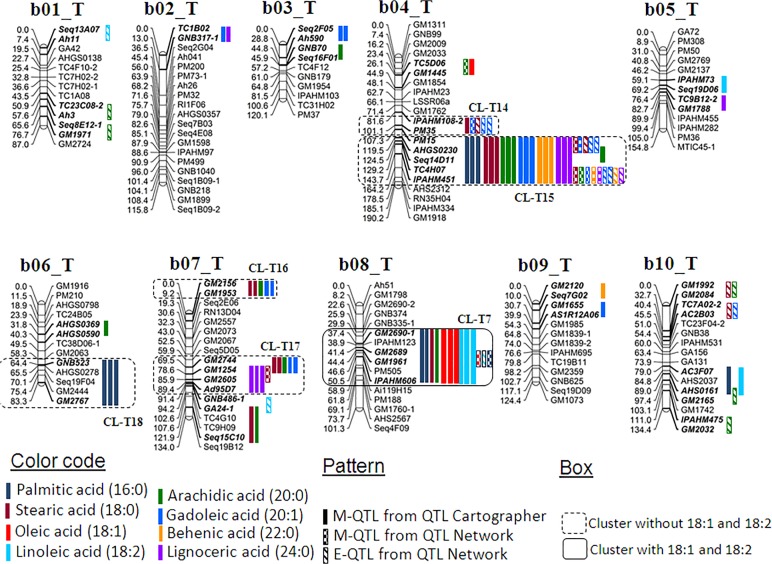
Peanut, a high-oil crop with about 50% oil content, is either crushed for oil or used as edible products. Fatty acid composition determines the oil quality which has high relevance to consumer health, flavor, and shelf life of commercial products. In addition to the major fatty acids, oleic acid (C18:1) and linoleic acid (C18:2) accounting for about 80% of peanut oil, the six other fatty acids namely palmitic acid (C16:0), stearic acid (C18:0), arachidic acid (C20:0), gadoleic acid (C20:1), behenic acid (C22:0), and lignoceric acid (C24:0) are accounted for the rest 20%. To determine the genetic basis and to improve further understanding on effect of FAD2 genes on these fatty acids, two recombinant inbred line (RIL) populations namely S-population (high oleic line 'SunOleic 97R' × low oleic line 'NC94022') and T-population (normal oleic line 'Tifrunner' × low oleic line 'GT-C20') were developed. Genetic maps with 206 and 378 marker loci for the S- and the T-population, respectively were used for quantitative trait locus (QTL) analysis. As a result, a total of 164 main-effect (M-QTLs) and 27 epistatic (E-QTLs) QTLs associated with the minor fatty acids were identified with 0.16% to 40.56% phenotypic variation explained (PVE). Thirty four major QTLs (>10% of PVE) mapped on five linkage groups and 28 clusters containing more than three QTLs were also identified. These results suggest that the major QTLs with large additive effects would play an important role in controlling composition of these minor fatty acids in addition to the oleic and linoleic acids in peanut oil. The interrelationship among these fatty acids should be considered while breeding for improved peanut genotypes with good oil quality and desired fatty acid composition.


Conflict of interest statement

Competing Interests: Georgia Agricultural Commodity Commission for Peanuts, Peanut Foundation and National Peanut Board provided funding towards this study. There are no patents, products in development or marketed products to declare. This does not alter the authors' adherence to all the PLOS ONE policies on sharing data and materials.

Figures

Fig 1
Fig 1. Phenotypic distribution of eight fatty acids in the S- population.
The x-axis shows the range of percentage of average of two years (2010–2011) of fatty acids and the y-axis represents the number of individuals in the RIL population.
Fig 2
Fig 2. Phenotypic distribution of eight fatty acids in the T- population.
The x-axis shows the range of percentage of average of two years (2010–2011) of fatty acids and the y-axis represents the number of individuals in the RIL population.
Fig 3
Fig 3. Genetic map of the A-genome of the S-population showing main-effect (M-QTLs) and epistatic (E-QTLs) QTLs for different fatty acids.
This figure shows positions of M-QTLs detected by QTLCartographer and QTLNetwork while E-QTLs detected by QTLNetwork on the peanut A-genome for six fatty acids namely palmitic acid (C16:0), stearic acid (C18:0), arachidic acid (C20:0), gadoleic acid (C20:1), behenic acid (C22:0), and lignoceric acid (C24:0). Also M-QTLs and E-QTLs identified for oleic acid (C18:1) and linoleic acid (C18:2) from a previous study [24] were also plotted to draw comparison with the present study.
Fig 4
Fig 4. Genetic map of the B-genome of the S-population showing main-effect (M-QTLs) and epistatic (E-QTLs) QTLs for different fatty acids.
This figure shows positions of M-QTLs detected by QTLCartographer and QTLNetwork while E-QTLs detected by QTLNetwork on the peanut B-genome for six fatty acids namely palmitic acid (C16:0), stearic acid (C18:0), arachidic acid (C20:0), gadoleic acid (C20:1), behenic acid (C22:0), and lignoceric acid (C24:0). Also M-QTLs and E-QTLs identified for oleic acid (C18:1) and linoleic acid (C18:2) identified from a previous study [24] were also plotted to draw comparison with the present study.
Fig 5
Fig 5. Genetic map of the A-genome of the T-population showing main-effect (M-QTLs) and epistatic (E-QTLs) QTLs for different fatty acids.
This figure shows positions of M-QTLs detected by QTLCartographer and QTLNetwork while E-QTLs detected by QTLNetwork on peanut A-genome for six fatty acids, palmitic acid (C16:0), stearic acid (C18:0), arachidic acid (C20:0), gadoleic acid (C20:1), behenic acid (C22:0), and lignoceric acid (C24:0). Also M-QTLs and E-QTLs identified for oleic (C18:1) and linoleic acid (C18:2) identified from a previous study [24] were also plotted to draw comparison with the present study.
Fig 6
Fig 6. Genetic map of the B-genome of the T-population showing main-effect (M-QTLs) and epistatic (E-QTLs) QTLs for different fatty acids.
This figure shows positions of M-QTLs detected by QTLCartographer and QTLNetwork while E-QTLs detected by QTLNetwork on peanut B-genome for six fatty acids namely palmitic acid (C16:0), stearic acid (C18:0), arachidic acid (C20:0), gadoleic acid (C20:1), behenic acid (C22:0), and lignoceric acid (C24:0). Also M-QTLs and E-QTLs identified for oleic (C18:1) and linoleic (C18:2) acid identified from a previous study [24] were also plotted to draw comparison with the present study.
Fig 7
Fig 7. Simplified schematic part of the fatty acid pathway known in plants.
Blue shaded boxes indicate probable negatively correlated pathway while yellow boxes indicate positively correlated pathway due to presence of mutant FAD2 genes. Action of mutant FAD2A and FAD2B in the S-population while FAD2A QTL in the T-population stops desaturation of oleic acid (C18:1) to linoleic acid (C18:2). The capital letters in parenthesis (A-D) indicate the pathway through which fatty acids are produced by acyl carrier protein (ACP) synthesis within the plastid. ACCase, Acetyl-CoA carboxylase; FAS, fatty acid synthase; KAS, ketoacyl ACP synthetase; Δ9DES, Δ9 desaturase; ACS, acyl-CoA synthetase; FAT B, palmitoyl-ACP thioesterase; FATA, stearoyl-ACP thioesterase; FAE, fatty acid elongase, FAD2, fatty acid desaturase.

Similar articles

Cited by

References

    1. Dean LL, Hendrix KW, Holbrook CC, Sanders TH. Content of some nutrient in the core of the core of peanut germplasm collection. Peanut Sci. 2009;36: 104–120.
    1. Wang ML, Chen CY, Tonnis B, Barkley NA, Pinnow DL, Pittman RN, et al. Oil, fatty acid, flavonoid, and resveratrol content variability and FAD2A functional SNP genotypes in the U.S. peanut mini-core collection. J Agr Food Chem. 2013;61: 2875–2882. 10.1021/jf305208e - DOI - PubMed
    1. Rizzo WB, Watkins PA, Phillips MW, Cranin D, Campbell B, Avigan J. Adrenoleukodystrophy: Oleic acid lowers fibroblast saturated C22-26 fatty acids. Neurology 1986;36: 357–61. - PubMed
    1. Vassiliou EK, Gonzalez A, Garcia C, Tadros JH, Chakraborty G, Toney JH. Oleic acid and peanut oil high in oleic acid reverse the inhibitory effect of insulin production of the inflammatory cytokine TNF-a both in vitro and in vivo system. Lipids Health Dis. 2009;8: 25 10.1186/1476-511X-8-25 - DOI - PMC - PubMed
    1. Wang ML, Chen CY, Davis J, Guo B, Stalker HT, Pittman RN. Assessment of oil content and fatty acid composition variability in different peanut subspecies and botanical varieties. Plant Genet Resour C. 2009;8: 71–73.

Publication types