. 2015 Apr 7;10(4):e0121710.
doi: 10.1371/journal.pone.0121710. eCollection 2015.

Cellular size as a means of tracking mTOR activity and cell fate of CD4+ T cells upon antigen recognition

Affiliations

Cellular size as a means of tracking mTOR activity and cell fate of CD4+ T cells upon antigen recognition

Kristen N Pollizzi et al. PLoS One. .

Abstract

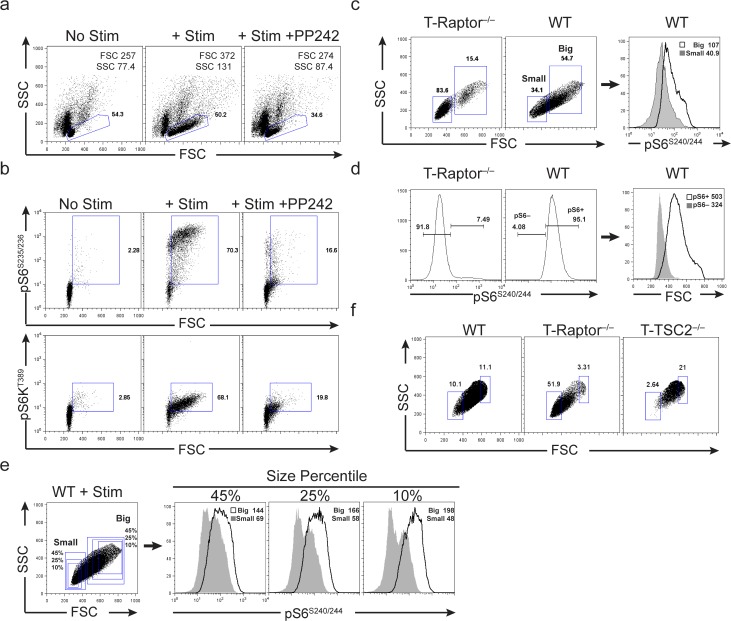
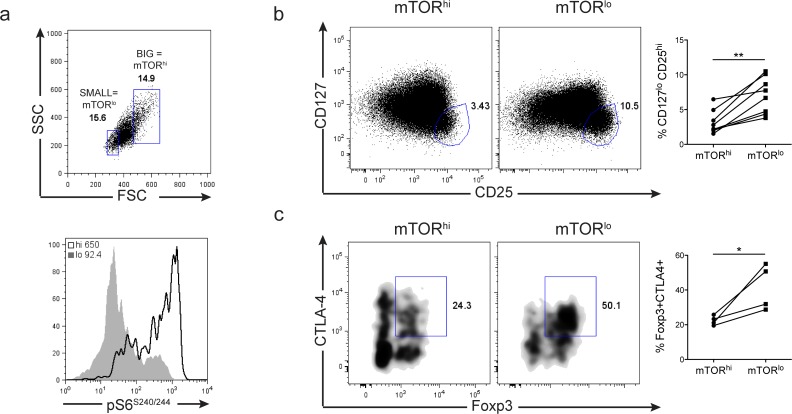
mTOR is a central integrator of metabolic and immunological stimuli, dictating immune cell activation, proliferation and differentiation. In this study, we demonstrate that within a clonal population of activated T cells, there exist both mTORhi and mTORlo cells exhibiting highly divergent metabolic and immunologic functions. By taking advantage of the role of mTOR activation in controlling cellular size, we demonstrate that upon antigen recognition, mTORhi CD4+ T cells are destined to become highly glycolytic effector cells. Conversely, mTORlo T cells preferentially develop into long-lived cells that express high levels of Bcl-2, CD25, and CD62L. Furthermore, mTORlo T cells have a greater propensity to differentiate into suppressive Foxp3+ T regulatory cells, and this paradigm was also observed in human CD4+ T cells. Overall, these studies provide the opportunity to track the development of effector and memory T cells from naïve precursors, as well as facilitate the interrogation of immunologic and metabolic programs that inform these fates.


Conflict of interest statement

Competing Interests: The authors have declared that no competing interests exist.

Figures

Fig 1
Fig 1. CD4+ T cells coordinately increase in size and mTORC1 activity following TCR stimulation.
a-b) 5c.c7 Rag–/—CD4+ T cells were cultured for 24hrs in media, or media + Pigeon Cytochrome C (PCC) peptide +/- 500nM PP242, a mTOR kinase inhibitor. a) Peptide stimulated cells exhibit a significant increase in cell size relative to unstimulated controls. Stimulation-induced cell growth can be inhibited by treatment with PP242. Forward (FSC) and Side scatter (SSC) MFI are shown in top right corner of each panel. b) Peptide stimulated CD4+ T cells upregulate mTORC1 activity following TCR stimulation, as indicated by phosphorylation of downstream targets S6 and S6K. This increase in mTOR activity is diminished upon PP242 addition. c-d) WT and T-Raptor–/—OT-II+ splenocytes were stimulated with OVA323–339 for 24hrs. c) Gates were set on stimulated CD4+ T cells based upon predominant size of stimulated T-Raptor–/—cells and mTORC1 activity was measured from the smallest (Small) and largest (Big) populations of WT stimulated cells. pS6 MFI shown in upper right corner of histogram FACs plot. d) Gates were set based upon phosphorylated S6 (pS6) expression detected in T-Raptor–/—cells and size (FSC) was assessed based from pS6—and pS6+ populations of WT stimulated cells. FSC MFI shown in upper right corner of histogram FACs plot. e) 5c.c7 Rag–/—CD4+ T cells were stimulated with PCC for 24hrs and mTORC1 activity (as indicated by pS6 expression) was measured from the 45%, 20%, and 10% smallest (Small) and largest (Big) populations of cells. f) WT, T-Raptor–/—and T-TSC2–/—OT-II+ splenocytes were stimulated with OVA323–339 for 24hrs. Plots show percentage of smallest and largest cells in each genotype based on the 10% gate generated from WT stimulated cells. The data are representative of at least 3 independent experiments.
Fig 2
Fig 2. mTORC1 activity is not required for antigenic recognition.
a-b) WT, T-Raptor–/—and T-TSC2–/—OT-II+ splenocytes were stimulated with OVA323–339 for 24hrs. a) mTORC1 activity, as assessed by pS6S240/244 expression was measured from the CD4+ population of each genotype. The bar graph below displays the MFI ± standard deviation (S.D.) of pS6 per genotype represented in above histogram plot. b) Expression of activation marker CD69, and homing marker, CD62L, are shown from the CD4+ population of each genotype. Below bar graphs indicate MFI of each molecule of interest from 3 independent experiments. c) 5c.c7 Rag–/—CD4+ T cells were stimulated with PCC for 24hrs and expression of CD69 and CD62L was assessed from the 10% smallest and largest populations of activated CD4+ cells. Expression was compared against non-activated 5c.c7 Rag–/—CD4+ T cells (CD4+ CD69–). Bar graphs below represent MFI ± S.D. of each molecule of interest from 3 independent experiments. The data are representative of (a,c) and/or are a composite of 3 independent experiments (b,c).
Fig 3
Fig 3. Cell size can be used to isolate recently stimulated CD4+ T cells populations with distinct proliferative, metabolic and survival profiles.
a) Splenocytes from 5c.c7 Rag–/—mice were stimulated with 0.5ug/ml PCC peptide for 24hrs then sorted into CD4+CD69+ populations with FSC/SSC “big” mTORhi or FSC/SSC “small” mTORlo profiles. b) mTORC1 activity was assessed from “Big” and “Small” cells immediately after sorting. pS6 MFI is shown in the upper corner of the plot. c) Sorted mTORhi cells form large homotypic aggregates when cultured in media containing IL-2 for 4hrs after sorting. d-h) Sorted cells were cultured in media containing IL-2 for 24hrs. d) mTORhi cells exhibit a higher proliferative rate—as measured by 3H-thymidine incorporation—than their mTORlo counterparts. e) Sorted mTORhi cells show robust cell cycle progression 24hrs post sorting, while sorted mTORlo cells arrest in the G0/1 stage. f) mTORhi cells display a significantly higher Extracellular Acidification Rate (ECAR) and Oxygen Consumption Rate (OCR) than their sorted mTORlo counterparts. The increased metabolic activity observed in the sorted mTORhi cells is accompanied by a higher mitochondrial load than sorted mTORlo cells as indicated by mitotracker green staining (g). Mitotracker green MFI shown in upper corner of FACs plot. h) Sorted mTORlo CD4+ T cells exhibit a significantly higher Spare Respiratory Capacity (SRC) than sorted mTORhi cells. i) Sorted mTORhi cells exhibit a higher rate of cell death when cultured for 5 days in media supplemented with IL-2 than sorted mTORlo cells. The bar graph to the right depicts % AnnexinV+7-AAD+ cells ± S.D. from 3 independent experiments. Three days after culture in media + IL-2, sorted mTORlo cells show significantly higher levels of (j) Bcl-2 mRNA and (k) protein expression than sorted mTORhi cells. mRNA transcript expression shows mean relative expression ± S.D. from 3 independent experiments, with the mTORhi values set to 1. Bcl-2 protein expression was normalized to Actin and fold difference in expression is shown above the protein band. The data are representative of at least 3 independent experiments.
Fig 4
Fig 4. Divergent fates of activated CD4+ T cells can be tracked with gradients of cellular size following activation.
a-b) Splenocytes from 5c.c7 Rag–/—mice were stimulated with 0.5ug/ml PCC peptide for 24hrs and then sorted into CD4+CD69+ populations with FSC/SSC “big” mTORhi or FSC/SSC “small” mTORlo profiles. Cells were cultured in media supplemented with IL-2 for 3 days. a) 3 days after sort, mTORlo cells express higher mRNA transcript, and b) surface protein expression of CD25 than sorted mTORhi cells. The bar graph to the right depicts the fold increase in CD25 MFI expression in mTORlo cells compared to mTORhi cells from 6 replicate experiments, with expression of mTORhi cells set to a value of 1. Error bars represent ± S.D, n = 3 (a) or n = 6 (b). c-d) 5c.c7 Rag–/—splenocytes were stimulated with PCC for 24hrs and activated (CD69+) CD4+ cells were sorted based on 4 size profiles. Cells were sorted into 10% smallest (Q1) and largest (Q4) populations in addition to the next 25% smallest (Q2) and largest (Q3) populations. c) Representation of sorting scheme utilized. d) After the sort, cells were cultured separately in IL-2 supplemented media for 3 days. On day 3, expression of CD25 and CD62L was assessed by flow cytometry. An illustration of cell size after sort is depicted above flow plots for clarification of sorted quartile populations. e) Purified CD4+ T cells from 5c.c7 Rag–/—mice were stimulated by plate bound anti-CD3 and anti-CD28 for 24hrs. Cells were sorted as indicated in c, and mRNA transcript expression of CD25 and Bcl-2 was determined from sorted populations after a 3 day culture in IL-2 supplemented media. Bar graphs show relative expression ± S.D. from 3 independent experiments. The data are representative of 3 independent experiments or show cumulative results.
Fig 5
Fig 5. Cell size can be used to isolate recently stimulated CD4+ T cell populations with distinct immunological fates.
a) Relative expression of IFN-gamma, IL-17a and IL-17f mRNA transcripts were determined from mTORhi and mTORlo populations immediately after sorting stimulated 5c.c7 Rag–/—splenocytes. Error bars show ± S.D. from 3 independent experiments, and mTORhi values were set to 1. b-d) Sorted populations of cells were cultured in media supplemented with IL-2 for 3 days prior to assessment. b) Expression of chemokine receptor, CXCR3, and LFA-1 subunit CD11a was determined by flow cytometry. MFI per population is shown at the top of each FACs plot. c) Relative expression of Foxp3 mRNA transcript ± S.D. was determined from the mTORlo population compared to the mTORhi cells. The graph was generated from 3 independent experiments, and mTORhi values were set to 1. d) Foxp3 protein expression was determined from sorted mTORlo and mTORhi populations 3 days after culture in IL-2 alone or IL-2 + TGF-ß. Bar graphs to the right depict % Foxp3+ cells ± S.D. generated in each population from 3 independent experiments. e) mTORlo Foxp3+ regulatory T cells possess the ability to suppress the proliferation of naïve CD4+ T cells. Sorted mTORhi or mTORlo populations were cultured in media supplemented with IL-2 for 3 days prior to use in the suppression assay. The percentage of non-divided responders was determined by CFSE dilution 72hrs after culture of 1:2 suppressors: responders in direct contact or in transwell suppression assays. The graphs to the right depict the percentage of non-divided responders after culture with mTORhi or mTORlo ‘suppressors’ from 3 independent experiments. Connecting lines show values from sorted populations from the same experiment. The data are representative of at least 3 independent experiments or show cumulative results.
Fig 6
Fig 6. Foxp3+ CD4+ T cells generated from mTORhi and mTORlo sorted populations have distinct phenotypes.
Splenocytes from 5c.c7 Rag–/—TCR transgenic mice were stimulated with 0.5ug/ml PCC peptide for 24hrs, and then sorted into CD4+CD69+ populations with FSC/SSC “big” mTORhi or FSC/SSC “small” mTORlo profiles. Cells were cultured in media supplemented with IL-2 for 96hrs, and analyzed by flow cytometry. a) The percentage of CD4+ Foxp3+ cells was determined from each population. b) Histograms show shifts in MFI of markers associated with a T-reg phenotype. Populations were gated from the Foxp3+ or Foxp3- cells of the mTORhi or mTORlo sorted samples. The MFI of each protein is shown in the top corner of each FACs plot. The data are representative of at least 3 independent experiments.
Fig 7
Fig 7. Foxp3+ CD4+ regulatory T cells exhibit divergent phenotypic profiles, dependent on their method of induction.
Splenocytes from 5c.c7 Rag–/—TCR transgenic mice (a) or WT C57BL/6 mice (b-e) were stimulated with 1ug/ml soluble anti-CD3 and 1ng/ml IL-2 in the presence or absence of either 10ng/ml TGF-ß or 500nM rapamycin for 24hrs. a) mTORC1 activity was measured by flow cytometric analysis of phosphorylated-S6 expression 24hrs after stimulation. Histograms were gated from activated CD4+CD69+ populations within each culture condition. b-e) After 24hrs of stimulation, cells were expanded in media supplemented with IL-2 alone, IL-2 + TGF-ß, or IL-2 + rapamycin for an additional 72hrs before phenotypic assessment. b) Cells were run on an extracellular flux analyzer and the extra cellular acidification rate, ECAR, was determined over time. c) Bcl-2 expression and d) Foxp3 expression levels were assessed from CD4+ T cells of each culture condition. e) Histograms show shifts in MFI of markers associated with a T-reg phenotype. Populations were gated from Foxp3+ CD4+ T cells. The MFI of each population is shown in the upper corners of the FACS plots depicted in a,c,and e. The data are representative of 3 independent experiments.
Fig 8
Fig 8. Cellular size (indicative of mTORC1 activity) influences the phenotype of human CD4+ T cells similar to mouse.
CD4+ T cells were purified from the PBMCs of 8 human volunteers. Cells were stimulated with human anti-CD3 and anti-CD28 activator beads overnight. a) 24hrs after stimulation, mTORC1 activity was assessed by the pS6 expression of the 15% largest and smallest activated (HLA-DR+) CD4+ T cells. Histograms in the lower FACs plot were determined from the ‘big’ and ‘small’ gates shown in the upper plot. The pS6 MFI is shown in the upper corner of the FACs plot. b-c) 24hrs after stimulation, the cells were sorted from the 15% largest and smallest activated (CD38+) CD4+ T cells. Sorted populations were cultured in media supplemented with human IL-2 for 72 hrs. After 72 hrs, the phenotype of the large ‘mTORhi’ and small ‘mTORlo’ populations was assessed by flow cytometry. b) Human T-reg populations were determined from the CD127lo CD25hi gating strategy. c) FACs plots show percentage of Foxp3+ CTLA-4+ double positive cells gated from the ‘T-reg’ gate in b. Statistics are shown to the right. The connecting lines demonstrate the changes in percentages between the mTORhi and mTORlo sorted populations from the same individual. The data are representative of 8 distinct human samples.

Similar articles

Cited by

References

    1. Brown EJ, Albers MW, Shin TB, Ichikawa K, Keith CT, Lane WS, et al. A mammalian protein targeted by G1-arresting rapamycin-receptor complex. Nature. 1994;369(6483):756–8. Epub 1994/06/30. 10.1038/369756a0 . - DOI - PubMed
    1. Laplante M, Sabatini DM. mTOR signaling at a glance. Journal of cell science. 2009;122(Pt 20):3589–94. Epub 2009/10/09. 10.1242/jcs.051011 - DOI - PMC - PubMed
    1. Laplante M, Sabatini DM. mTOR signaling in growth control and disease. Cell. 2012;149(2):274–93. Epub 2012/04/17. 10.1016/j.cell.2012.03.017 - DOI - PMC - PubMed
    1. Yamagata K, Sanders LK, Kaufmann WE, Yee W, Barnes CA, Nathans D, et al. rheb, a growth factor- and synaptic activity-regulated gene, encodes a novel Ras-related protein. The Journal of biological chemistry. 1994;269(23):16333–9. . - PubMed
    1. Zhang Y, Gao X, Saucedo LJ, Ru B, Edgar BA, Pan D. Rheb is a direct target of the tuberous sclerosis tumour suppressor proteins. Nature cell biology. 2003;5(6):578–81. Epub 2003/05/29. 10.1038/ncb999 . - DOI - PubMed

Publication types