Comparative Study
. 2015 Apr 7;10(4):e0119654.
doi: 10.1371/journal.pone.0119654. eCollection 2015.

1H NMR-based metabolomics investigation of copper-laden rat: a model of Wilson's disease

Affiliations
Comparative Study

1H NMR-based metabolomics investigation of copper-laden rat: a model of Wilson's disease

Jingjing Xu et al. PLoS One. .

Abstract

Background and purpose: Wilson's disease (WD), also known as hepatoleticular degeneration (HLD), is a rare autosomal recessive genetic disorder of copper metabolism, which causes copper to accumulate in body tissues. In this study, rats fed with copper-laden diet are used to render the clinical manifestations of WD, and their copper toxicity-induced organ lesions are studied. To investigate metabolic behaviors of 'decoppering' process, penicillamine (PA) was used for treating copper-laden rats as this chelating agent could eliminate excess copper through the urine. To date, there has been limited metabolomics study on WD, while metabolic impacts of copper accumulation and PA administration have yet to be established.

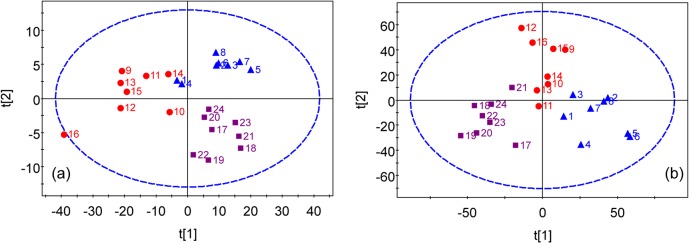
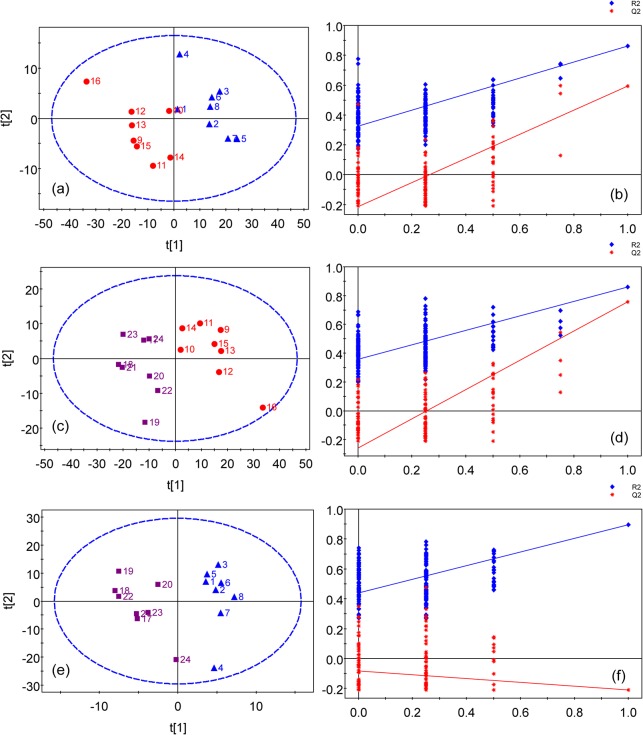
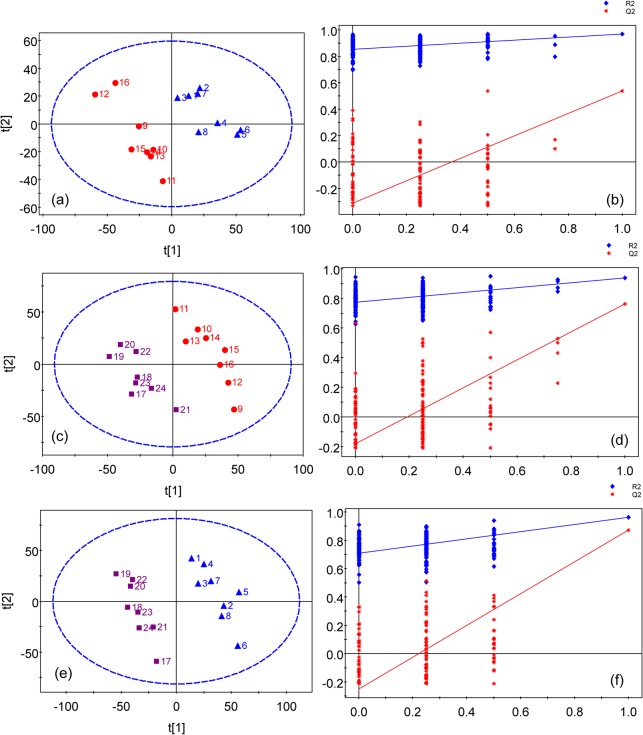
Materials and methods: A combination of 1HNMR spectroscopy and multivariate statistical analysis was applied to examine the metabolic profiles of the urine and blood serum samples collected from the copper-laden rat model of WD with PA treatment.

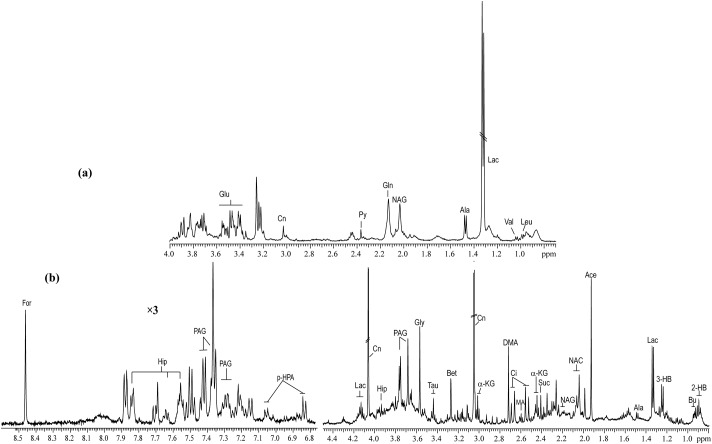
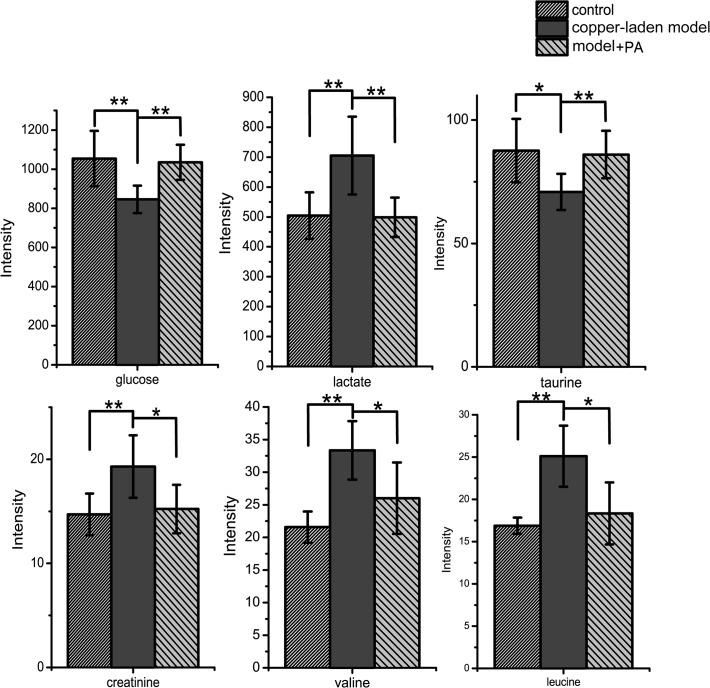
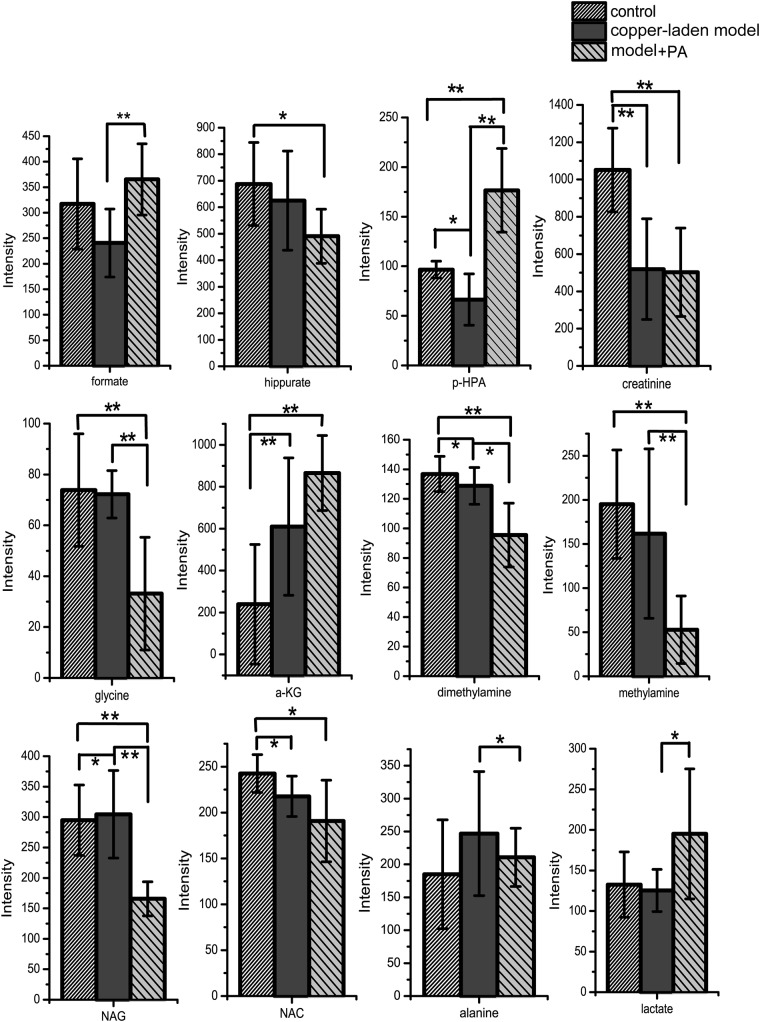
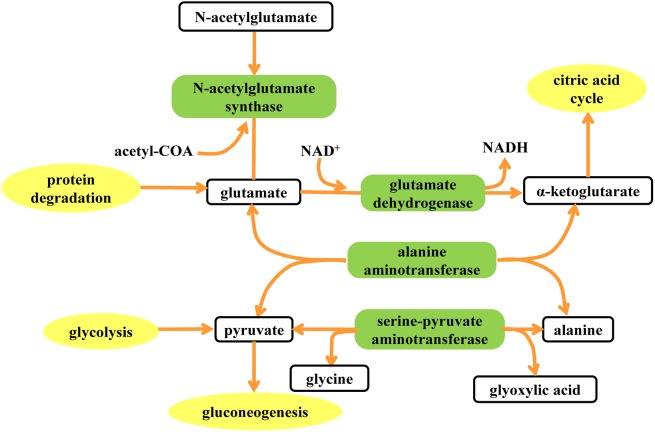
Results: Copper accumulation in the copper-laden rats is associated with increased lactate, creatinine, valine and leucine, as well as decreased levels of glucose and taurine in the blood serum. There were also significant changes in p-hydroxyphenylacetate (p-HPA), creatinine, alpha-ketoglutarate (α-KG), dimethylamine, N-acetylglutamate (NAG), N-acetylglycoprotein (NAC) in the urine of these rats. Notably, the changes in p-HPA, glucose, lactate, taurine, valine, leucine, and NAG were found reversed following PA treatment. Nevertheless, there were no changes for dimethylamine, α-KG, and NAC as a result of the treatment. Compared with the controls, the concentrations of hippurate, formate, alanine, and lactate were changed when PA was applied and this is probably due to its side effect. A tool named SMPDB (Small Molecule Pathway Database) is introduced to identify the metabolic pathway influenced by the copper-laden diet.

Conclusion: The study has shown the potential application of NMR-based metabolomic analysis in providing further insights into the molecular mechanism underlying disorder due to WD.


Conflict of interest statement

Competing Interests: The authors have declared that no competing interests exist.

Figures

Fig 1
Fig 1. Typical 1H NMR spectra of serum (a) and urine (b) samples obtained from the WD rat model.
Leu: leucine; Val: valine; Lac: lactate; Ala: alanine; NAG: N-acetylglutamate; Gln: Glutamine; Py: pyruvate; Cn: creatinine; Glu: glucose; 2-HB: 2-hydroxybutyrate; Bu: butyrate; 3-HB: 3-hydroxybutyrate; Ace: acetate; NAC: N-acetylglycoprotein; Suc: succinate; a-KG: alpha-ketoglutarate; Ci: cirtrate; MA: methylamine; DMA: dimethylamine; Bet: betaine; Tau: taurine; Gly: glycine; PAG: phenylacetylglycine; Hip: hippurate; p-HPA: para-hydroxyphenylacetate; For: formate.
Fig 2
Fig 2. PLS-DA models of 1H NMR metabolomics data for control group (Blue triangle), copper-laden model group (Red dot) and model+PA group (Purple square).
(a) scores plot of 1H-NMR data of blood serum samples. (b) scores plot of 1H-NMR data of urine samples.
Fig 3
Fig 3. PLS-DA models of 1H NMR serum spectra.
(a) scores plot of the control and model groups(R2 = 71.2%, Q2 = 62.9%) with one PLS-DA component and (b) permutation test for model in (a); (c) scores plot of the copper-laden model and model+PA groups (R2 = 85.9%, Q2 = 75.7%) with 2 components and (d) permutation test for model in (c); (e) scores plot of the control and model+PA groups (R2 = 90.4%, Q2 = 21.0%) with one component and (f) permutation test for model in (e). Colored symbols: Blue triangle for the control group; Red dot for the model group; Purple square for the model+PA group. Blue diamond is denoted as R2; Red star is denoted as Q2. The ellipse shows the Hotelling’s T2-range (at a significance level of 0.05).
Fig 4
Fig 4. Comparison of serum metabolites between control, copper-laden model and model+PA groups.
Results are presented as mean ± S.D. (n = 8). * p< 0.05; ** p<0.01.
Fig 5
Fig 5. PLS-DA scores plots of 1H NMR urine spectra.
(a) Scores plot of the control and copper-laden model groups (R2 = 92.6%, Q2 = 57.9%) with 2 components and (b) permutation test for model in (a); (c) scores plot of the copper-laden model and model+PA groups (R2 = 98.1%, Q2 = 82.6%) with 3 components and (d) permutation test for model in (c); (e) scores plot of the control and model+PA groups (R2 = 98.9%, Q2 = 87.9%) with 2 components and (f) permutation test for model in (e); Colored symbols: Blue triangle for the control group; Red dot for the model group; Purple square for the model+PA group. Blue diamond is denoted as R2; Red star is denoted as Q2. The ellipse shows the Hotelling’s T2-range (at a significance level of 0.05)
Fig 6
Fig 6. Comparison of urinary metabolites between control, copper-laden model and model+PA groups.
Results are presented as mean ± S.D. (n = 8). * p< 0.05; ** p<0.01. p-HPA: p-hydroxyphenylacetate, α-KG: alpha-ketoglutarate, NAG: N-acetylglutamate, NAC: N-acetylglycoprotein.
Fig 7
Fig 7. Metabolic pathways affected by copper accumulation.
Elements in blank box represent the metabolites influenced by copper-laden diet and PA treatment. The elements in green box represent the enzymes involved in the metabolic pathway. The elements in yellow box represent the peripheral pathways that can be associated with the characteristic metabolites.

References

    1. Wilson S (1912) Progressive lenticular degeneration. Brit Med J 2: 1645.
    1. Hursitoglu M, Cikrikcioglu MA, Danalioglu A, Tukek T (2010) Wilson's disease. Cent Eur J Med 5: 145–149.
    1. Ala A, Walker AP, Ashkan K, Dooley JS, Schilsky ML (2007) Wilson's disease. Lancet 369: 397–408. - PubMed
    1. Coffey AJ, Durkie M, Hague S, McLay K, Emmerson J, Lo C, et al. (2013) A genetic study of Wilson's disease in the United Kingdom. Brain 136: 1476–1487. 10.1093/brain/awt035 - DOI - PMC - PubMed
    1. Gow PJ, Smallwood RA, Angus PW, Smith AL, Wall AJ, Sewell RB (2000) Diagnosis of Wilson's disease: An experience over three decades. Gut 46: 415–419. - PMC - PubMed

Publication types

LinkOut - more resources