. 2015 May 6;137(17):5741-7.
doi: 10.1021/ja513117p. Epub 2015 Apr 22.

Mechanism of action studies of lomaiviticin A and the monomeric lomaiviticin aglycon. Selective and potent activity toward DNA double-strand break repair-deficient cell lines

Affiliations

Mechanism of action studies of lomaiviticin A and the monomeric lomaiviticin aglycon. Selective and potent activity toward DNA double-strand break repair-deficient cell lines

Laureen C Colis et al. J Am Chem Soc. .

Abstract

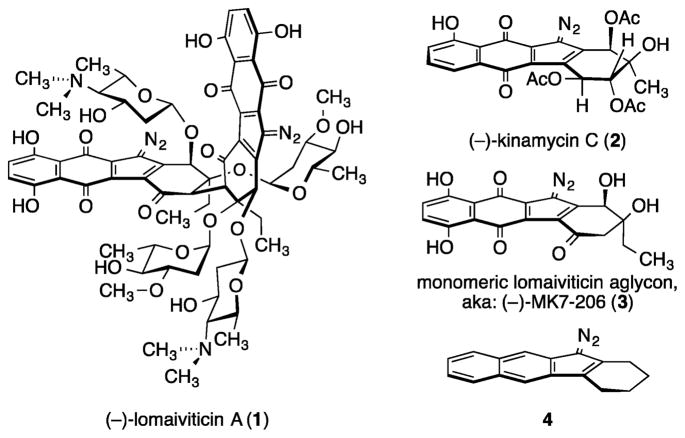
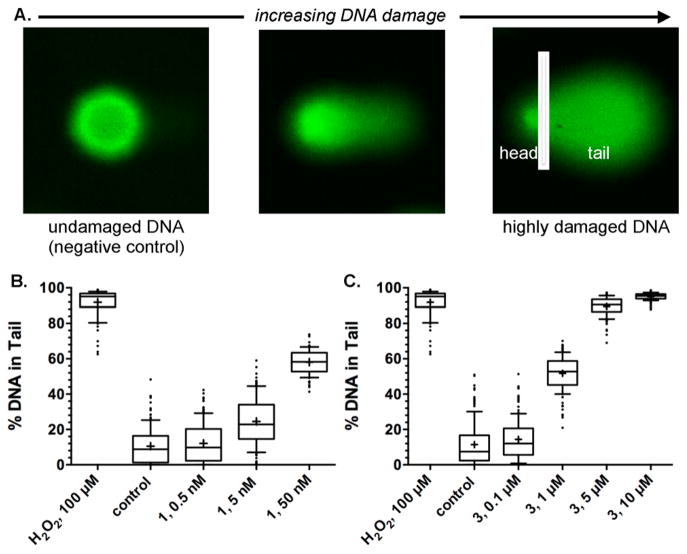
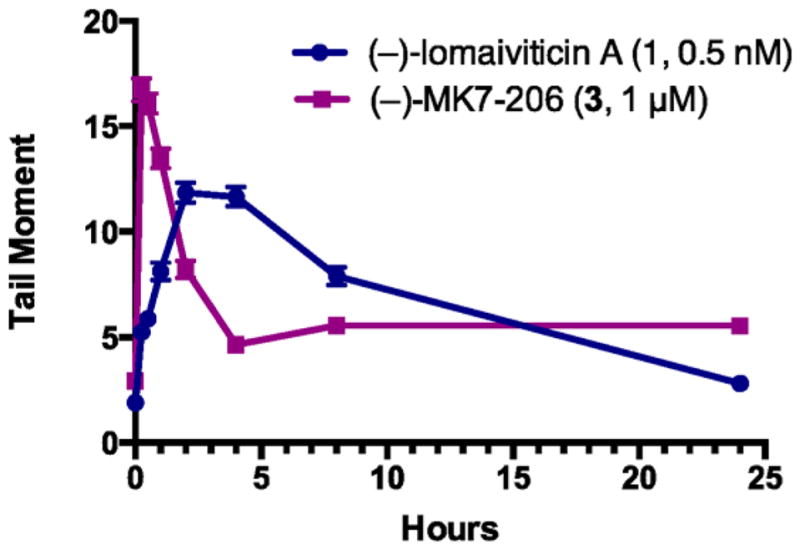
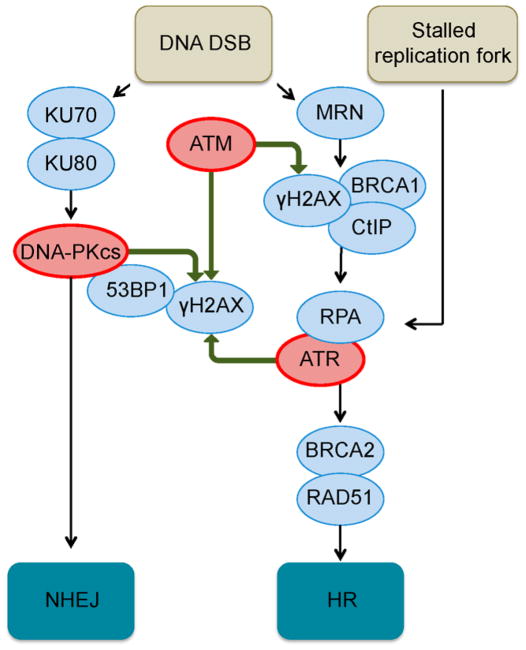
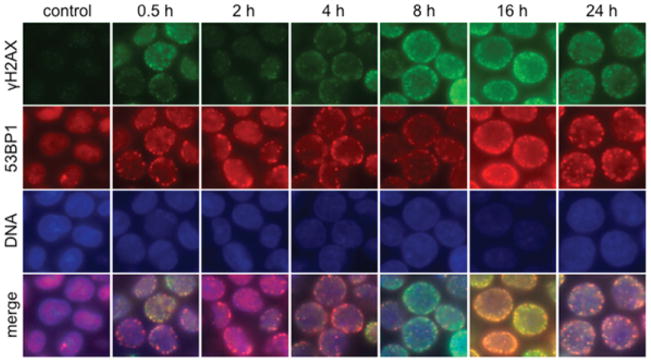
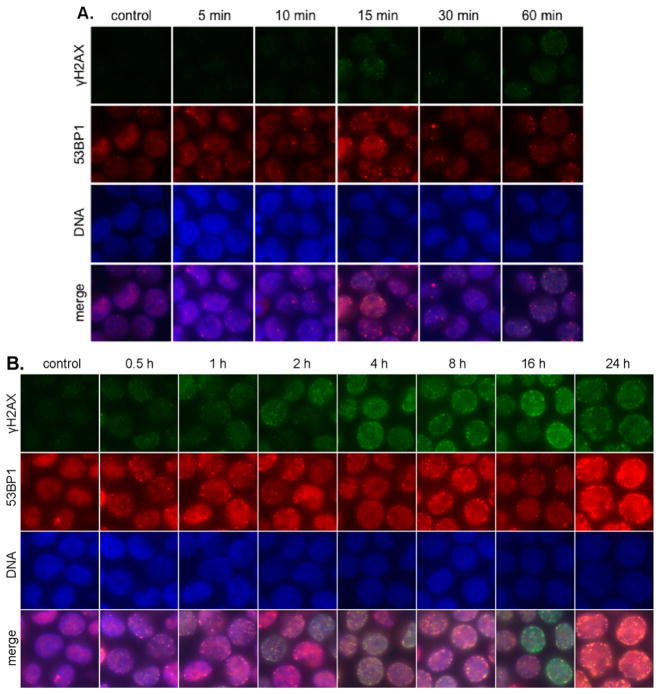
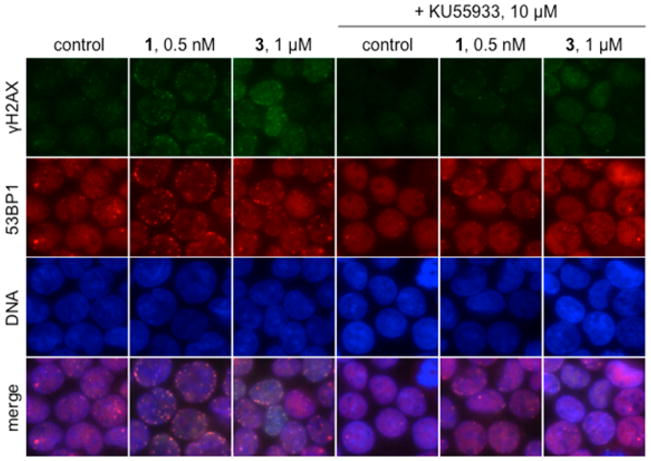
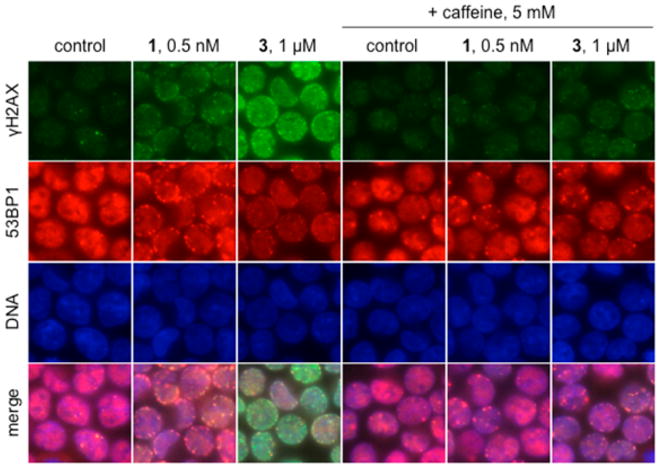
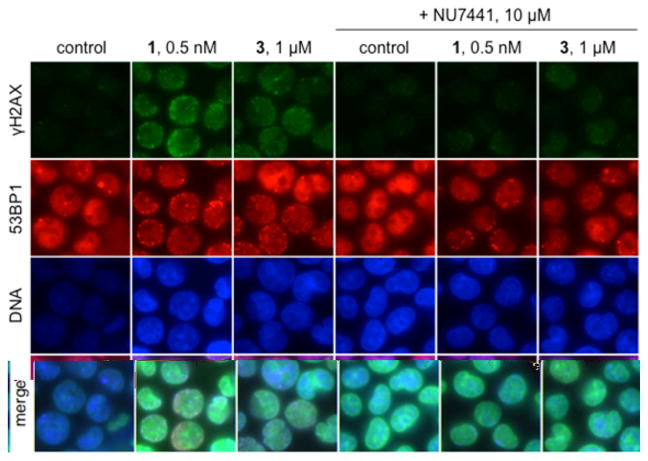
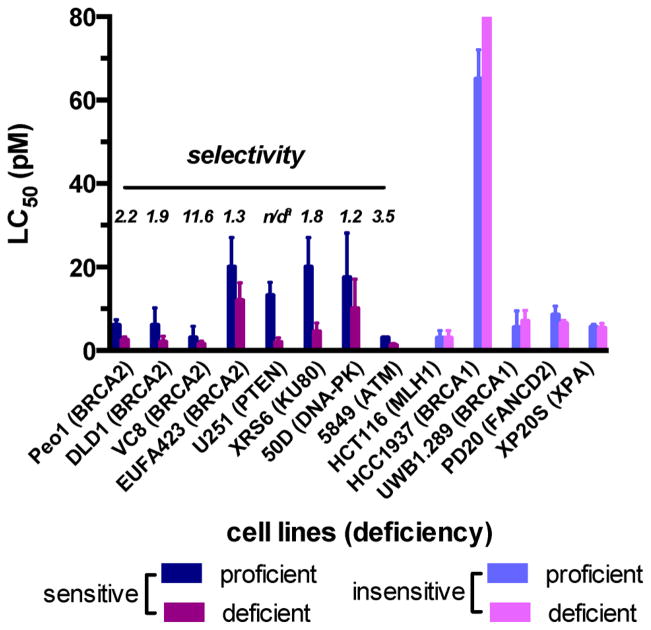
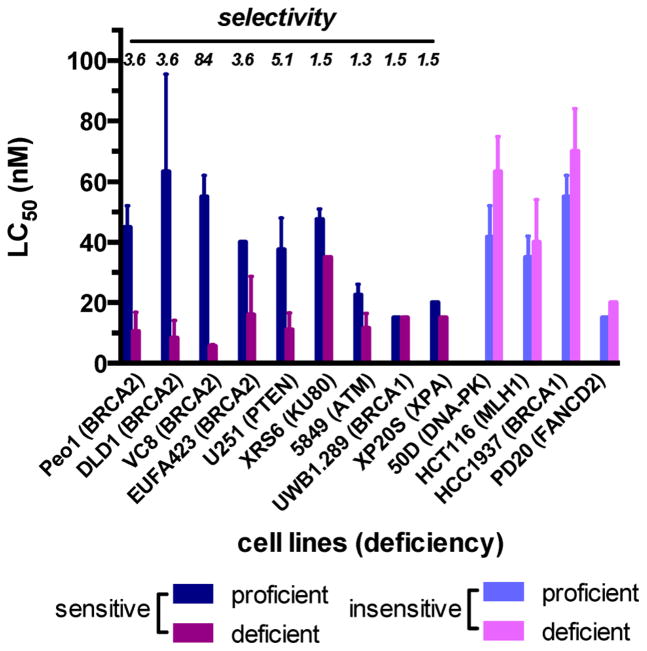
(-)-Lomaiviticin A (1) and the monomeric lomaiviticin aglycon [aka: (-)-MK7-206, (3)] are cytotoxic agents that induce double-strand breaks (DSBs) in DNA. Here we elucidate the cellular responses to these agents and identify synthetic lethal interactions with specific DNA repair factors. Toward this end, we first characterized the kinetics of DNA damage by 1 and 3 in human chronic myelogenous leukemia (K562) cells. DSBs are rapidly induced by 3, reaching a maximum at 15 min post addition and are resolved within 4 h. By comparison, DSB production by 1 requires 2-4 h to achieve maximal values and >8 h to achieve resolution. As evidenced by an alkaline comet unwinding assay, 3 induces extensive DNA damage, suggesting that the observed DSBs arise from closely spaced single-strand breaks (SSBs). Both 1 and 3 induce ataxia telangiectasia mutated- (ATM-) and DNA-dependent protein kinase- (DNA-PK-) dependent production of phospho-SER139-histone H2AX (γH2AX) and generation of p53 binding protein 1 (53BP1) foci in K562 cells within 1 h of exposure, which is indicative of activation of nonhomologous end joining (NHEJ) and homologous recombination (HR) repair. Both compounds also lead to ataxia telangiectasia and Rad3-related- (ATR-) dependent production of γH2AX at later time points (6 h post addition), which is indicative of replication stress. 3 is also shown to induce apoptosis. In accord with these data, 1 and 3 were found to be synthetic lethal with certain mutations in DNA DSB repair. 1 potently inhibits the growth of breast cancer type 2, early onset- (BRCA2-) deficient V79 Chinese hamster lung fibroblast cell line derivative (VC8), and phosphatase and tensin homologue deleted on chromosome ten- (PTEN-) deficient human glioblastoma (U251) cell lines, with LC50 values of 1.5 ± 0.5 and 2.0 ± 0.6 pM, respectively, and selectivities of >11.6 versus the isogenic cell lines transfected with and expressing functional BRCA2 and PTEN genes. 3 inhibits the growth of the same cell lines with LC50 values of 6.0 ± 0.5 and 11 ± 4 nM and selectivities of 84 and 5.1, for the BRCA2 and PTEN mutants, respectively. These data argue for the evaluation of these agents as treatments for tumors that are deficient in BRCA2 and PTEN, among other DSB repair factors.


Conflict of interest statement

Notes

The authors declare no competing financial interest.

Figures

Figure 1
Figure 1
Structures of (−)-lomaiviticin A (1), (−)-kinamycin C (2), (−)-MK7-206 (3), and the diazofluorene 4.
Figure 2
Figure 2
1 and 3 induce extensive DNA damage in K562 cells. A. Overview of the alkaline comet unwinding assay. Undamaged, supercoiled DNA does not migrate to an appreciable extent when subjected to electrophoresis (left). Nicking and cleavage of DNA results in relaxation and migration toward the anode, generating the characteristic “tail” of the comet (center and right). The level of DNA damage is presented as %DNA in the comet tail, which is equal to the total comet tail intensity divided by the total comet intensity, multiplied by 100. K562 cells were exposed to 0.5, 5, or 50 nM 1 (B) or 0.1, 1, 5, or 10 μM 3 (C). Exposure was 15 min. Cross denotes mean %DNA in tail (91–151 cells), box denotes 2nd and 3rd quartiles, and lines in the middle of the box denote the median. Error bars represent 10th and 90th percentile, and values individually plotted are outliers.
Figure 3
Figure 3
1 and 3 induce DNA DSBs in K562 cells, as determined by a neutral comet unwinding assay. This assay is similar to the alkaline comet unwinding assay (Figure 2) with the exception that unwinding and electrophoresis are conducted at near-neutral pH, allowing for the selective detection of DSBs. The amount of DNA in the tail is expressed as the tail moment, which is defined as the product of the tail length and the fraction of DNA in the tail. K562 cells were treated with 0.5 nM 1 or 1 μM 3 and incubated at 37 °C for 15 min to 24 h. Each point represents the mean tail moment (of 92–152 cells) at each time point with standard error of the mean shown.
Figure 4
Figure 4
Overview of the cellular sensing pathways leading to the activation of NHEJ and HR repair, the two canonical pathways that ameliorate DNA DSBs. Only factors relevant to the present study are shown; for detailed discussions, see ref .
Figure 5
Figure 5
Immunofluorescence imaging of γH2AX and 53BP1 foci in K562 cells treated with 0.5 nM 1. Rows (top to bottom): γH2AX (green), 53BP1 (red), DNA (blue), and merge. Columns (left to right): control, 0.5, 2, 4, 8, 16, and 24 h after addition.
Figure 6
Figure 6
Immunofluorescence imaging of γH2AX and 53BP1 foci in K562 cells treated with 1 μM 3. (A) 5–60 min post addition 3. Rows (top to bottom): γH2AX (green), 53BP1 (red), DNA (blue), and merge. Columns (left to right): control, 5, 10, 15, 30, and 60 min after addition. (B) 1–24 h post addition 3. Rows (top to bottom): γH2AX (green), 53BP1 (red), DNA (blue), and merge. Columns (left to right): control, 0.5, 1, 2, 4, 8, 16, and 24 h after addition.
Figure 7
Figure 7
Induction of γH2AX by 3 and 1 is ATM dependent. Immunofluorescence imaging of γH2AX and 53BP1 foci in K562 cells treated with 1 μM 3 or 0.5 nM 1 in the presence or absence of 10 μM KU55933. Rows (top to bottom): γH2AX (green), 53BP1 (red), DNA (blue), and merge. Columns (left to right): control, 0.5 nM 1, 1 μM 3, 10 μM KU55933, 0.5 nM 1 + 10 μM KU55933, 1 μM 3 + 10 μM KU55933. Cells were exposed to KU55933 for 1 h prior to addition of 1 or 3; exposure was 1 h.
Figure 8
Figure 8
γH2AX foci induced by 3 and 1 are ATM and ATR dependent. Immunofluorescence imaging of γH2AX and 53BP1 foci in K562 cells treated with 1 μM 3 or 0.5 nM 1 in the presence or absence of 5 mM caffeine, which inhibits ATM and ATR. Rows (top to bottom): γH2AX (green), 53BP1 (red), DNA (blue), and merge. Columns (left to right): control, 0.5 nM 1, 1 μM 3, 5 mM caffeine, 0.5 nM 1 + 5 mM caffeine, 1 μM 3 + 5 mM caffeine. Cells were exposed to caffeine for 1 h prior to addition of 1 or 3; exposure was 1 h.
Figure 9
Figure 9
γH2AX foci induced by 3 and 1 are DNA-PK dependent. Immunofluorescence imaging of γH2AX and 53BP1 foci in K562 cells treated with 1 μM 3 or 0.5 nM 1 in the presence or absence of 10 μM NU7441. Rows (top to bottom): γH2AX (green), 53BP1 (red), DNA (blue), and merge. Columns (left to right): control, 0.5 nM 1, 1 μM 3, 10 μM NU7441, 0.5 nM 1 + 10 μM NU7441, 1 μM 3 + 10 μM NU7441. Cells were exposed to NU7441 for 1 h prior to addition of 1 or 3; exposure was 1 h.
Figure 10
Figure 10
Activity of 1 against pairs of cell lines that are proficient or deficient in specific DNA DSB repair factors but are otherwise isogenic. Cell viability was determined by a clonogenic survival assay. Sensitive cell lines are defined as those in which the (% survival repair-deficient cell line) < (% survival repair-proficient cell line) at 4 pM 1. Selectivity is defined as % survival repair-proficient cell line/% survival repair-deficient cell line at 4 pM 1. Complete data are presented in Table S1. The superscript “a” indicates not defined.
Figure 11
Figure 11
Activity of 3 against pairs of cell lines that are proficient or deficient in specific DNA DSB repair factors but are otherwise isogenic. Cell viability was determined by a clonogenic survival assay. Sensitive cell lines are defined as those in which the (% survival repair-deficient cell line) < (% survival repair-proficient cell line) at 20 nM 3. Selectivity is defined as % survival repair-proficient cell line/% survival repair-deficient cell line at 20 nM 3. Complete data are presented in Table S2.

References

    1. Reed E. Clin Cancer Res. 2010;16:4511. - PubMed
    1. Curtin NJ. Nat Rev Cancer. 2012;12:801. - PubMed
    1. Hosoya N, Miyagawa K. Cancer Sci. 2014;105:370. - PMC - PubMed
    1. Kaelin WG., Jr Nat Rev Cancer. 2005;5:689. - PubMed
    1. Hartman JL, Garvik B, Hartwell L. Science. 2001;291:1001. - PubMed

Publication types