. 2015 Apr;71(Pt 4):969-85.
doi: 10.1107/S1399004715002485. Epub 2015 Mar 27.

Combination of X-ray crystallography, SAXS and DEER to obtain the structure of the FnIII-3,4 domains of integrin α6β4

Affiliations

Combination of X-ray crystallography, SAXS and DEER to obtain the structure of the FnIII-3,4 domains of integrin α6β4

Noelia Alonso-García et al. Acta Crystallogr D Biol Crystallogr. 2015 Apr.

Abstract

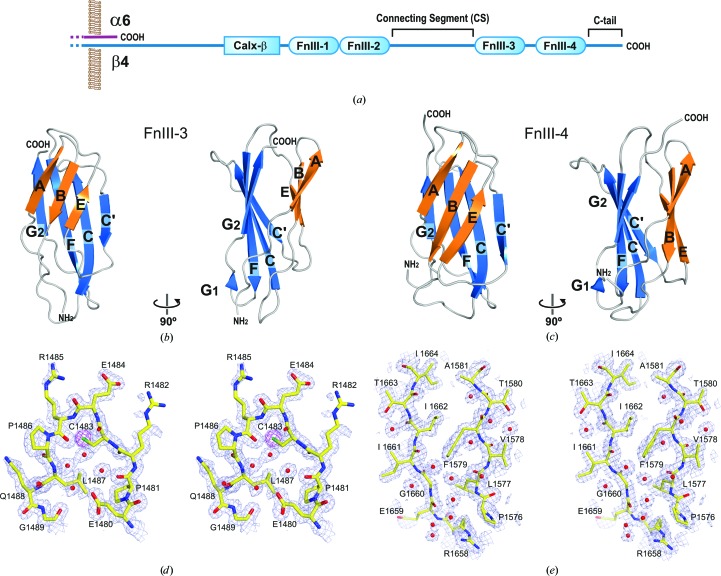
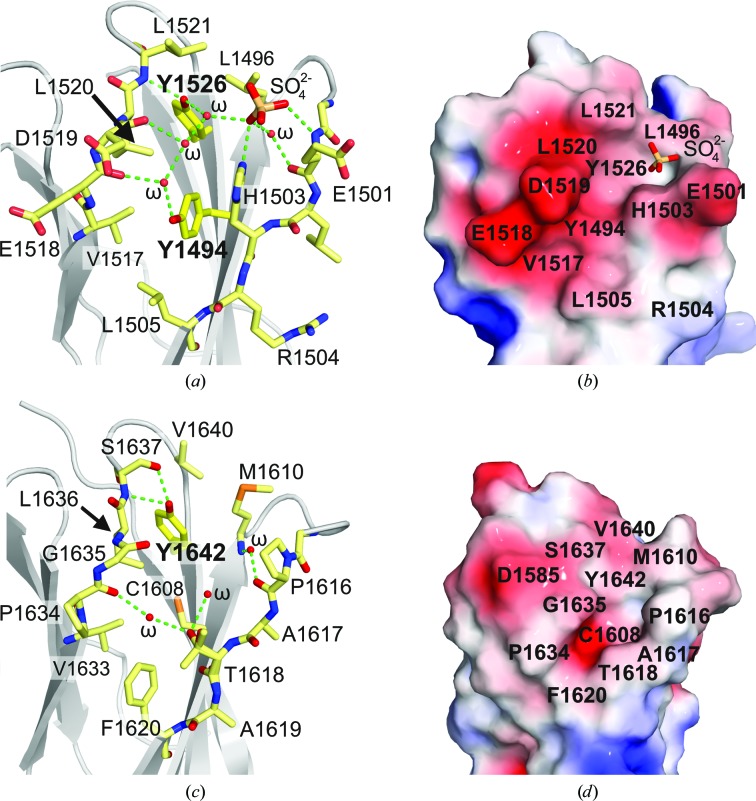
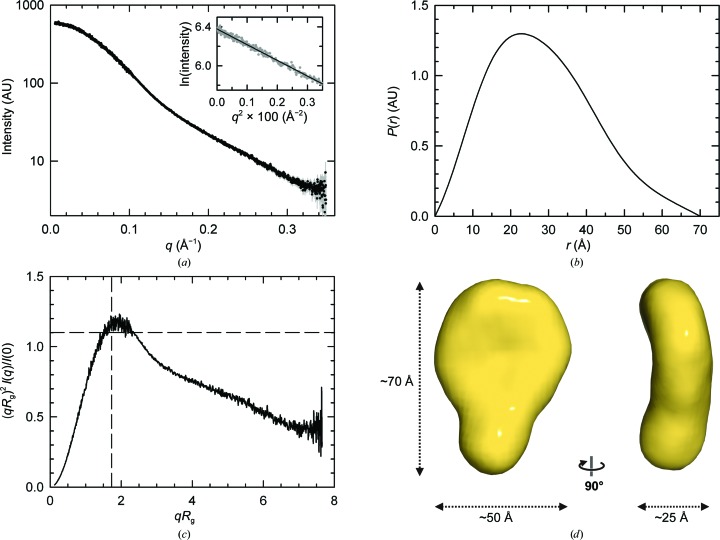
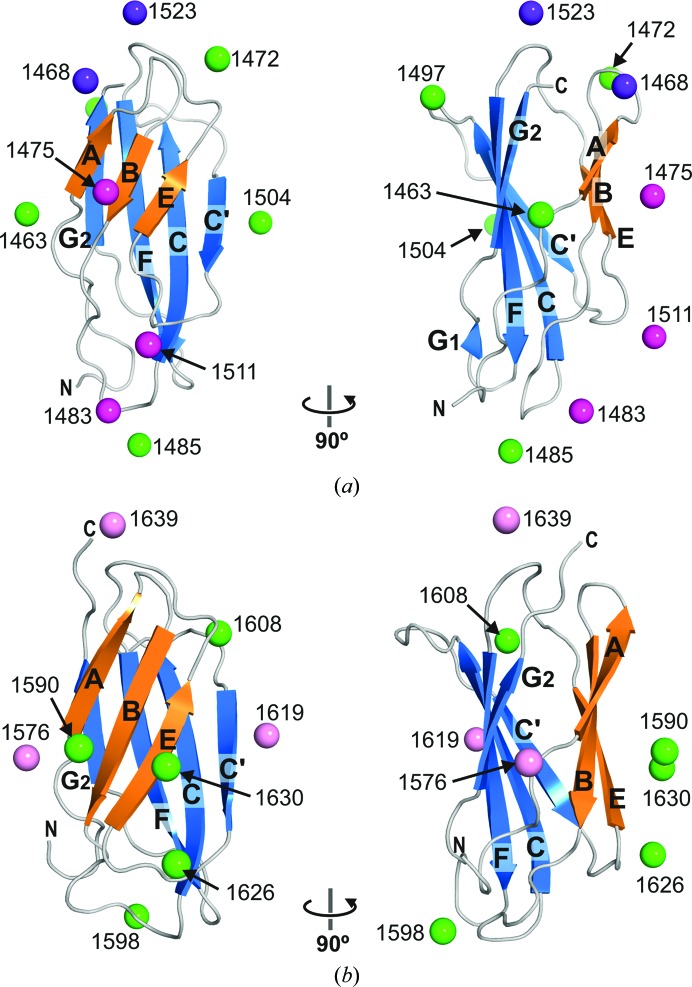
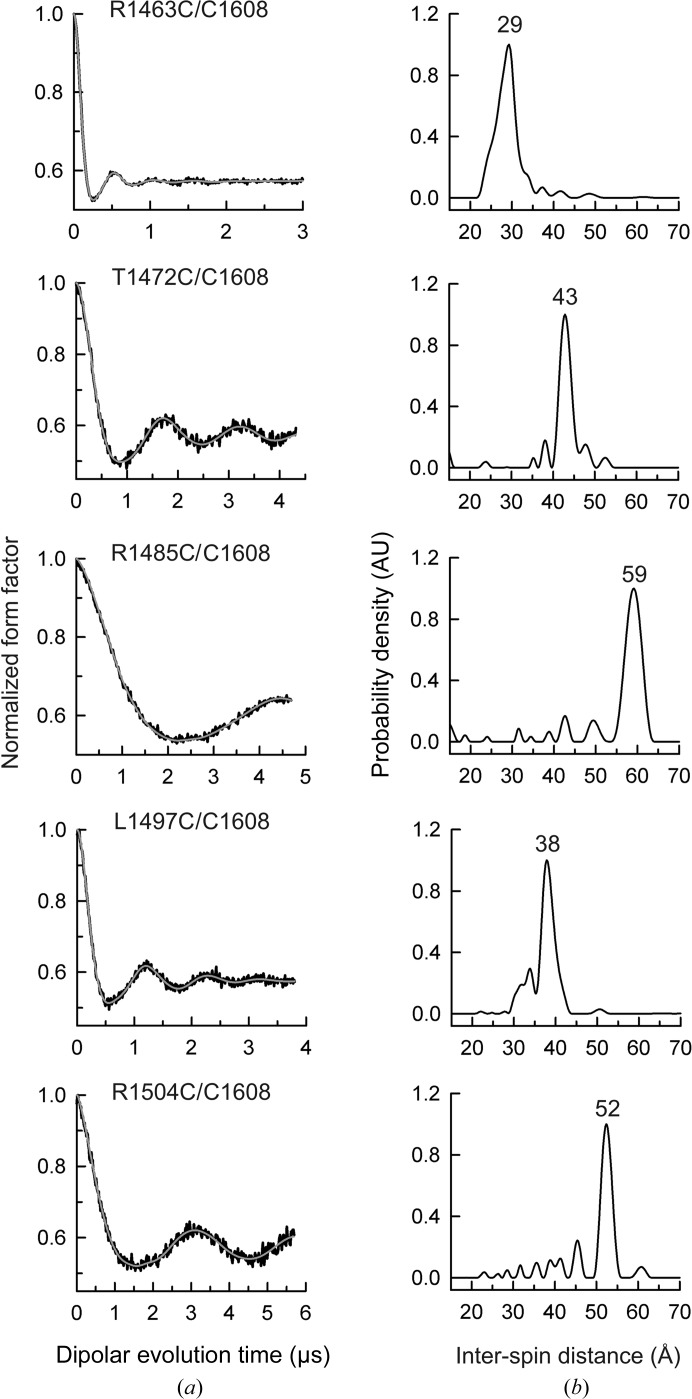
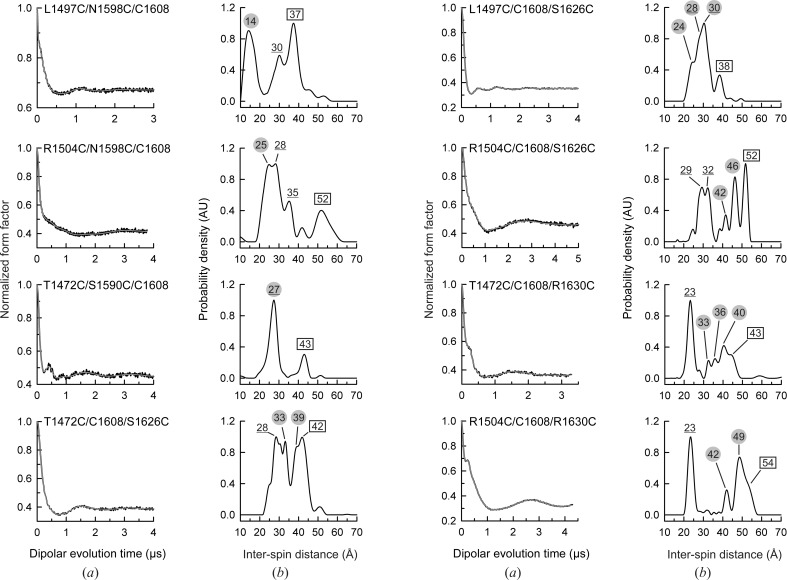
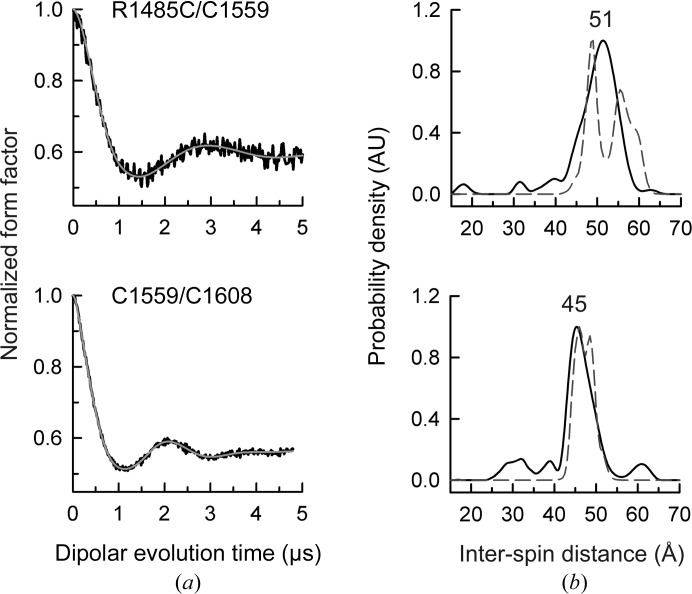
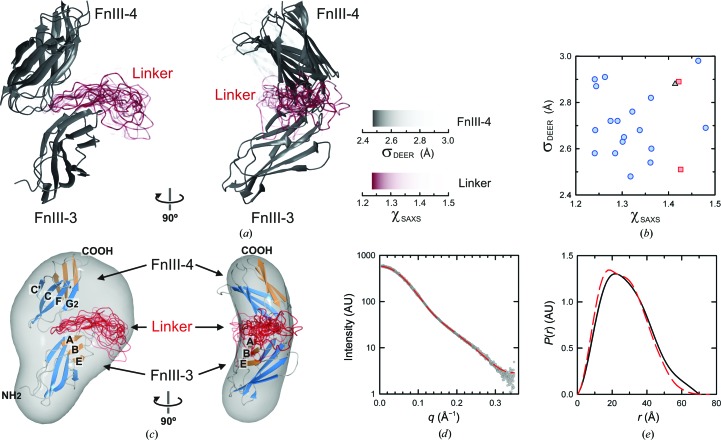
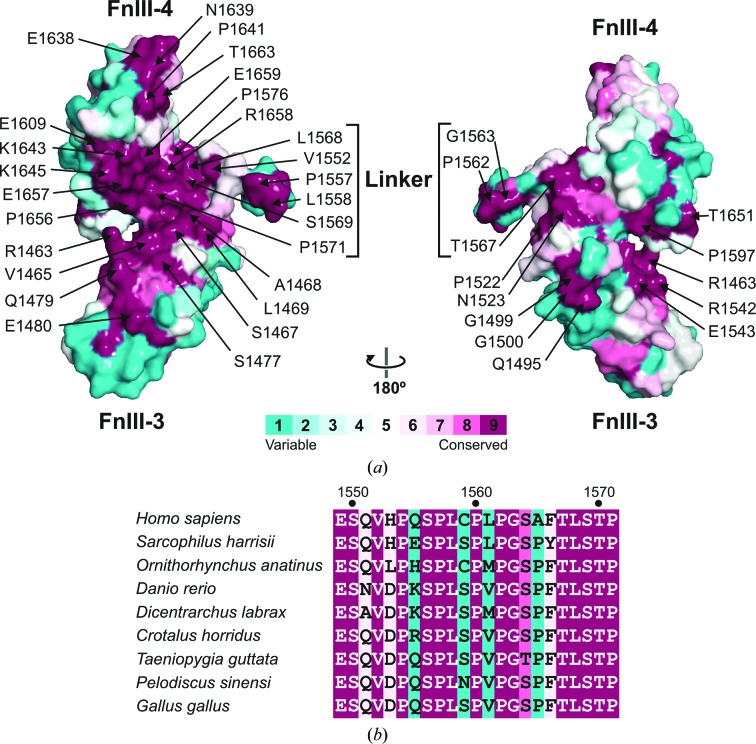
Integrin α6β4 is a major component of hemidesmosomes that mediate the stable anchorage of epithelial cells to the underlying basement membrane. Integrin α6β4 has also been implicated in cell proliferation and migration and in carcinoma progression. The third and fourth fibronectin type III domains (FnIII-3,4) of integrin β4 mediate binding to the hemidesmosomal proteins BPAG1e and BPAG2, and participate in signalling. Here, it is demonstrated that X-ray crystallography, small-angle X-ray scattering and double electron-electron resonance (DEER) complement each other to solve the structure of the FnIII-3,4 region. The crystal structures of the individual FnIII-3 and FnIII-4 domains were solved and the relative arrangement of the FnIII domains was elucidated by combining DEER with site-directed spin labelling. Multiple structures of the interdomain linker were modelled by Monte Carlo methods complying with DEER constraints, and the final structures were selected against experimental scattering data. FnIII-3,4 has a compact and cambered flat structure with an evolutionary conserved surface that is likely to correspond to a protein-interaction site. Finally, this hybrid method is of general application for the study of other macromolecules and complexes.

Keywords: FnIII-3; FnIII-4; double electron–electron resonance; integrin α6β4; small-angle X-ray scattering.


Figures

Figure 1
Figure 1
Crystal structures of the FnIII-3 and FnIII-4 domains of integrin β4. (a) Diagram of the domain structure of the α6β4 cytoplasmic region. (b, c) Orthogonal views of ribbon representations of the crystal structures of the FnIII-3 (b) and FnIII-4 (c) domains. (d, e) Stereoviews of 2mF obsDF calc simulated-annealing OMIT maps (contoured at 1σ) of representative regions of FnIII-3 (d) and FnIII-4 (e) superimposed on the refined models. For FnIII-3, an anomalous difference map (contoured at 4σ) is shown in magenta. Phases were calculated from models in which the residues and the water molecules shown were removed and the B factors were reset to the Wilson-plot value; the models were then refined by simulated annealing (start temperature 4000 K).
Figure 2
Figure 2
Structural environment of Tyr residues in FnIII-3 and FnIII-4. (a, b) Close-up of FnIII-3 around Y1494 and Y1526 in stick (a) and surface (b) representation coloured by the electrostatic potential on the surface from −3kT/e (red) to 3kT/e (blue). (c, d) Close-up of Y1642 in the FnIII-4 in stick (c) and surface (d) representation coloured by electrostatic potential as in (b).
Figure 3
Figure 3
SAXS analysis of FnIII-3,4 of β4. (a) Scattering profile of FnIII-3,4 extrapolated to infinite dilution. The Guinier plot in the range 0.13 ≤ qR g ≤ 1.30 is shown in the inset. (b) P(r) calculated from the SAXS data extending to 0.3 Å−1. (c) Dimensionless Krakty plot of the scattering data. The position of the maximum for compact globular particles is indicated by the cross-hair. (d) Orthogonal views of the ab initio molecular envelope obtained with DAMMIN; the structure is the average of 19 independent reconstructions.
Figure 4
Figure 4
Paramagnetic labels attached to the FnIII-3 and FnIII-4 domains of β4. (a) The predicted average locations of the nitroxide group of MTSL attached to Cys are shown as spheres in the crystal structure of FnIII-3. The positions that yielded well defined inter-spin distances with a second probe at C1608 are coloured green. Those that resulted in broad distance distributions but did not alter the global structure of FnIII-3,4 are coloured magenta. The positions that resulted in a distortion of the structure are coloured dark violet. (b) Crystal structure of FnIII-4 with the estimated average position of the paramagnetic groups. The positions that yielded useful distances are coloured green, while those that resulted in broad distributions are shown in pink.
Figure 5
Figure 5
DEER results for the doubly labelled FnIII-3,4 mutants used to gather distances between C1608 in FnIII-4 and five positions in FnIII-3. (a) Normalized dipolar evolution (black lines) and fits to the data (grey lines) for each double Cys mutant. (b) Inter-spin distance distribution profiles calculated from the data in (a). The distances of the major peaks are indicated at the top.
Figure 6
Figure 6
DEER results for triply labelled FnIII-3,4 mutants. (a) Normalized dipolar evolution (black lines) and fits to the data (grey lines) for each of eight triply labelled mutants. (b) Distance distribution profiles calculated from the data in (a). The positions of peaks that correspond to distances previously observed in doubly labelled mutants containing C1608 are shown in rectangles. The positions of peaks assigned to intradomain distances modelled on the FnIII-4 structure are underlined. Finally, the peaks attributed to interdomain distances that do not involve C1608 are shown in grey circles. See Supplementary Fig. S10 for analysis of these proteins by SAXS.
Figure 7
Figure 7
DEER results for mutants containing C1559 in the interdomain linker. (a) Normalized dipolar evolution (black lines) and fits to the data (grey lines) for two doubly labelled mutants that include C1559. (b) Distance distribution profiles calculated from the data in (a) (solid line) and a calculated distribution for one of the final models (dashed line). See Supplementary Fig. S10 for analysis of these proteins by SAXS.
Figure 8
Figure 8
Structure of the FnIII-3,4 region derived from a combination of crystal structures, DEER, SAXS and modelling methods. (a) Two views of the ensemble of models of FnIII-3,4 that fit the DEER and SAXS data. The orientations of FnIII-4 are coloured according to the fit to the 15 DEER restraints (σDEER) of the best models once the linker had been built. The colour intensity of the models of the linker (red) denotes the fit to the SAXS data (χSAXS) of the FnIII-3,4 structures. The σDEER and χSAXS colour scales are shown. (b) Plot of the σDEER and χSAXS values determined for the 21 models that best fit to the experimental data. χSAXS was determined for q ≤ 0.3 Å−1. Points with the same symbol correspond to models with the same orientation of FnIII-4. The SAXS profile is sensitive to the conformation of the linker, as revealed by the wide spread of χSAXS values for a given arrangement of the two FnIII domains. (c) Docking of the atomic models to the SAXS-derived averaged molecular envelope. For clarity, only the most frequent FnIII-4 orientation and the corresponding modelled linkers are shown. (d) Comparison of the theoretical scattering curve of the model with lowest χSAXS (red dashed line) to the experimental SAXS data (grey dots). (e) P(r) functions calculated for the atomic model (red dashed line) and estimated from the SAXS data (black line). Details of the modelling of the inter-domain orientation are shown in Supplementary Fig. S11.
Figure 9
Figure 9
Conserved interdomain region in FnIII-3,4 of β4. (a) Molecular surface of the FnIII-3,4 structure coloured by the evolutionary conservation of the amino acids in the β4 sequences of 39 species calculated with the ConSurf server. The linker is shown in the conformation that yielded the best fit to the SAXS data. (b) Alignment of the sequences of the linker of nine species representative of the evolutionary variability. Positions are coloured according to the evolutionary conservation as in (a). A complete alignment of the sequences of the β4 FnIII-3,4 region of 39 species is shown in Supplementary Fig. S12.

References

    1. Abrahams, J. P. & Leslie, A. G. W. (1996). Acta Cryst. D52, 30–42. - PubMed
    1. Afonine, P. V., Grosse-Kunstleve, R. W., Echols, N., Headd, J. J., Moriarty, N. W., Mustyakimov, M., Terwilliger, T. C., Urzhumtsev, A., Zwart, P. H. & Adams, P. D. (2012). Acta Cryst. D68, 352–367. - PMC - PubMed
    1. Alonso-García, N., Inglés-Prieto, A., Sonnenberg, A. & de Pereda, J. M. (2009). Acta Cryst. D65, 858–871. - PubMed
    1. Ashkenazy, H., Erez, E., Martz, E., Pupko, T. & Ben-Tal, N. (2010). Nucleic Acids Res. 38, W529–W533. - PMC - PubMed
    1. Baker, N. A., Sept, D., Joseph, S., Holst, M. J. & McCammon, J. A. (2001). Proc. Natl Acad. Sci. USA, 98, 10037–10041. - PMC - PubMed

Publication types