

Regulation of IL-17A responses in human airway smooth muscle cells by Oncostatin M
- PMID: 25849622
- PMCID: PMC4332894
- DOI: 10.1186/s12931-014-0164-4
Regulation of IL-17A responses in human airway smooth muscle cells by Oncostatin M
Abstract
Background: Regulation of human airway smooth muscle cells (HASMC) by cytokines contributes to chemotactic factor levels and thus to inflammatory cell accumulation in lung diseases. Cytokines such as the gp130 family member Oncostatin M (OSM) can act synergistically with Th2 cytokines (IL-4 and IL-13) to modulate lung cells, however whether IL-17A responses by HASMC can be altered is not known.
Objective: To determine the effects of recombinant OSM, or other gp130 cytokines (LIF, IL-31, and IL-6) in regulating HASMC responses to IL-17A, assessing MCP-1/CCL2 and IL-6 expression and cell signaling pathways.
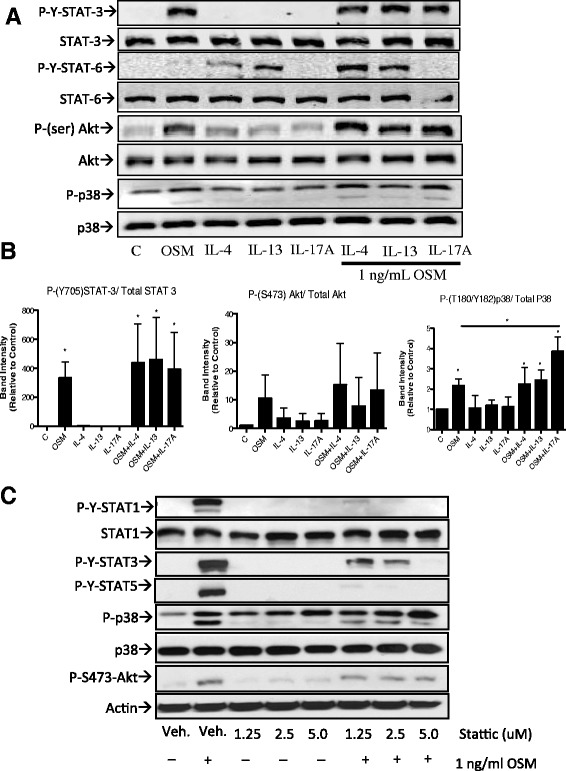
Methods: Cell responses of primary HASMC cultures were measured by the assessment of protein levels in supernatants (ELISA) and mRNA levels (qRT-PCR) in cell extracts. Activation of STAT, MAPK (p38) and Akt pathways were measured by immunoblot. Pharmacological agents were used to assess the effects of inhibition of these pathways.
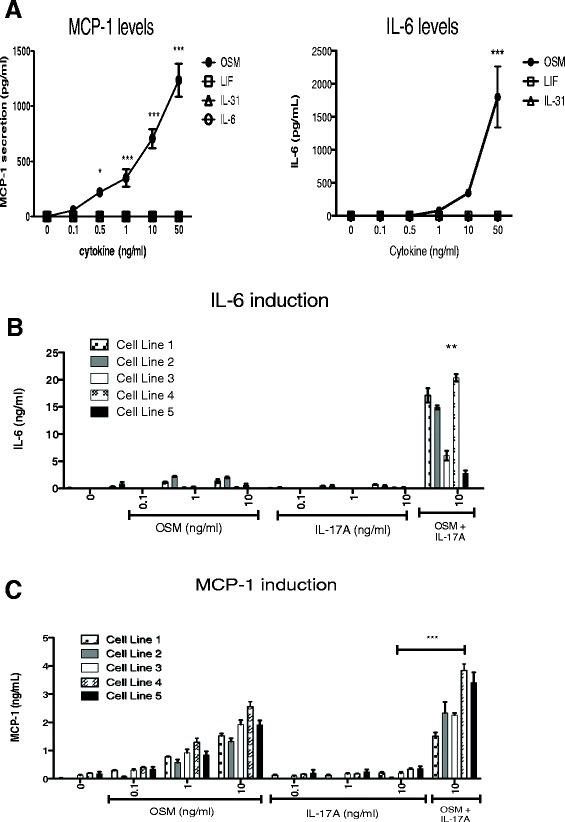
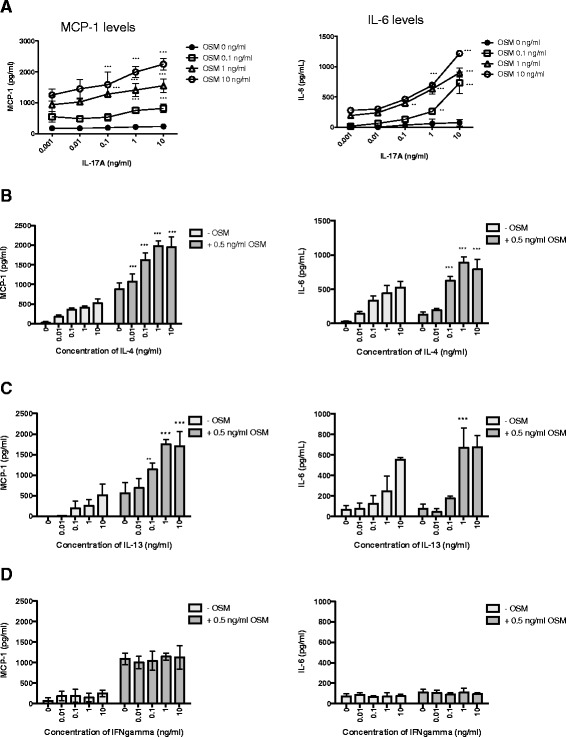
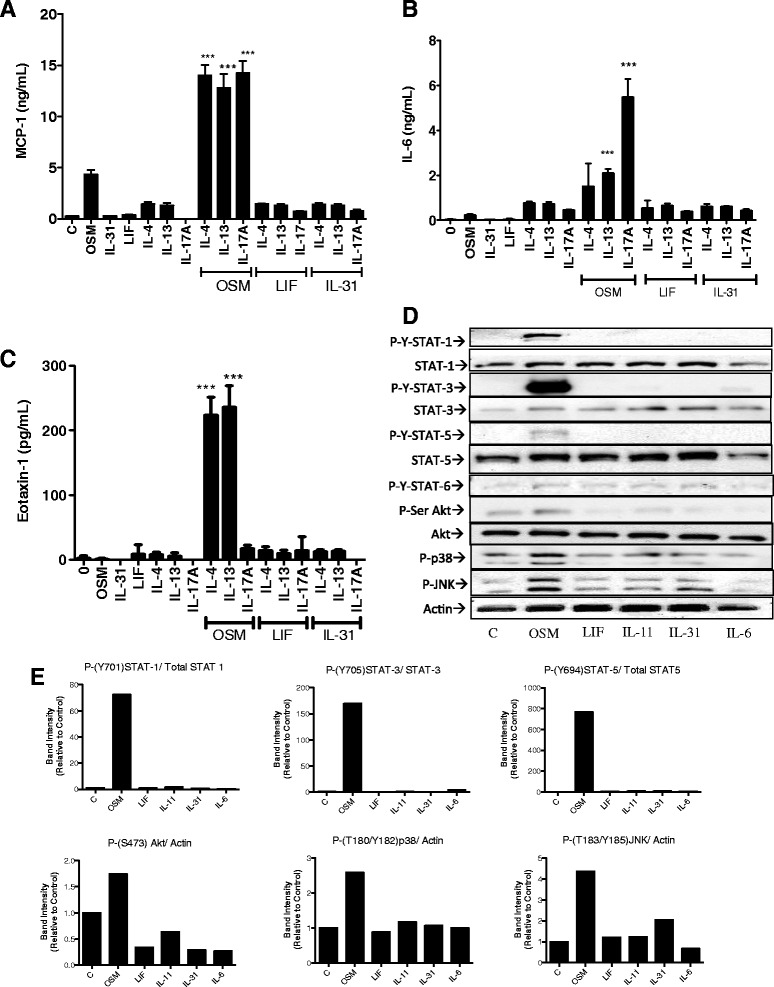
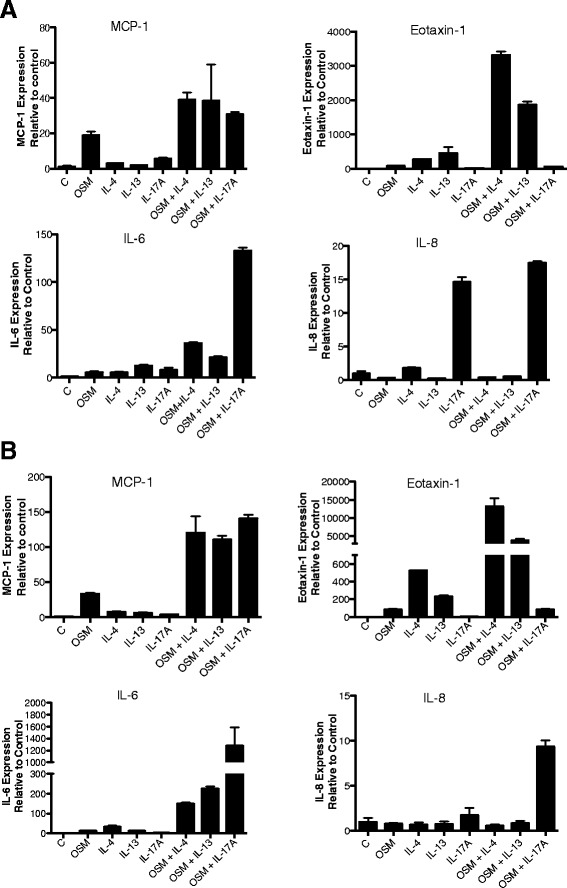
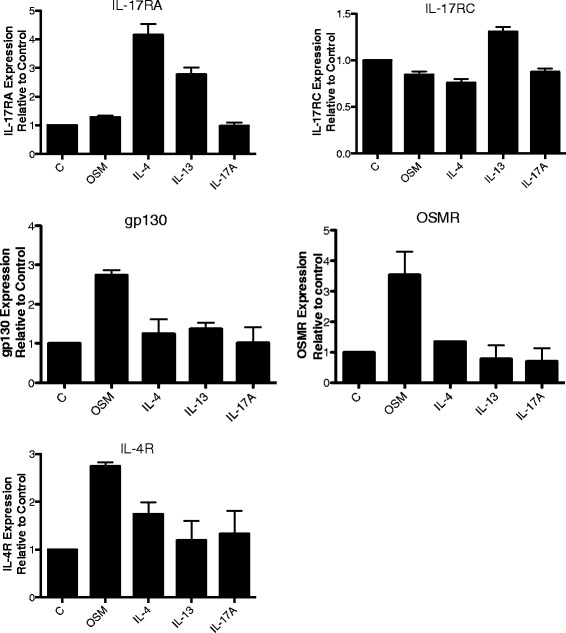
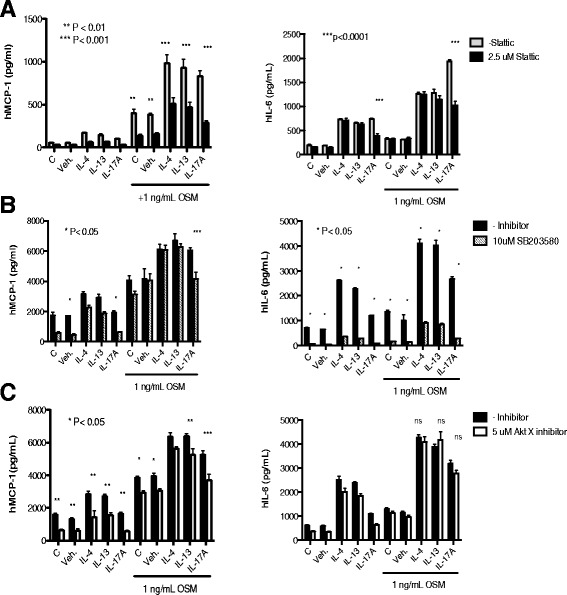
Results: OSM but not LIF, IL-31 or IL-6 could induce detectable responses in HASMC, elevating MCP-1/CCL2, IL-6 levels and activation of STAT-1, 3, 5, p38 and Akt cell signaling pathways. OSM induced synergistic action with IL-17A enhancing MCP-1/CCL-2 and IL-6 mRNA and protein expression, but not eotaxin-1 expression, while OSM in combination with IL-4 or IL-13 synergistically induced eotaxin-1 and MCP-1/CCL2. OSM elevated steady state mRNA levels of IL-4Rα, OSMRβ and gp130, but not IL-17RA or IL-17RC. Pharmacologic inhibition of STAT3 activation using Stattic down-regulated OSM, OSM/IL-4 or OSM/IL-13, and OSM/IL-17A synergistic responses of MCP-1/CCL-2 induction, whereas, inhibitors of Akt and p38 MAPK resulted in less reduction in MCP-1/CCL2 levels. IL-6 expression was more sensitive to inhibition of p38 (using SB203580) and was affected by Stattic in response to IL-17A/OSM stimulation.
Conclusions: Oncostatin M can regulate HASMC responses alone or in synergy with IL-17A. OSM/IL-17A combinations enhance MCP-1/CCL2 and IL-6 but not eotaxin-1. Thus, OSM through STAT3 activation of HASMC may participate in inflammatory cell recruitment in inflammatory airway disease.
Figures
Similar articles
-
Oncostatin M in the Regulation of Connective Tissue Cells and Macrophages in Pulmonary Disease.Biomedicines. 2019 Dec 5;7(4):95. doi: 10.3390/biomedicines7040095. Biomedicines. 2019. PMID: 31817403 Free PMC article. Review.
-
Oncostatin M-enhanced vascular endothelial growth factor expression in human vascular smooth muscle cells involves PI3K-, p38 MAPK-, Erk1/2- and STAT1/STAT3-dependent pathways and is attenuated by interferon-γ.Basic Res Cardiol. 2011 Mar;106(2):217-31. doi: 10.1007/s00395-010-0141-0. Epub 2010 Dec 21. Basic Res Cardiol. 2011. PMID: 21174212
-
IL-17A and IL-17F stimulate chemokines via MAPK pathways (ERK1/2 and p38 but not JNK) in mouse cultured mesangial cells: synergy with TNF-alpha and IL-1beta.Am J Physiol Renal Physiol. 2010 Mar;298(3):F779-87. doi: 10.1152/ajprenal.00198.2009. Epub 2009 Dec 30. Am J Physiol Renal Physiol. 2010. PMID: 20042461
-
Oncostatin M (OSM) primes IL-13- and IL-4-induced eotaxin responses in fibroblasts: regulation of the type-II IL-4 receptor chains IL-4Ralpha and IL-13Ralpha1.Exp Cell Res. 2009 Dec 10;315(20):3486-99. doi: 10.1016/j.yexcr.2009.09.024. Epub 2009 Sep 30. Exp Cell Res. 2009. PMID: 19799897
-
The clinical relevance of OSM in inflammatory diseases: a comprehensive review.Front Immunol. 2023 Sep 29;14:1239732. doi: 10.3389/fimmu.2023.1239732. eCollection 2023. Front Immunol. 2023. PMID: 37841259 Free PMC article. Review.
Cited by
-
Coordination of Immune-Stroma Crosstalk by IL-6 Family Cytokines.Front Immunol. 2019 May 15;10:1093. doi: 10.3389/fimmu.2019.01093. eCollection 2019. Front Immunol. 2019. PMID: 31156640 Free PMC article. Review.
-
IL-17 Receptor Signaling in the Lung Epithelium Is Required for Mucosal Chemokine Gradients and Pulmonary Host Defense against K. pneumoniae.Cell Host Microbe. 2016 Nov 9;20(5):596-605. doi: 10.1016/j.chom.2016.10.003. Epub 2016 Oct 27. Cell Host Microbe. 2016. PMID: 27923703 Free PMC article.
-
Neutrophil-Derived Oncostatin M Triggers Diverse Signaling Pathways during Pneumonia.Infect Immun. 2021 Mar 17;89(4):e00655-20. doi: 10.1128/IAI.00655-20. Print 2021 Mar 17. Infect Immun. 2021. PMID: 33526570 Free PMC article.
-
Oncostatin M in the Regulation of Connective Tissue Cells and Macrophages in Pulmonary Disease.Biomedicines. 2019 Dec 5;7(4):95. doi: 10.3390/biomedicines7040095. Biomedicines. 2019. PMID: 31817403 Free PMC article. Review.
-
Development of Adaptive Immunity and Its Role in Lung Remodeling.Adv Exp Med Biol. 2023;1426:287-351. doi: 10.1007/978-3-031-32259-4_14. Adv Exp Med Biol. 2023. PMID: 37464127
References
-
- Akiho H, Blennerhassett P, Deng Y, Collins SM. Role of IL-4, IL-13, and STAT6 in inflammation-induced hypercontractility of murine smooth muscle cells. Am J Physiol Gastrointest Liver Physiol. 2002;282:G226–32. - PubMed
Publication types
MeSH terms
Substances
Grants and funding
LinkOut - more resources
Full Text Sources
Other Literature Sources
Research Materials
Miscellaneous
