. 2015 May 5;54(17):2693-708.
doi: 10.1021/bi501489r. Epub 2015 Apr 22.

Spectroscopic studies reveal that the heme regulatory motifs of heme oxygenase-2 are dynamically disordered and exhibit redox-dependent interaction with heme

Affiliations

Spectroscopic studies reveal that the heme regulatory motifs of heme oxygenase-2 are dynamically disordered and exhibit redox-dependent interaction with heme

Ireena Bagai et al. Biochemistry. .

Abstract

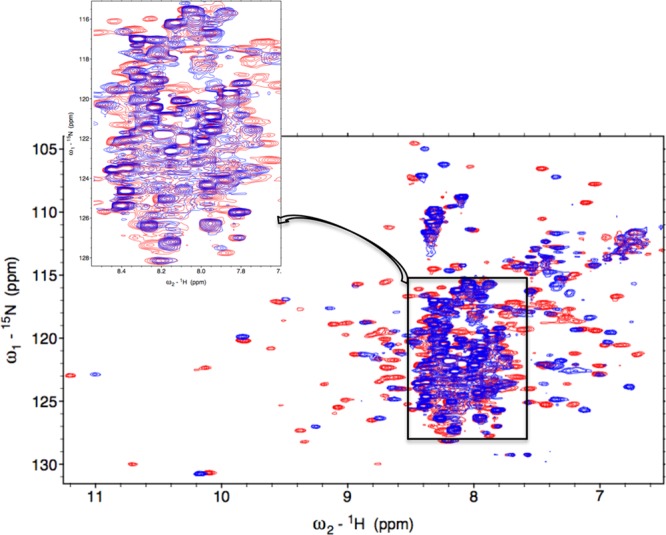
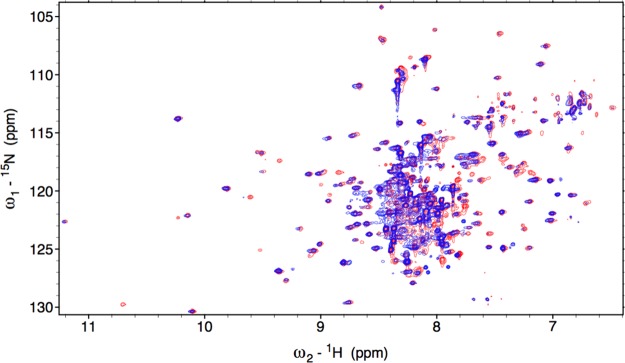
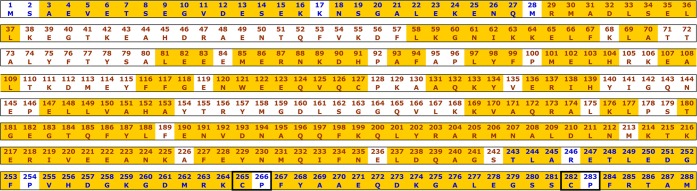
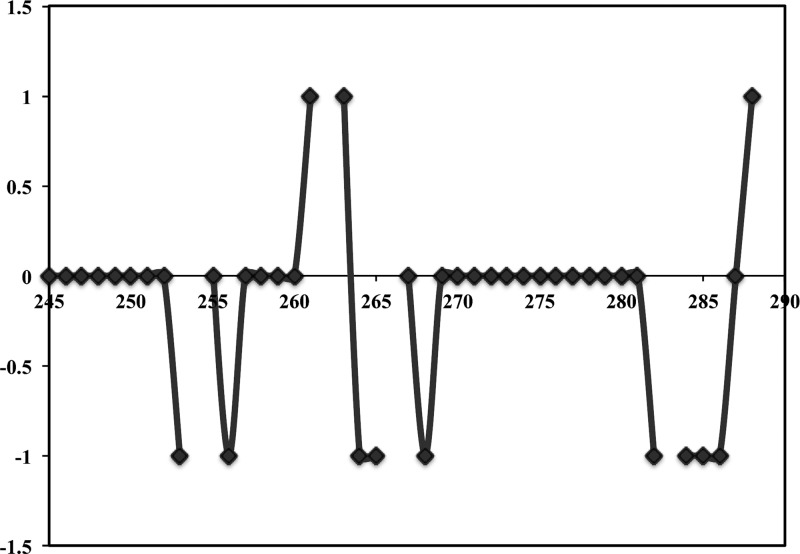
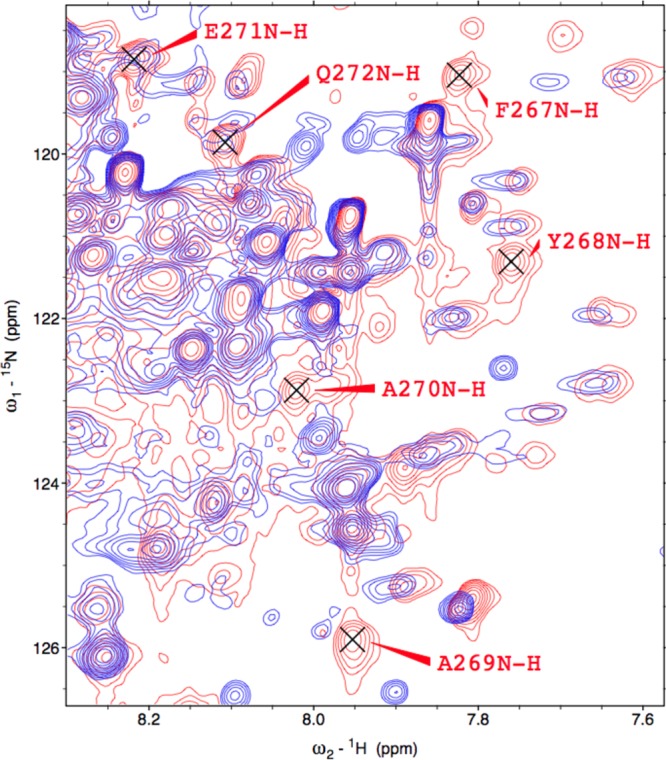
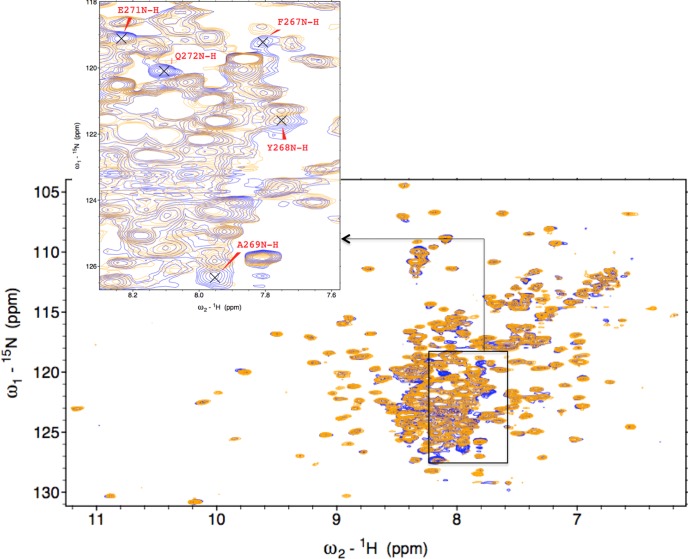
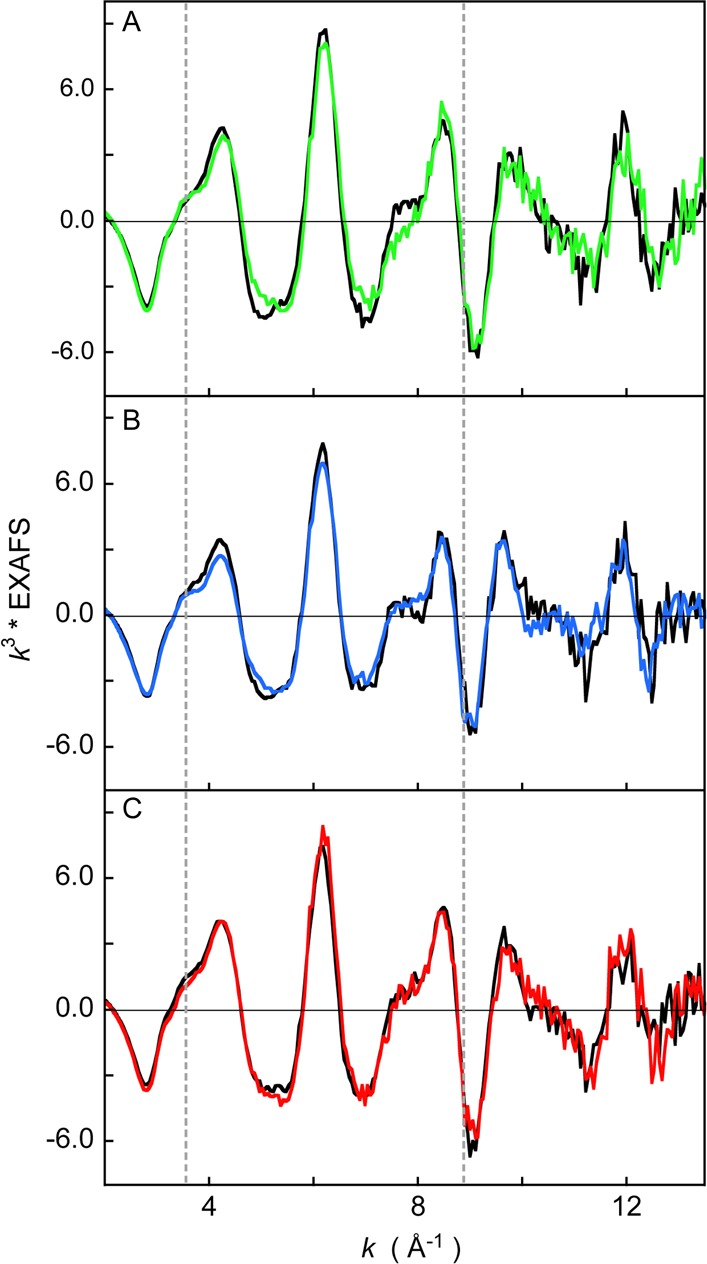
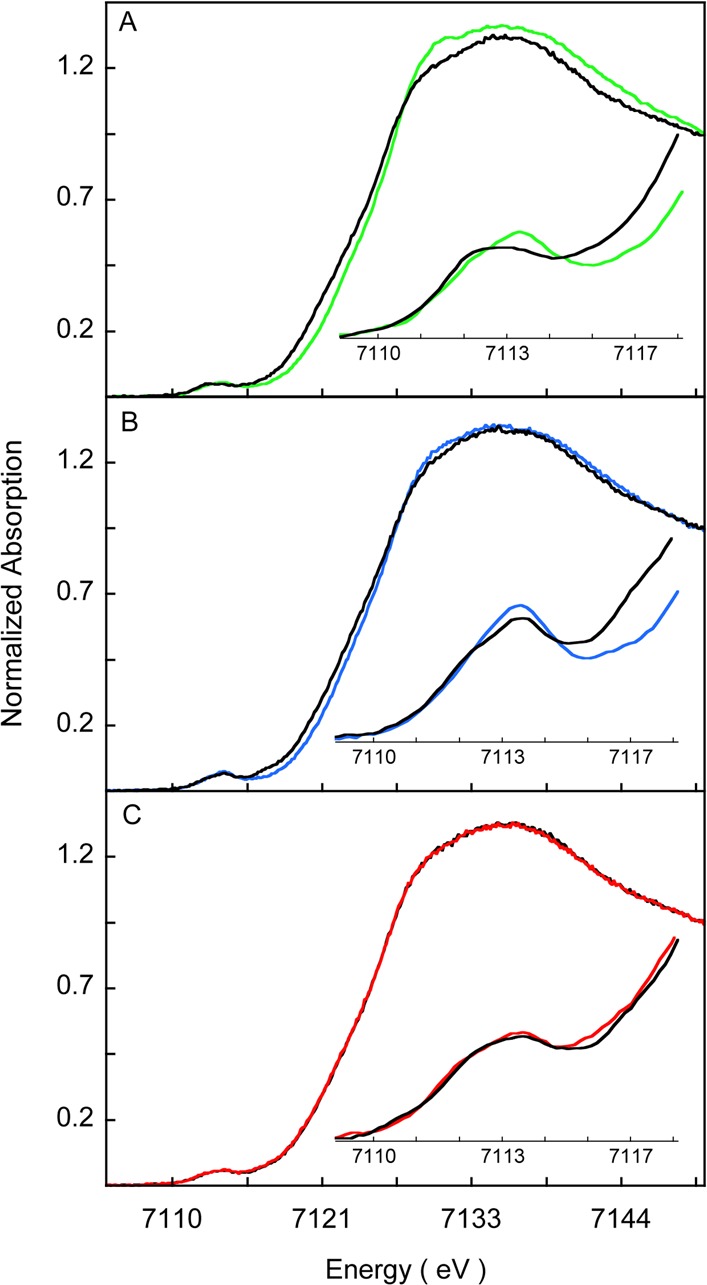
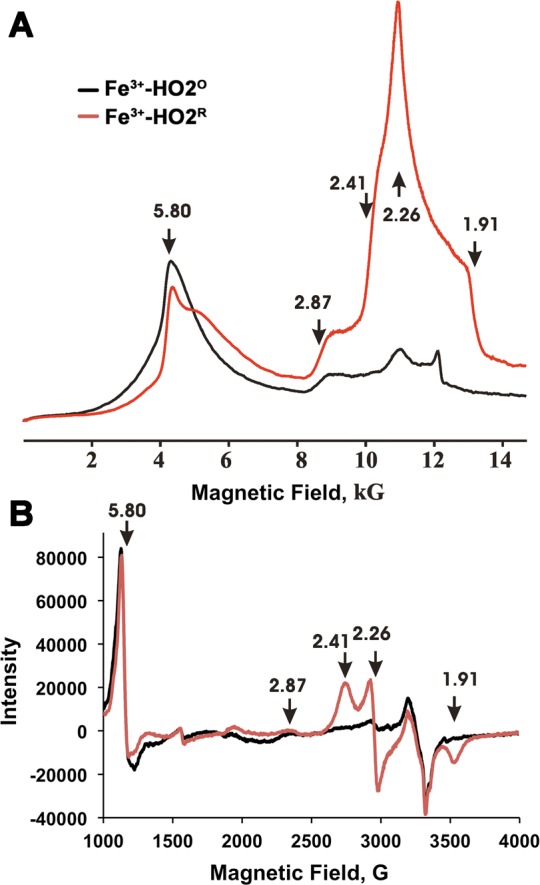
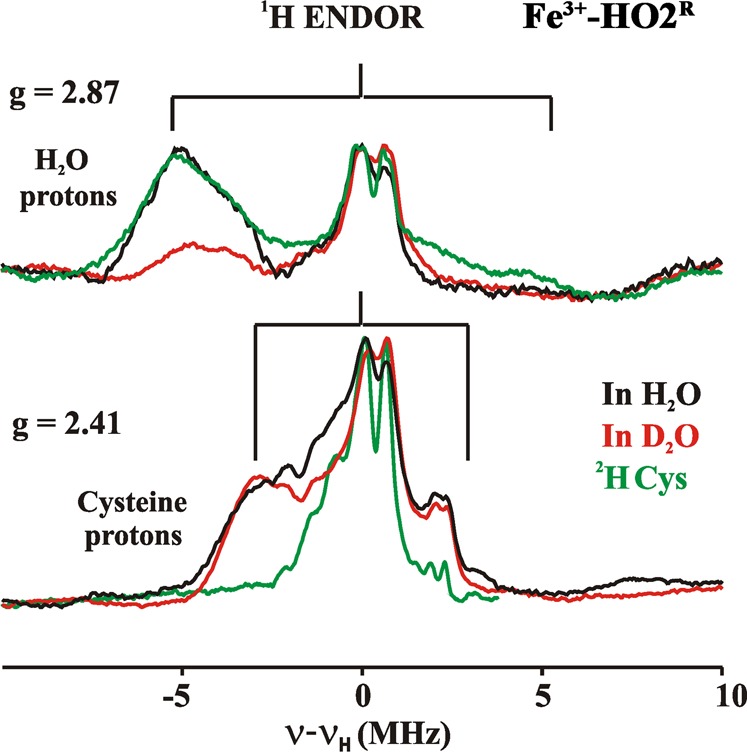
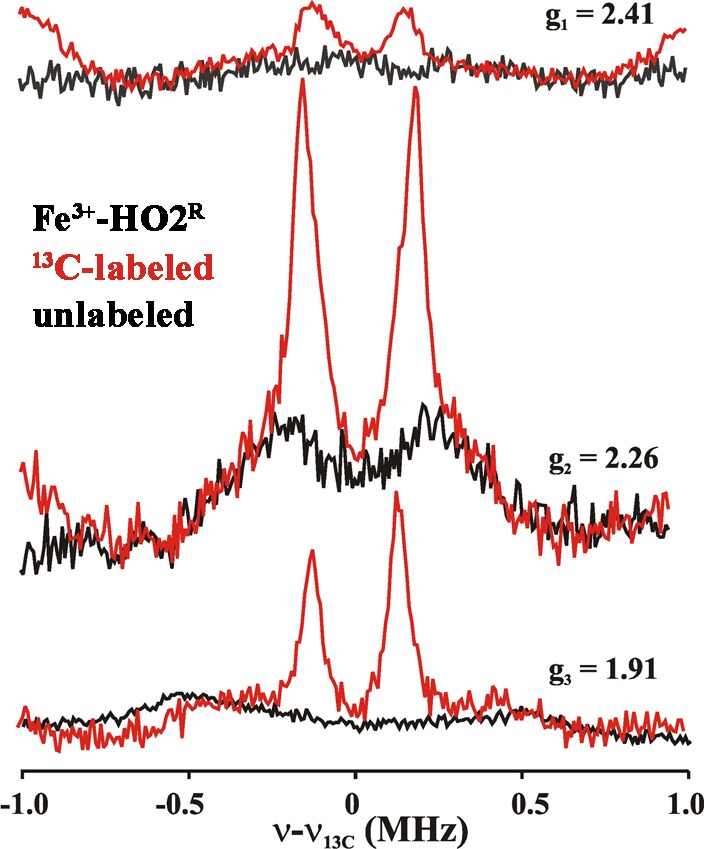
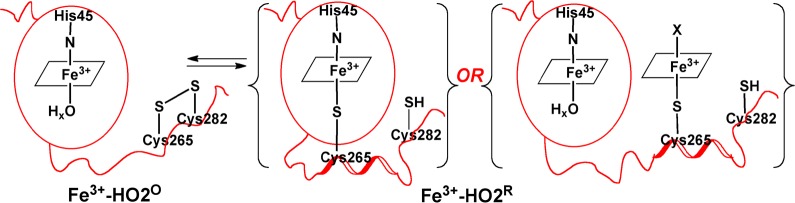
Heme oxygenase (HO) catalyzes a key step in heme homeostasis: the O2- and NADPH-cytochrome P450 reductase-dependent conversion of heme to biliverdin, Fe, and CO through a process in which the heme participates both as a prosthetic group and as a substrate. Mammals contain two isoforms of this enzyme, HO2 and HO1, which share the same α-helical fold forming the catalytic core and heme binding site, as well as a membrane spanning helix at their C-termini. However, unlike HO1, HO2 has an additional 30-residue N-terminus as well as two cysteine-proline sequences near the C-terminus that reside in heme regulatory motifs (HRMs). While the role of the additional N-terminal residues of HO2 is not yet understood, the HRMs have been proposed to reversibly form a thiol/disulfide redox switch that modulates the affinity of HO2 for ferric heme as a function of cellular redox poise. To further define the roles of the N- and C-terminal regions unique to HO2, we used multiple spectroscopic techniques to characterize these regions of the human HO2. Nuclear magnetic resonance spectroscopic experiments with HO2 demonstrate that, when the HRMs are in the oxidized state (HO2(O)), both the extra N-terminal and the C-terminal HRM-containing regions are disordered. However, protein NMR experiments illustrate that, under reducing conditions, the C-terminal region gains some structure as the Cys residues in the HRMs undergo reduction (HO2(R)) and, in experiments employing a diamagnetic protoporphyrin, suggest a redox-dependent interaction between the core and the HRM domains. Further, electron nuclear double resonance and X-ray absorption spectroscopic studies demonstrate that, upon reduction of the HRMs to the sulfhydryl form, a cysteine residue from the HRM region ligates to a ferric heme. Taken together with EPR measurements, which show the appearance of a new low-spin heme signal in reduced HO2, it appears that a cysteine residue(s) in the HRMs directly interacts with a second bound heme.


Figures

Figure 1
Figure 1
Overlay of the 800 MHz 1H- 15N TROSY-HSQC spectra of Fe3+-HO2O in red with apo-HO2O in blue, showing changes in chemical shifts in all parts of the protein. Inset zooms in on the crowded region in the middle of the spectrum. HO2 was present at a concentration of 250 μM in 50 mM Tris HCl, 50 mM KCl, pH 7.0 buffer. The spectra were collected at 30 °C.
Figure 2
Figure 2
Overlay of the 800 MHz 1H-15N TROSY-HSQC spectrum of Fe3+-HO2O in red and Fe3+-HO2R in blue.
Figure 3
Figure 3
Sequence of the HO2(1–288). In blue are the residues for which no electron density was observed in the crystal structure. Yellow areas indicate assigned residues and black boxes encompass HRMs.
Figure 4
Figure 4
Chemical shift index (CSI) plot of α-carbons of residues in the C-terminal tail of Fe3+-HO2O. The values of CSI for β-strand, α-helix, and random coil are +1, −1, and 0, respectively, as defined by the program CSI. Missing indices correspond to M262, which could not be assigned and the prolines (254, 266, and 283) for which assignments cannot be determined in the H-detect experiments. The assigned secondary structure illustrates the C-terminal region to be a random coil in Fe3+-HO2O.
Figure 5
Figure 5
Portion of the 1H-15N TROSY overlay of Fe3+-HO2O in red and Fe3+-HO2R in blue (see Figure 1), to indicate the residues that have disappeared in the reduced form.
Figure 6
Figure 6
1H- 15N TROSY overlay of the ZnPP-bound HO2O (blue) and HO2R (orange). Inset shows residues that have completely disappeared in the HO2R spectrum. These are the same residues in the C-terminal region around Cys265 as those monitored for Fe3+-HO2R. HO2 was present at a concentration of approximately 200 μM each in 50 mM Tris, 50 mM KCl, pH 7.0 buffer.
Figure 7
Figure 7
A comparison of k3-weighted EXAFS data of (A) WT Fe3+-HO2° (green line), WT Fe3+-HO2R (black line), (B) C127A/C265A Fe3+-HO2O (blue line), C127A/C265A Fe3+-HO2R (black line), and (C) C127A/C282A Fe3+-HO2O (red line), C127A/C282A Fe3+-HO2R (black line).
Figure 8
Figure 8
Normalized Fe K-edge XANES spectra for HO2 protein and select mutants. (A) WT Fe3+-HO2O (green line), WT Fe3+-HO2R (black line), (B) C127A/C265A variant of Fe3+-HO2O (blue line), C127A/C265A variant of Fe3+-HO2R (black line), and (C) C127A/C282A variant of Fe3+-HO2O (red line), reduced C127A/C282A Fe3+-HO2R (black line).
Figure 9
Figure 9
Continuous wave EPR spectra of the low- and high-spin states of Fe3+-HO2O (black) and Fe3+-HO2R (red). (A) Dispersion mode, Q-band EPR. Experimental conditions: Temperature = 2 K, microwave frequency = 34.9 GHz, Modulation amplitude 1 G, time constant = 64 ms, scan time = 480 s, number of points = 2000. (B) X-band EPR. Experimental conditions: Temperature = 10 K, microwave frequency = 9.388 GHz, modulation amplitude 10.15 G, time constant = 40.960 ms, scan time = 671.089 s, number of points = 4096. The arrows show the g-values for the high and low spin state of the heme.
Figure 10
Figure 10
1H 35 GHz CW ENDOR spectra of Fe3+-HO2R recorded at the two unique g values. Spectra were recorded in H2O (black), D2O (red), or in H2O with 2H-Cys-labeled protein (green). The braces show the range of the proton coupling. Experimental conditions: Temperature, 2 K; Microwave frequency, 34.9 GHz; Modulation amplitude, 2G; RF sweep rate, 1 MHz/s; rf excitation was broadened to 100 kHz.
Figure 11
Figure 11
13C MIMS ENDOR spectra of Fe3+-HO2R. Unlabeled (black), 13C-labeled (red). The spectra are recorded at the field positions mentioned by g-values. Experimental conditions; MW freq = 34.8 GHz, T = 2 K. pulse sequence used as discussed in Methods. tp = 50 ns, τ = 700 ns, trf = 20 μs, trep = 20 ms, no of points 256, transients/scan.
Figure 12
Figure 12
Model describing the redox-dependence of heme binding to the HRMs of HO2. In Fe3+-HO2°, the thiolate of Cys265 is sequestered in a disulfide bond and is unavailable to ligate heme. However, upon reduction of the disulfide bond in Fe3+-HO2R, the free thiolate is available to bind to heme. Further studies are required to discriminate between binding of Cys265 to heme in the catalytic core or directly to a second heme in the HRM. However, as discussed in the manuscript, we favor the latter scenario.

Similar articles

Cited by

References

    1. Kim H. P.; Ryter S. W.; Choi A. M. (2006) CO as a cellular signaling molecule. Annu. Rev. Pharmacol. Toxicol. 46, 411–449. - PubMed
    1. Perutz M. F.; Mazzarella L. (1963) A Preliminary X-Ray Analysis of Haemoglobin H. Nature 199, 639. - PubMed
    1. Ingram D. J.; Kendrew J. C. (1956) Orientation of the haem group in myoglobin and its relation to the polypeptide chain direction. Nature 178, 905–906. - PubMed
    1. Guengerich F. P.; MacDonald T. L. (1990) Mechanisms of cytochrome P-450 catalysis. FASEB J. 4, 2453–2459. - PubMed
    1. Sasakura Y.; Yoshimura-Suzuki T.; Kurokawa H.; Shimizu T. (2006) Structure-function relationships of EcDOS, a heme-regulated phosphodiesterase from Escherichia coli. Acc. Chem. Res. 39, 37–43. - PubMed

Publication types

MeSH terms

LinkOut - more resources