. 2015 May;18(5):647-56.
doi: 10.1038/nn.3995. Epub 2015 Apr 6.

Regulation of chromatin accessibility and Zic binding at enhancers in the developing cerebellum

Affiliations

Regulation of chromatin accessibility and Zic binding at enhancers in the developing cerebellum

Christopher L Frank et al. Nat Neurosci. 2015 May.

Abstract

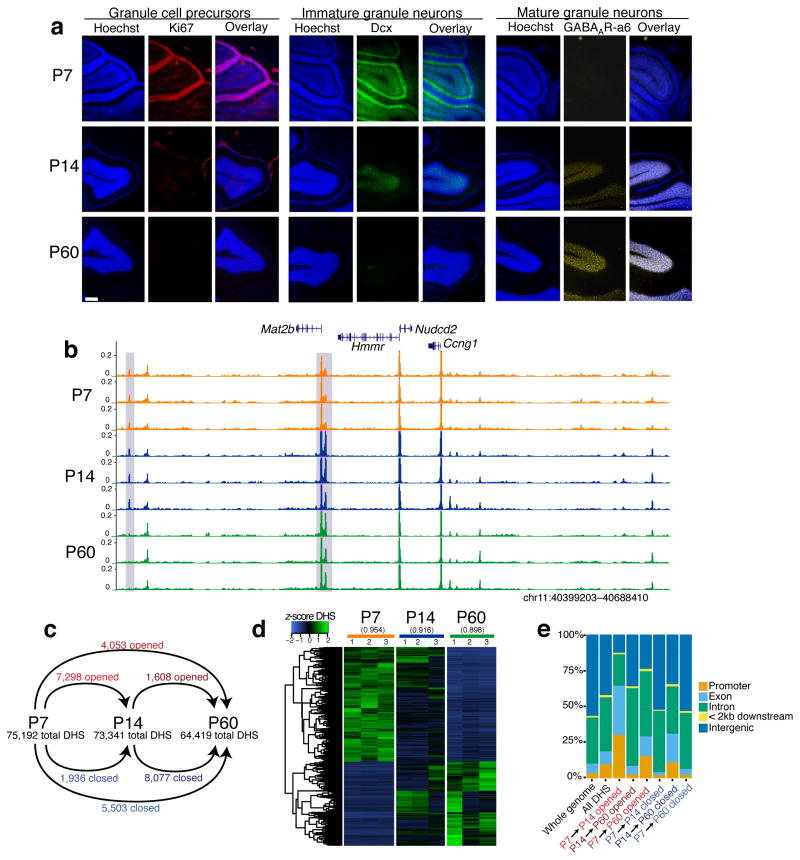
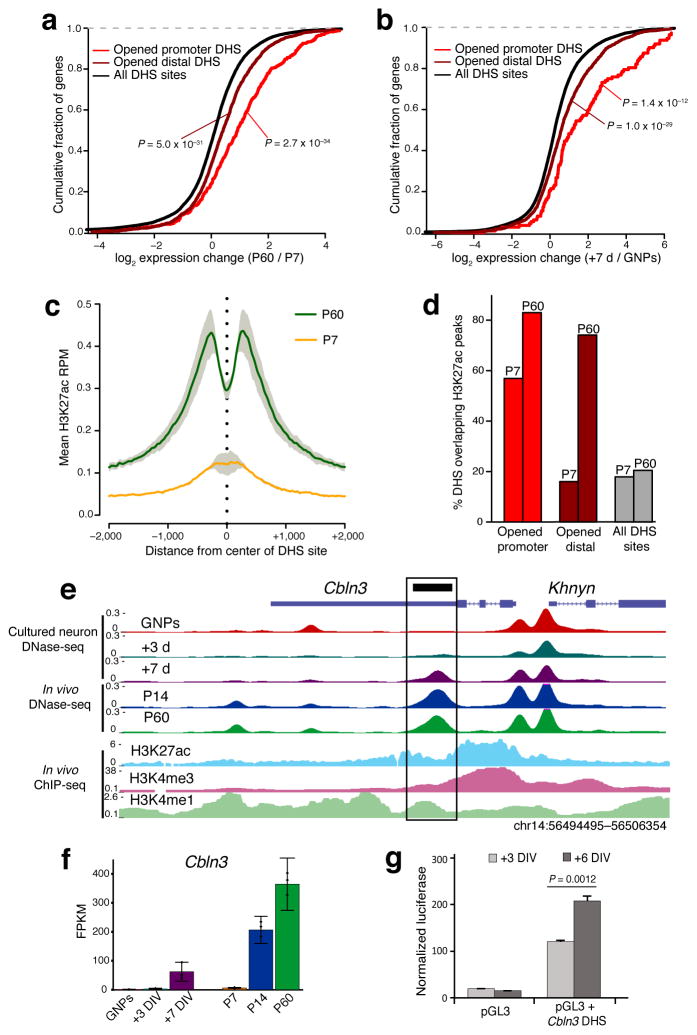
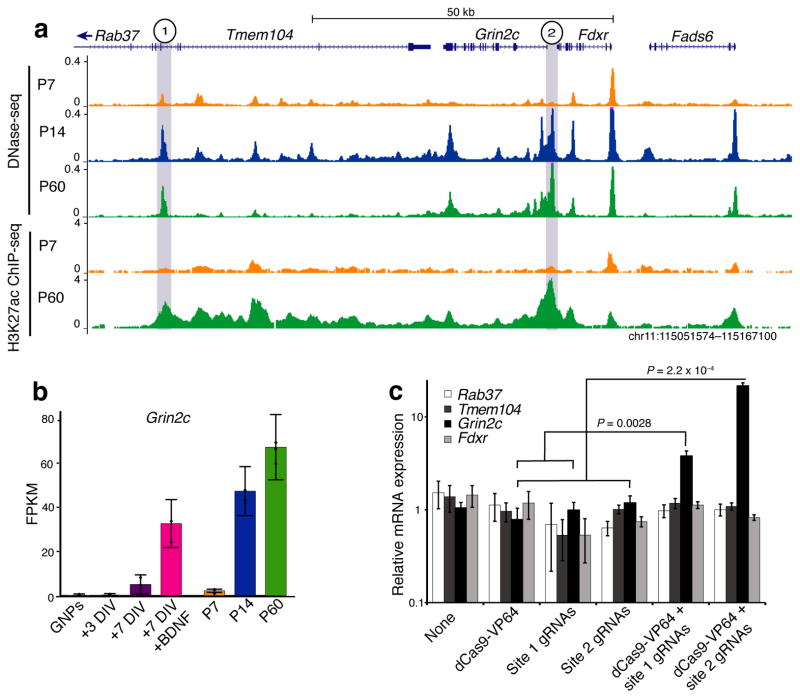
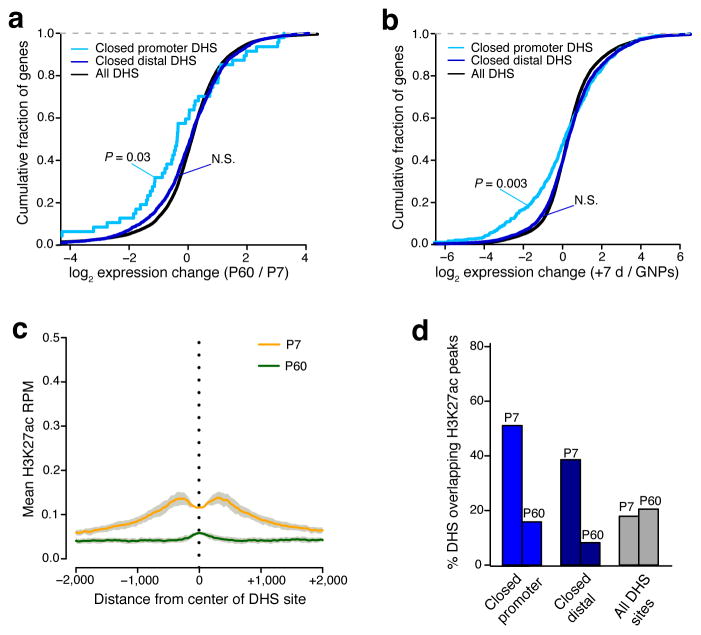
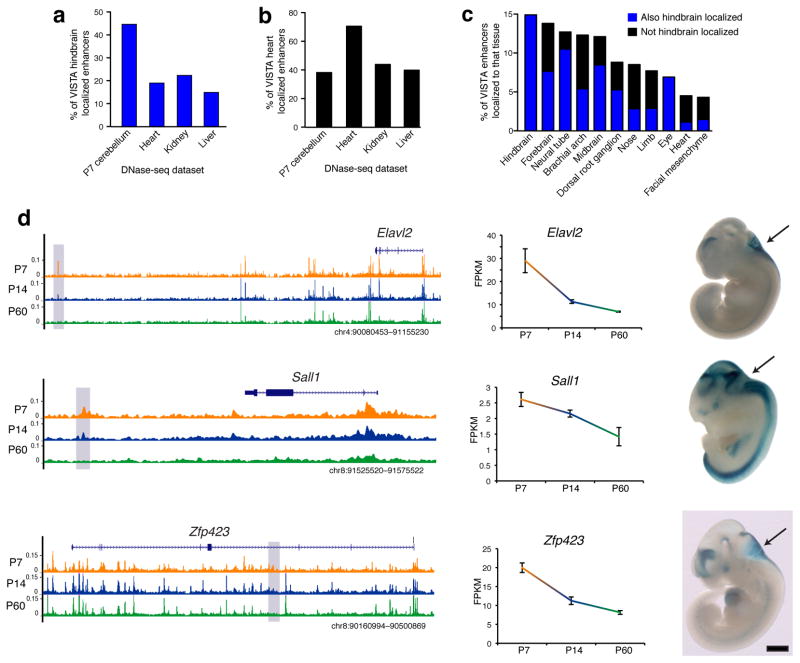
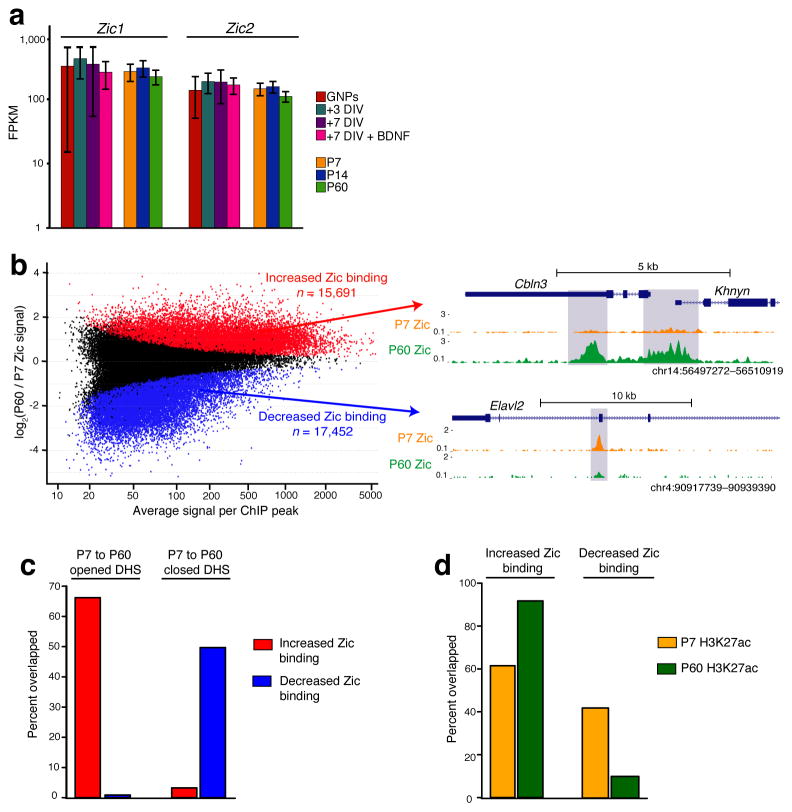
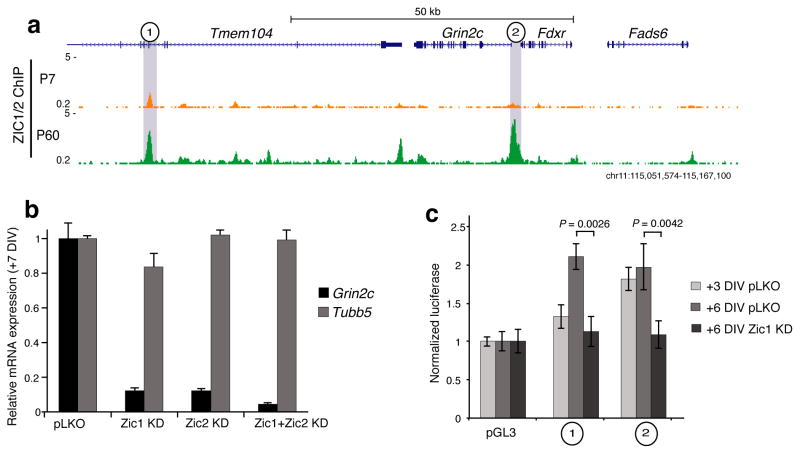
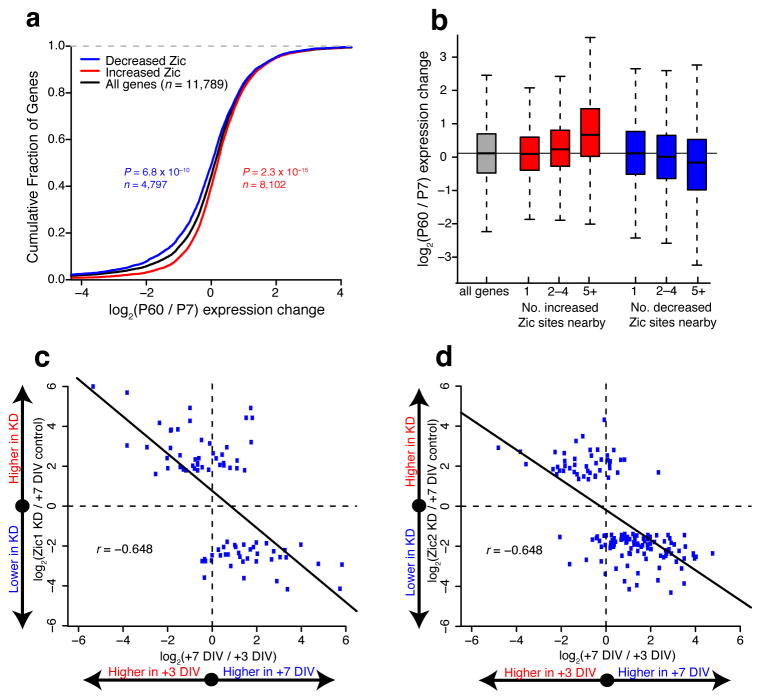
To identify chromatin mechanisms of neuronal differentiation, we characterized chromatin accessibility and gene expression in cerebellar granule neurons (CGNs) of the developing mouse. We used DNase-seq to map accessibility of cis-regulatory elements and RNA-seq to profile transcript abundance across postnatal stages of neuronal differentiation in vivo and in culture. We observed thousands of chromatin accessibility changes as CGNs differentiated, and verified, using H3K27ac ChIP-seq, reporter gene assays and CRISPR-mediated activation, that many of these regions function as neuronal enhancers. Motif discovery in differentially accessible chromatin regions suggested a previously unknown role for the Zic family of transcription factors in CGN maturation. We confirmed the association of Zic with these elements by ChIP-seq and found, using knockdown, that Zic1 and Zic2 are required for coordinating mature neuronal gene expression patterns. Together, our data reveal chromatin dynamics at thousands of gene regulatory elements that facilitate the gene expression patterns necessary for neuronal differentiation and function.


Figures

Figure 1
Figure 1. Postnatal cerebellar development involves extensive chromatin remodeling
(a) Immunostaining of cerebellar cortex in sagittal section at postnatal day 7 (P7), 14 (P14), and 60 (P60). Ki67 marks active cell proliferation, doublecortin (Dcx) marks immature/migrating neurons, and GABAA receptor subunit α6 (GABAARα6) marks mature neurons. Nuclei stained with Hoechst (blue). White scale bar is 200 μm. This experiment was performed once. (b) Example region of mm9 genome showing reproducible DNase-seq chromatin accessibility profiles across biological triplicates of P7, P14, and P60 cerebella. Gray boxes denote DHS sites that change between developmental stages. Y-axes fixed across samples. (c) Number of total peak calls and significantly opened or closed DHS sites between P7, P14, and P60 cerebella pairwise comparisons (FDR < 0.05, n = 3 biological replicates of pooled cerebella). (d) Heatmap of DNase-seq accessibility across three timepoints for regions marked significant in DESeq analysis. Mean pairwise Pearson correlation between replicates listed above heatmap. (e) Distribution of gene features that opened, closed, and all identified DHS sites map to.
Figure 2
Figure 2. Opening DHS sites mark late-acting neuronal enhancers
(a,b) Cumulative fraction of genes nearest to opened promoter-located, opened distal, and all identified DHS sites with given fold-change in RNA-seq expression from P7 to P60 cerebellum (a) or from GNPs to +7DIV (b). Rightward shift indicates genes increased in expression across developmental time. Significance assessed by Mann-Whitney U test. (n = 3 biological replicates of pooled cerebella). (c) Mean H3K27ac ChIP-seq signal (reads per million mapped) present at center of P7 to P60 opened DHS sites (4053 sites) in either P7 cerebellum (orange line) or P60 cerebellum (green line). Gray = s.e.m.. (n = 2 biological replicates of pooled cerebella). (d) Percent of opened promoter-located, opened distal, and all DHS sites overlapping H3K27ac peaks identified in P7 or P60 cerebellum. (e) UCSC browser image highlighting a DHS site found in the 3′UTR of Cbln3 (black box) that opens during development and overlaps H3K27ac and H3K4me1 enrichment in adult cerebellum. (f) RNA-seq expression of Cbln3 across developmental time in vivo and in cultured CGNs. DIV = Days In Vitro. Error bars = 95% CI. (g) Luciferase reporter assay for enhancer activity conferred by a DHS site in Cbln3 at +3DIV and +6DIV. P = 0.0012 by two-sided Student’s t-test (n = 3 transfections, t = 8.3). Error bars = s.e.m.
Figure 3
Figure 3. CRISPR-VP64 based activation confirms enhancer activity of late-opening DHS sites nearby Grin2c
(a) DNase-seq and H3K27ac ChIP-seq signal in vicinity of Grin2c with two DHS sites that open across development and increase in H3K27ac signal marked in gray. (b) RNA-seq expression of Grin2c across developmental time in vivo and in culture. BDNF = Brain-derived neurotrophic factor. Error bars = 95% CI. (c) Cultured CGNs were either left uninfected (none), or were infected with dCas9-VP64 activator, three gRNAs targeting site #1 from (a), three gRNAs targeting site #2, or a combination of dCas9-VP64 and one of the two sets of gRNAs on +1DIV, and harvested for qPCR on +7DIV. All data normalized to expression of Gapdh and scaled to average expression in control conditions (dCas9-VP64 or gRNAs only). P = 0.0028 for site 1 and P = 0.00022 for site 2 by two-sided Student’s t-test for dCas9-VP64 plus gRNAs vs. dCas9-VP64 or gRNAs alone (n = 5 for dCas9-VP64 with gRNAs, n = 8 for site 1 controls, n = 10 for site 2 controls; t = 5.5 for site 1, t = 12.3 for site 2). Error bars = s.e.m.
Figure 4
Figure 4. A subset of closing DHS sites mark early postnatal enhancer elements
(a,b) Cumulative fraction of genes nearest to closed promoter-located, closed distal, and all identified DHS sites with given fold-change in RNA-seq expression from P7 to P60 cerebellum (a) or from GNPs to +7DIV (b). Leftward shift indicates genes decreased in expression across developmental time. Significance assessed by Mann-Whitney U test. (c) Mean H3K27ac ChIP-seq signal (reads per million mapped) present at center of P7 to P60 closed DHS sites (5503 sites) in either P7 cerebellum (orange line) or P60 cerebellum (green line). Gray = s.e.m. (n = 2 biological replicates of pooled cerebella). (d) Percent of closed promoter-located, closed distal, and all DHS sites overlapping H3K27ac peaks identified in P7 or P60 cerebellum.
Figure 5
Figure 5. Postnatal closing DHS sites are enriched for embryonic hindbrain enhancer activity
Percent of hindbrain (a) or heart (b) localized VISTA Enhancer Browser staining (embryonic day 11.5) covered by all DHS sites identified in P7 cerebellum, heart, kidney, or liver mouse tissues (matching number of top peaks). (c) Percent of VISTA Enhancer Browser tissue-localized enhancers overlapped by DHS sites that close from P7 to P60. Tissues ordered by overlap rank. (d) Closed DHS sites located closest to the Elavl2, Sall1, and Zfp423 genes, all of which decrease in expression from P7 to P60 (center). Hindbrain expression is driven by each DHS site at E11.5, as seen with LacZ (blue) staining of embryos on right. Black scale bar = 1 mm. Images sourced from VISTA Enhancer Browser: hs643, hs152, and hs625.
Figure 6
Figure 6. Zic1/2 binding is highly dynamic across postnatal cerebellar development
(a) Zic1 and Zic2 RNA-seq expression across in vivo and cultured CGN development (n = 3). (b) Zic binding changes between P7 and P60 cerebellum. Red points represent ChIP-seq peaks with significantly increased Zic binding from P7 to P60, blue points are peaks with decreased binding (FDR < 0.05, n = 2 biological replicates of pooled cerebella). UCSC genome browser images to the right show examples of increased and decreased Zic binding. Note the peak located in the 3′UTR of Cbln3 coincides with opened enhancer element tested in Fig. 2g. (c) Overlap between differential Zic binding sites and DHS sites that open or close from P7 to P60. (d) Overlap between differential Zic binding sites and H3K27ac ChIP-seq peaks identified in P7 or P60 cerebellum.
Figure 7
Figure 7. Grin2c transcription is controlled by Zic1/2 stage-specific access to enhancer elements
(a) Zic1/2 ChIP-seq signal in the vicinity of Grin2c. The two sites highlighted in gray increase accessibility, gain H3K27ac, and increase Zic1/2 affinity during development from P7 to P60 cerebellum. Also see Fig. 3a. (b) qRT-PCR Grin2c expression levels in culture at +7DIV following Zic1, Zic2, or combined Zic1 and Zic2 knockdown by shRNA, compared to empty vector (pLKO). Tubb5 used as control for total neuron number. Error bars = s.e.m. (n = 3 cultures). (c) Luciferase reporter assay for DHS sites highlighted in (a) in cultured neurons. Both sites are sufficient to confer enhancer activity that is reduced by Zic1 knockdown at +6DIV. Error bars = s.e.m. P = 0.0026 for site 1 and P = 0.0042 for site 2by two-sided Student’s t-test for Zic1 KD vs. pLKO control (n = 3 transfections, t = 6.7 and 5.8).
Figure 8
Figure 8. Zic1/2 promote the mature CGN transcriptional program
(a) Relationship between Zic binding changes and nearby gene RNA-seq expression changes from P7 to P60. Significance of shifts assessed by two-sided Mann-Whitney U test. (b) Boxplots of gene expression change from P7 to P60 cerebellum binned by number of Zic binding sites associated with each gene. Having multiple Zic binding changes nearby more strongly associates with directional gene expression changes than single sites. (c,d) Relationship between cultured CGN development and Zic1 (c) or Zic2 (d) shRNA knockdown for genes marked significant in knockdown RNA-seq experiments (FDR < 0.10, n = 2 independent cultures). X-axis shows fold change in gene expression between +3DIV and +7DIV in cultured CGNs. Y-axis shows fold change in gene expression between control infected and Zic1 or Zic2 knockdown. Both knockdowns exhibit negative Pearson correlation coefficients (r).

References

    1. Song L, et al. Open chromatin defined by DNaseI and FAIRE identifies regulatory elements that shape cell-type identity. Genome Res. 2011;21:1757–1767. - PMC - PubMed
    1. Heintzman ND, et al. Histone modifications at human enhancers reflect global cell-type-specific gene expression. Nature. 2009;459:108–112. - PMC - PubMed
    1. Levine M, Cattoglio C, Tjian R. Looping back to leap forward: transcription enters a new era. Cell. 2014;157:13–25. - PMC - PubMed
    1. Gray PA, et al. Mouse brain organization revealed through direct genome-scale TF expression analysis. Science. 2004;306:2255–2257. - PubMed
    1. Pattabiraman K, et al. Transcriptional regulation of enhancers active in protodomains of the developing cerebral cortex. Neuron. 2014;82:989–1003. - PMC - PubMed

Publication types

MeSH terms

Associated data