. 2015 May;18(5):760-6.
doi: 10.1038/nn.3994. Epub 2015 Apr 6.

Medial prefrontal cortical activity reflects dynamic re-evaluation during voluntary persistence

Affiliations

Medial prefrontal cortical activity reflects dynamic re-evaluation during voluntary persistence

Joseph T McGuire et al. Nat Neurosci. 2015 May.

Abstract

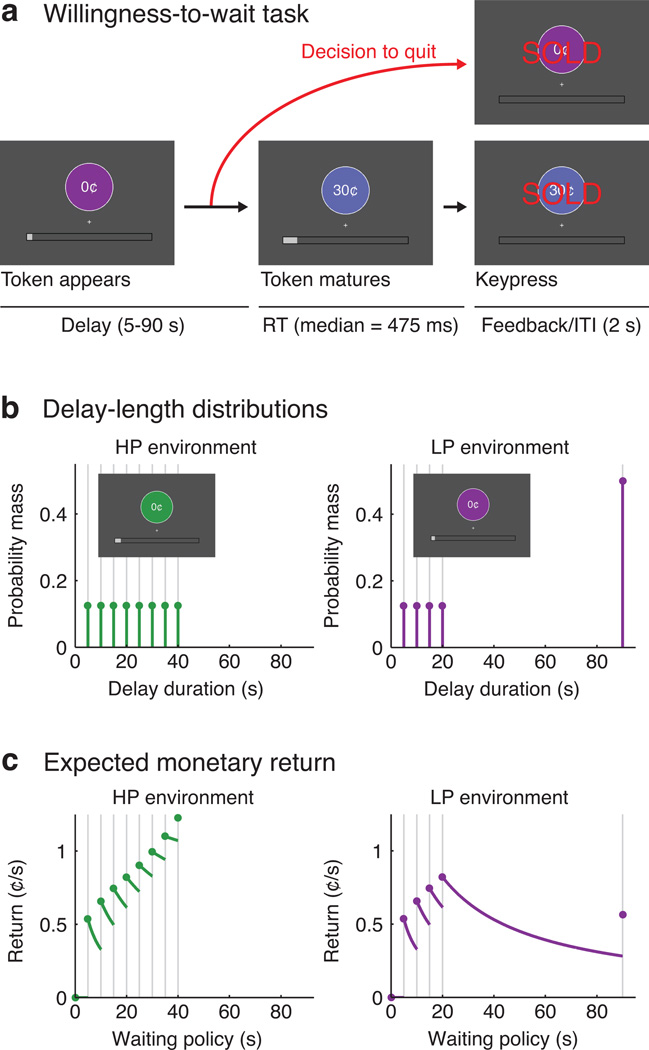
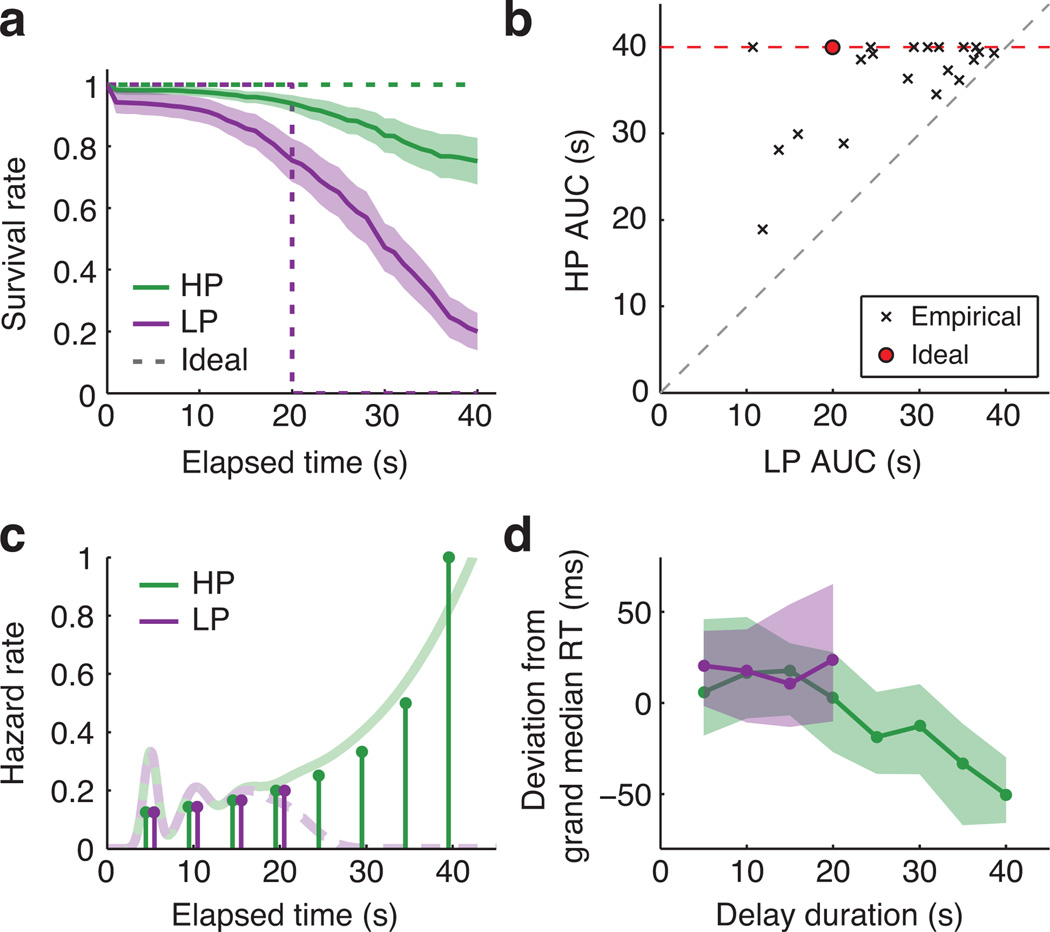
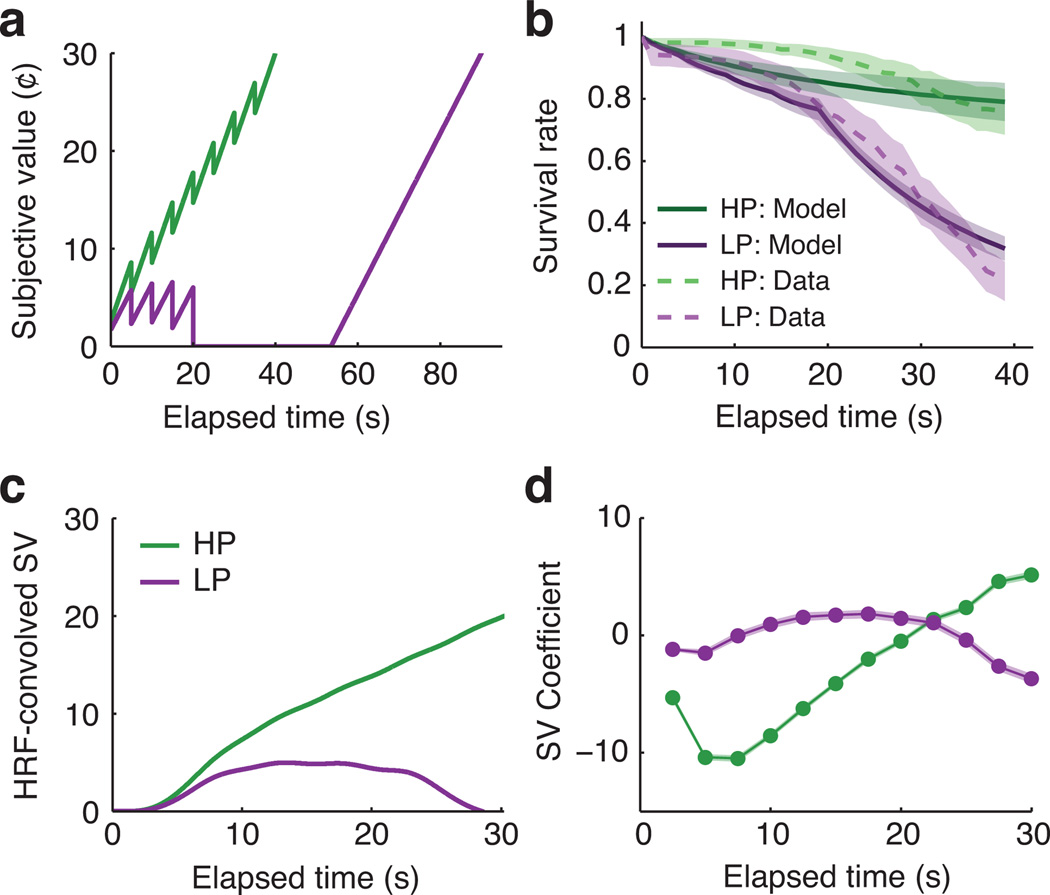
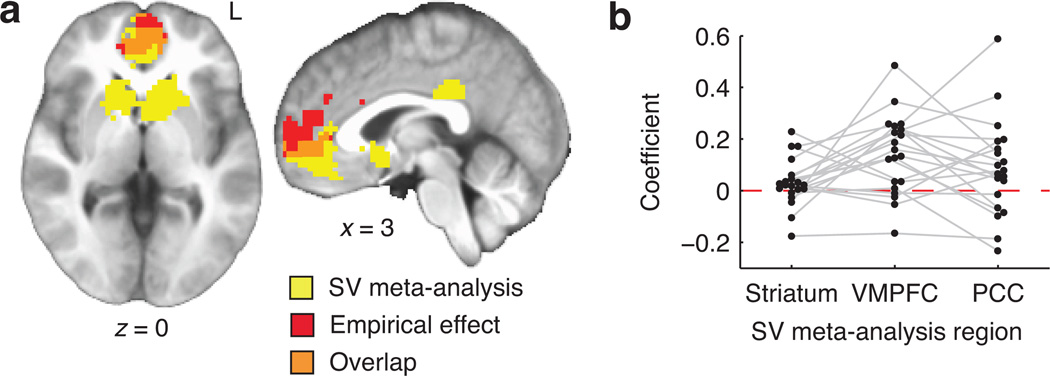
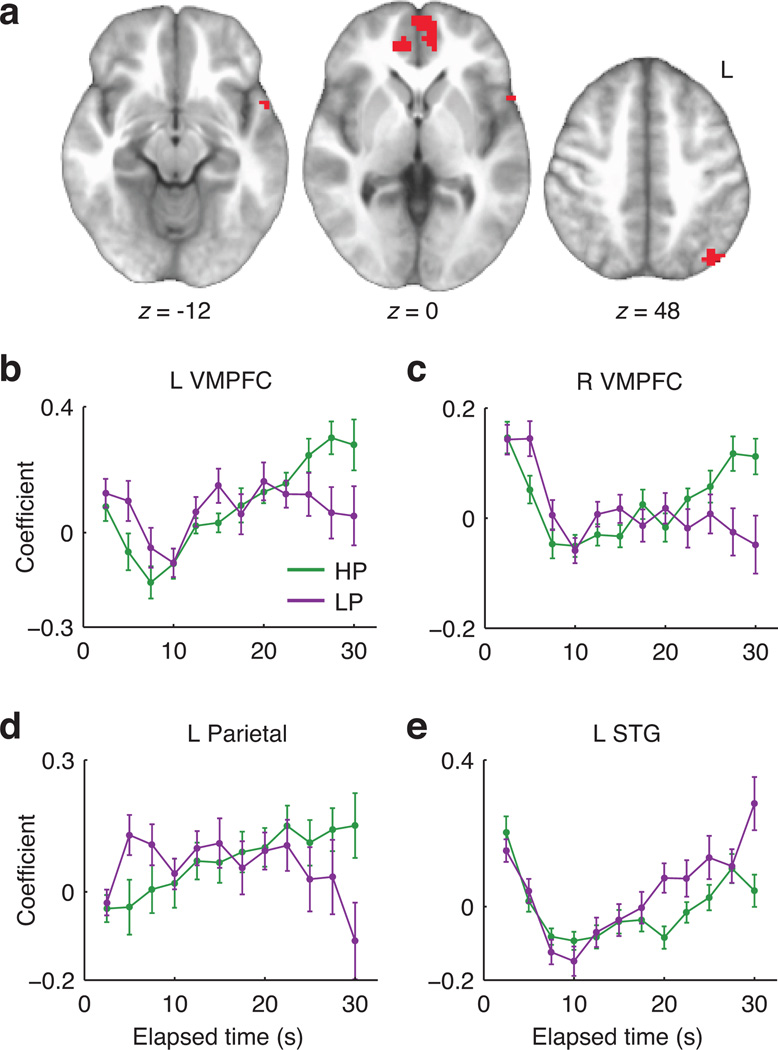
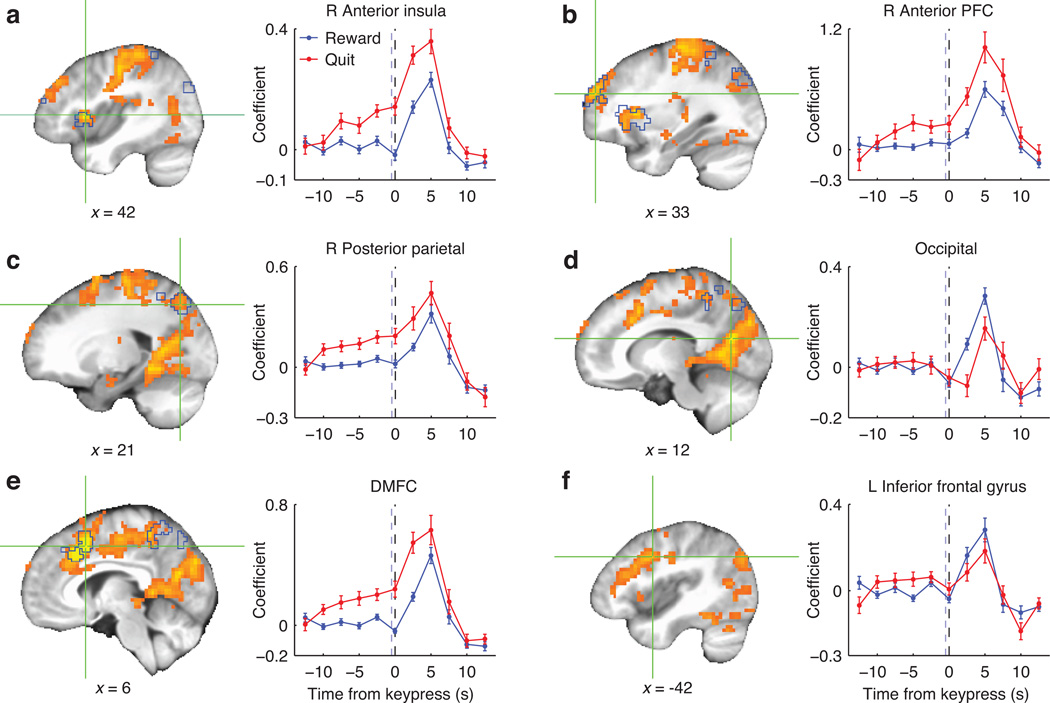
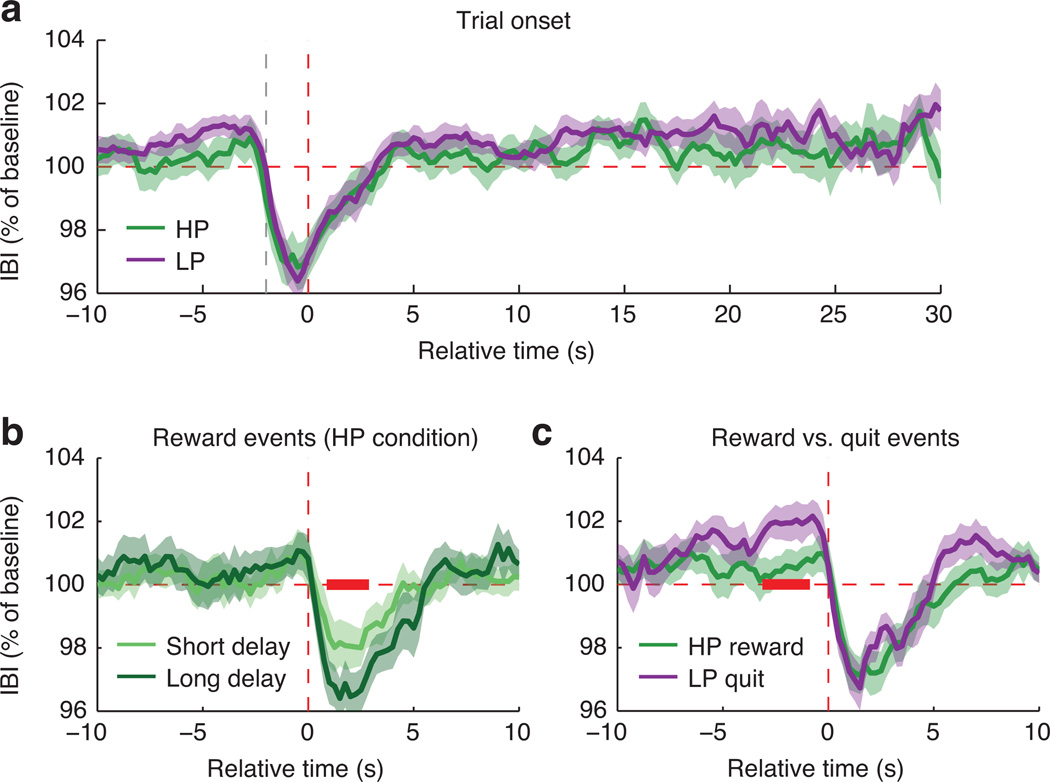
Deciding how long to keep waiting for future rewards is a nontrivial problem, especially when the timing of rewards is uncertain. We carried out an experiment in which human decision makers waited for rewards in two environments in which reward-timing statistics favored either a greater or lesser degree of behavioral persistence. We found that decision makers adaptively calibrated their level of persistence for each environment. Functional neuroimaging revealed signals that evolved differently during physically identical delays in the two environments, consistent with a dynamic and context-sensitive reappraisal of subjective value. This effect was observed in a region of ventromedial prefrontal cortex that is sensitive to subjective value in other contexts, demonstrating continuity between valuation mechanisms involved in discrete choice and in temporally extended decisions analogous to foraging. Our findings support a model in which voluntary persistence emerges from dynamic cost/benefit evaluation rather than from a control process that overrides valuation mechanisms.


Figures

Figure 1
Figure 1
Experimental task and timing conditions. A: Schematic of the willingness-to-wait task. B: Discrete probability distributions governing the scheduled delay times in each environment. C: Expected monetary rates of return under various waiting policies, where each policy is defined by a giving-up time. The reward-maximizing policy was to wait up to 40s in the HP environment (i.e., never to quit), but only up to 20s in the LP environment. These rates of return are contingent on the fixed 2s inter-trial interval (ITI).
Figure 2
Figure 2
Behavioral results. A: Survival curves reflecting the probability that a participant was still waiting at each elapsed time, provided that the reward had not yet been delivered. Empirical survival curves were averaged across subjects at 1 s intervals (+/− SEM). Ideal performance is plotted for reference (dashed lines). B: Area under the curve (AUC) values calculated from individual participants’ survival curves. The maximum possible value was 40s. Red point marks ideal performance. All 20 participants persisted more in the HP environment. C: Stem plots show the ground-truth hazard rate for reward in each environment: i.e., the probability of the reward arriving at each time, conditional on not having arrived already. Faded lines illustrate hypothetical continuous hazard functions incorporating endogenous temporal uncertainty (see Methods). D: Reward RT at each delay (median and IQR of subject-wise medians). RTs are expressed as deviations from each subject’s grand-median RT (median=475ms, IQR 450 to 506ms) to display within-subject effects. RTs for 5–20s delays did not differ between the environments (HP median=472ms, IQR 454 to 538; LP median=494ms, IQR 443 to 522).
Figure 3
Figure 3
Theoretical subjective value of the awaited token as a function of elapsed time in each environment. A: A token's subjective value increased over time in the HP environment but not in the LP environment. These timecourses are based on the discrete ground-truth timing distributions and would be smoothed by subjective temporal uncertainty. B: Simulated behavior from a model in which subjective value linearly influenced the log-odds of continuing to wait (mean +/− SEM of subject-wise model fits). Data from Fig. 2a are overlaid for reference. C: Subjective value timecourses convolved with a canonical hemodynamic response function (HRF). D: Predicted BOLD timecourses obtained by applying our fMRI analysis to idealized synthetic data (mean +/− SEM of individual subject results). Visual differences from Panel C reflect that (1) the HP and LP environments had independent baselines, and (2) there was a small degree of carryover across trials. In spite of these differences the theoretical difference timecourses (HP minus LP) were highly correlated between Panels C and D (median r2=0.88, IQR 0.84 to 0.89).
Figure 4
Figure 4
Model-based contrast results. A: Whole-brain analysis. Displayed in red is the VMPFC cluster that showed a significant relationship with the theoretical subjective value timecourses in Fig. 3d. In yellow, for reference, are regions identified in a previous meta-analysis of valuation effects (the regions reported in Fig. 3D of Bartra et al.). Overlap was observed in VMPFC, though not in PCC or striatum. B: Model-based contrast values for each participant, spatially averaged within meta-analytic ROIs. Subjective value effects were significantly positive in VMPFC, and significantly greater in VMPFC than striatum.
Figure 5
Figure 5
Model-free analysis of trial-onset-locked BOLD timecourses. A: Clusters showing a significant timepoint-by-environment interaction (Table 1b). B–E: Spatially averaged signal timecourses for significant clusters (mean +/− SEM), illustrating the form of the observed interactions. Although voxel selection effects would distort follow-up inferential tests of these timecourses, we descriptively summarized their resemblance to our theoretical predictions in terms of the correlation between the average theoretical (Fig. 3d) and observed HP-minus-LP difference timecourses. The resulting Pearson r values were 0.91, 0.89, 0.90, and −0.68 for the results in Panels B–E, respectively.
Figure 6
Figure 6
Regions in which BOLD signal differentiated reward-related and quit-related keypresses, assessed on the basis of the event type (reward vs. quit) by timepoint interaction. Warm colors represent F statistics for the analysis of full timecourses, and crosshairs mark local peaks. Blue outlines mark regions significant in the analysis of pre-quit timepoints only. Timecourses (mean +/− SEM) are plotted for a 6mm-radius (33-voxel) sphere centered at each depicted focus point. Black dashed lines mark the keypress time; blue dashed lines mark the median reward cue time (for reward-related keypresses).
Figure 7
Figure 7
Effects of task events on mean cardiac inter-beat interval (IBI; lower values correspond to faster heart rate). Error bands show SEM; red bands mark significant differences. A: Mean trial-onset-locked IBI timecourse in each condition. Vertical red dashed line marks trial onset; gray dashed line marks the preceding keypress. Each trial contributed data until 1 s before the trial ended (later timepoints therefore have fewer observations than earlier timepoints). No significant differences were observed. B: Comparison between rewards arriving at shorter (5–20s) vs. longer (25–40s) delays in the HP condition. The amplitude of post-keypress heart-rate acceleration was greater for rewards that followed longer delays (lag +1s to +2.75s; permutation-based p=0.018). C: Comparison between reward events in the HP condition and quit events in the LP condition, each restricted to trials with duration >10s. Vertical red dashed line marks the time of the reward cue or quit keypress. Results suggested transient cardiac deceleration prior to quit responses (lag −1s to −3s; permutation-based p=0.045).

References

    1. Mischel W, Ebbesen EB. Attention in delay of gratification. Journal of Personality and Social Psychology. 1970;16:329–337. - PubMed
    1. Baumeister RF, Vohs KD, Tice DM. The strength model of self-control. Current Directions in Psychological Science. 2007;16:351–355.
    1. Bartra O, McGuire JT, Kable JW. The valuation system: A coordinate-based meta-analysis of BOLD fMRI experiments examining neural correlates of subjective value. NeuroImage. 2013;76:412–427. - PMC - PubMed
    1. Clithero JA, Rangel A. Informatic parcellation of the network involved in the computation of subjective value. Social Cognitive and Affective Neuroscience. 2013 - PMC - PubMed
    1. Liu X, Hairston J, Schrier M, Fan J. Common and distinct networks underlying reward valence and processing stages: A meta-analysis of functional neuroimaging studies. Neuroscience and Biobehavioral Reviews. 2011;35:1219–1236. - PMC - PubMed

Publication types

LinkOut - more resources