

Powerful regulatory systems and post-transcriptional gene silencing resist increases in cellulose content in cell walls of barley
- PMID: 25850007
- PMCID: PMC4349714
- DOI: 10.1186/s12870-015-0448-y
Powerful regulatory systems and post-transcriptional gene silencing resist increases in cellulose content in cell walls of barley
Abstract
Background: The ability to increase cellulose content and improve the stem strength of cereals could have beneficial applications in stem lodging and producing crops with higher cellulose content for biofuel feedstocks. Here, such potential is explored in the commercially important crop barley through the manipulation of cellulose synthase genes (CesA).
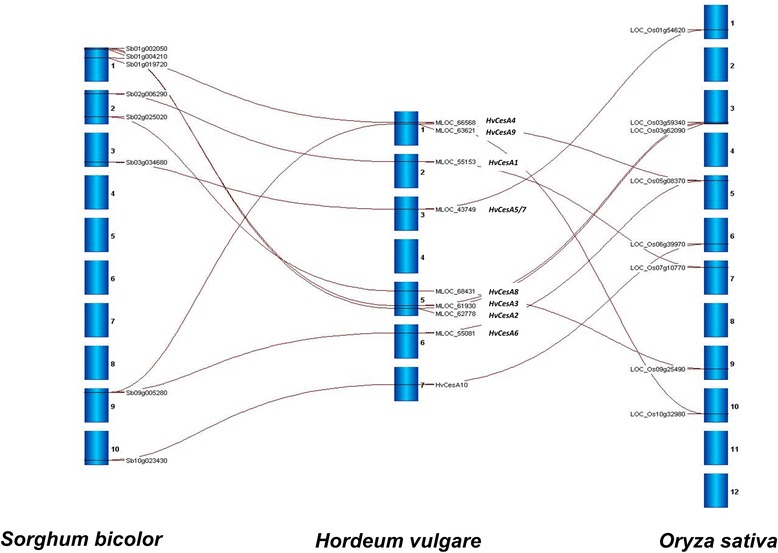
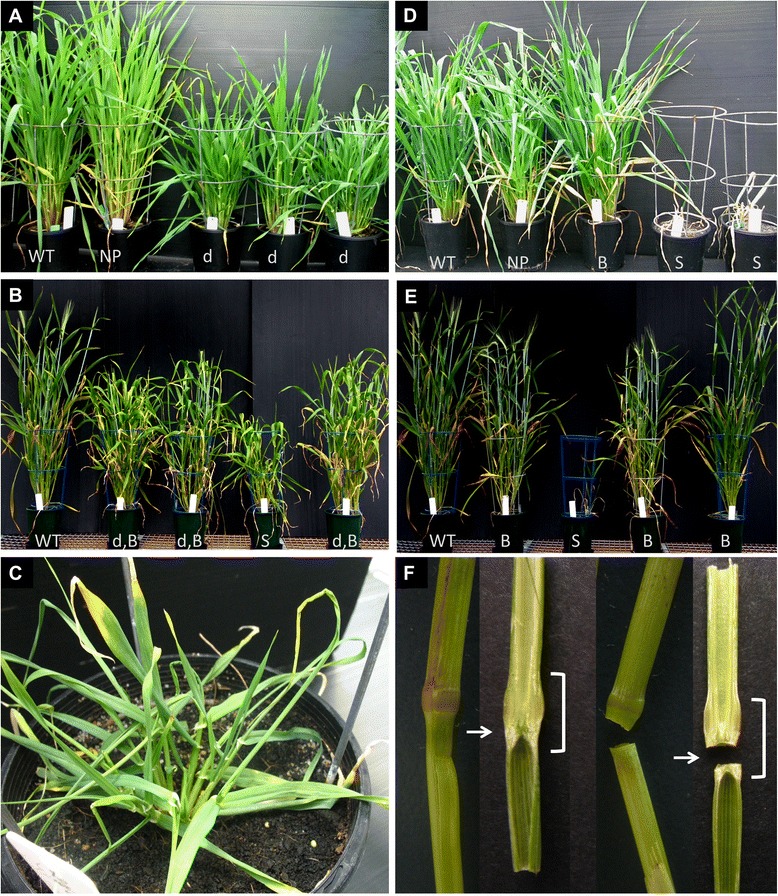
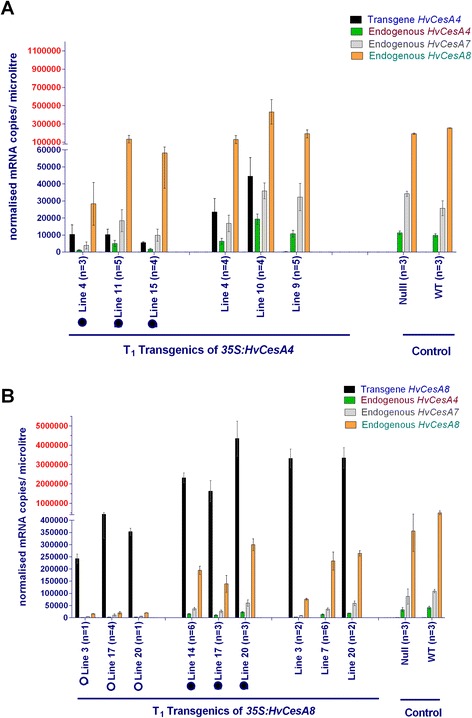
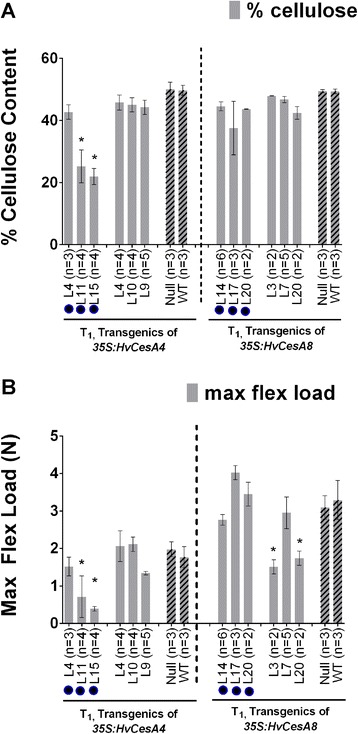
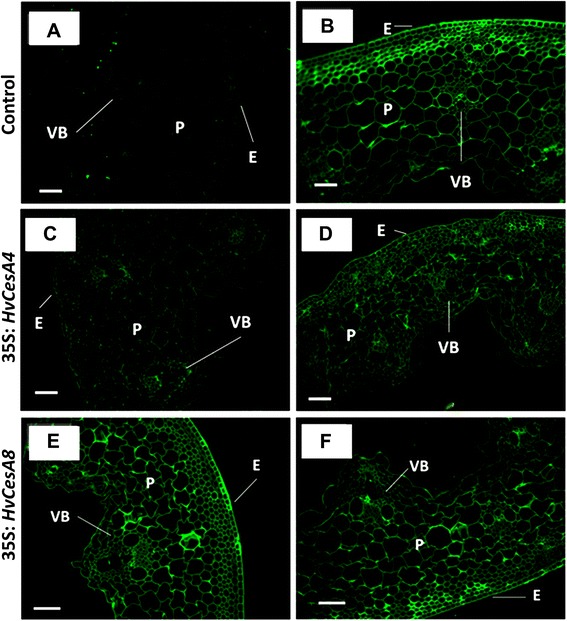
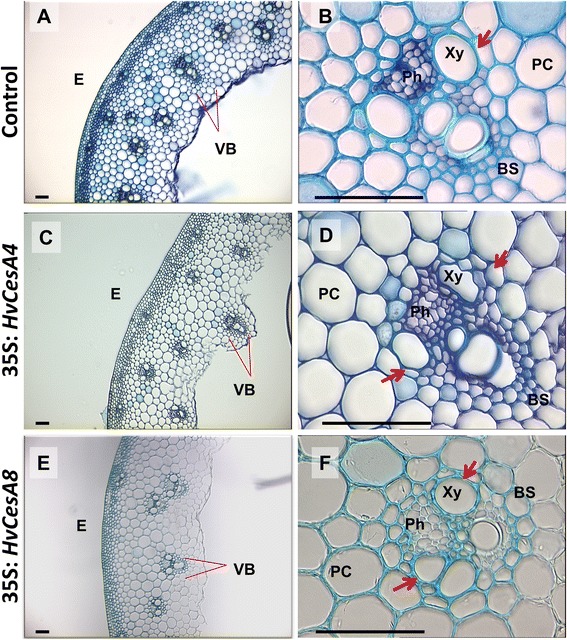
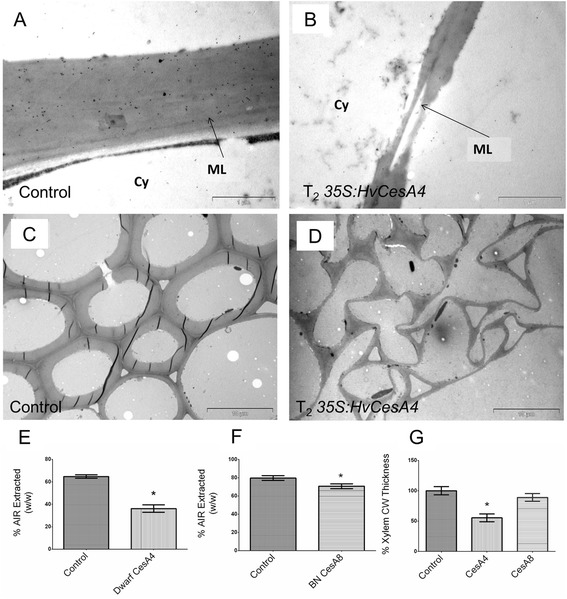
Results: Barley plants transformed with primary cell wall (PCW) and secondary cell wall (SCW) barley cellulose synthase (HvCesA) cDNAs driven by the CaMV 35S promoter, were analysed for growth and morphology, transcript levels, cellulose content, stem strength, tissue morphology and crystalline cellulose distribution. Transcript levels of the PCW HvCesA transgenes were much lower than expected and silencing of both the endogenous CesA genes and introduced transgenes was often observed. These plants showed no aberrant phenotypes. Although attempts to over-express the SCW HvCesA genes also resulted in silencing of the transgenes and endogenous SCW HvCesA genes, aberrant phenotypes were sometimes observed. These included brittle nodes and, with the 35S:HvCesA4 construct, a more severe dwarfing phenotype, where xylem cells were irregular in shape and partially collapsed. Reductions in cellulose content were also observed in the dwarf plants and transmission electron microscopy showed a significant decrease in cell wall thickness. However, there were no increases in overall crystalline cellulose content or stem strength in the CesA over-expression transgenic plants, despite the use of a powerful constitutive promoter.
Conclusions: The results indicate that the cellulose biosynthetic pathway is tightly regulated, that individual CesA proteins may play different roles in the synthase complex, and that the sensitivity to CesA gene manipulation observed here suggests that in planta engineering of cellulose levels is likely to require more sophisticated strategies.
Figures
Similar articles
-
Overexpression of PnMYB2 from Panax notoginseng induces cellulose and lignin biosynthesis during cell wall formation.Planta. 2022 Apr 21;255(5):107. doi: 10.1007/s00425-022-03891-6. Planta. 2022. PMID: 35445881
-
The CesA gene family of barley. Quantitative analysis of transcripts reveals two groups of co-expressed genes.Plant Physiol. 2004 Jan;134(1):224-36. doi: 10.1104/pp.103.032904. Epub 2003 Dec 30. Plant Physiol. 2004. PMID: 14701917 Free PMC article.
-
Over-expression of specific HvCslF cellulose synthase-like genes in transgenic barley increases the levels of cell wall (1,3;1,4)-β-d-glucans and alters their fine structure.Plant Biotechnol J. 2011 Feb;9(2):117-35. doi: 10.1111/j.1467-7652.2010.00532.x. Plant Biotechnol J. 2011. PMID: 20497371
-
Modifying crops to increase cell wall digestibility.Plant Sci. 2012 Apr;185-186:65-77. doi: 10.1016/j.plantsci.2011.10.014. Epub 2011 Oct 25. Plant Sci. 2012. PMID: 22325867 Review.
-
A review of xylan and lignin biosynthesis: foundation for studying Arabidopsis irregular xylem mutants with pleiotropic phenotypes.Crit Rev Biochem Mol Biol. 2014 May-Jun;49(3):212-41. doi: 10.3109/10409238.2014.889651. Epub 2014 Feb 24. Crit Rev Biochem Mol Biol. 2014. PMID: 24564339 Review.
Cited by
-
Expression of Exogenous GFP-CesA6 in Tobacco Enhances Cell Wall Biosynthesis and Biomass Production.Biology (Basel). 2022 Jul 29;11(8):1139. doi: 10.3390/biology11081139. Biology (Basel). 2022. PMID: 36009766 Free PMC article.
-
Sudangrass, an alternative lignocellulosic feedstock for bioenergy in Argentina.PLoS One. 2019 May 23;14(5):e0217435. doi: 10.1371/journal.pone.0217435. eCollection 2019. PLoS One. 2019. PMID: 31120985 Free PMC article.
-
Engineering grass biomass for sustainable and enhanced bioethanol production.Planta. 2019 Aug;250(2):395-412. doi: 10.1007/s00425-019-03218-y. Epub 2019 Jun 24. Planta. 2019. PMID: 31236698 Review.
-
Dwarfs standing tall: breeding towards the 'Yellow revolution' through insights into plant height regulation.Plant Mol Biol. 2025 Feb 19;115(2):34. doi: 10.1007/s11103-025-01565-x. Plant Mol Biol. 2025. PMID: 39971832 Free PMC article. Review.
-
CRISPR/Cas9-mediated P-CR domain-specific engineering of CESA4 heterodimerization capacity alters cell wall architecture and improves saccharification efficiency in poplar.Plant Biotechnol J. 2022 Jun;20(6):1197-1212. doi: 10.1111/pbi.13803. Epub 2022 Mar 15. Plant Biotechnol J. 2022. PMID: 35266285 Free PMC article.
References
-
- Berry PM, Sterling M, Mooney SJ. Development of a model of lodging for barley. J Agron Crop Sci. 2006;192(2):151–8. doi: 10.1111/j.1439-037X.2006.00194.x. - DOI
-
- Berry PM, Sterling M, Spink JH, Baker CJ, Sylvester-Bradley R, Mooney SJ, Tams AR, Ennos AR. Understanding and reducing lodging in cereals. Adv Agronomy. 2004;84:217–71. doi: 10.1016/S0065-2113(04)84005-7. - DOI
MeSH terms
Substances
LinkOut - more resources
Full Text Sources
Other Literature Sources
