. 2015 Jul;64(7):817-29.
doi: 10.1007/s00262-015-1692-6. Epub 2015 Apr 8.

Liver myeloid-derived suppressor cells expand in response to liver metastases in mice and inhibit the anti-tumor efficacy of anti-CEA CAR-T

Affiliations

Liver myeloid-derived suppressor cells expand in response to liver metastases in mice and inhibit the anti-tumor efficacy of anti-CEA CAR-T

Rachel A Burga et al. Cancer Immunol Immunother. 2015 Jul.

Abstract

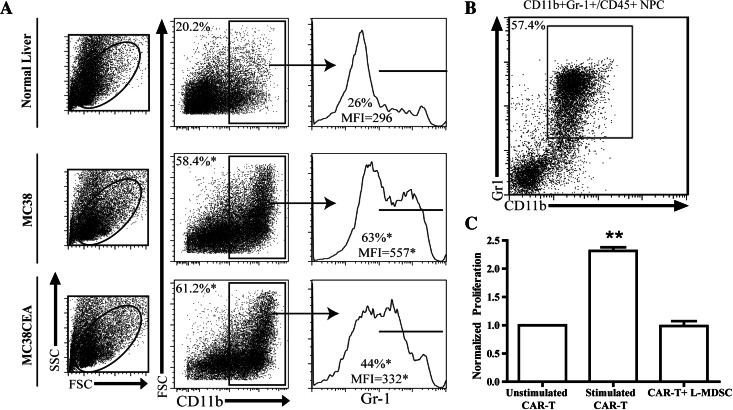
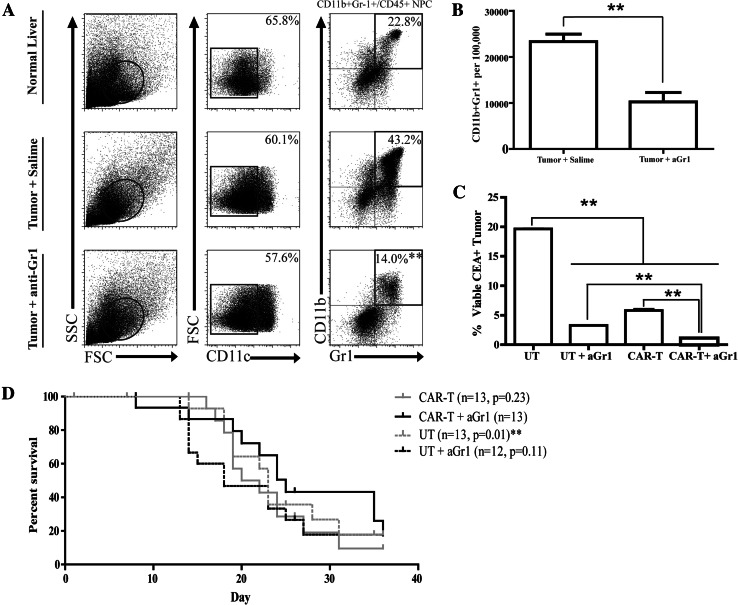
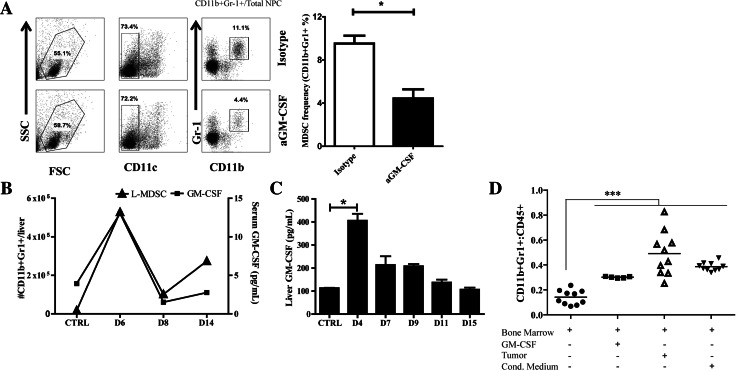
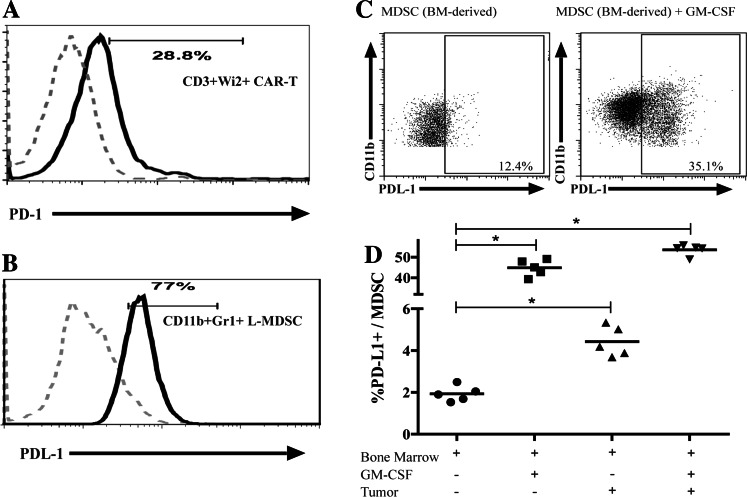
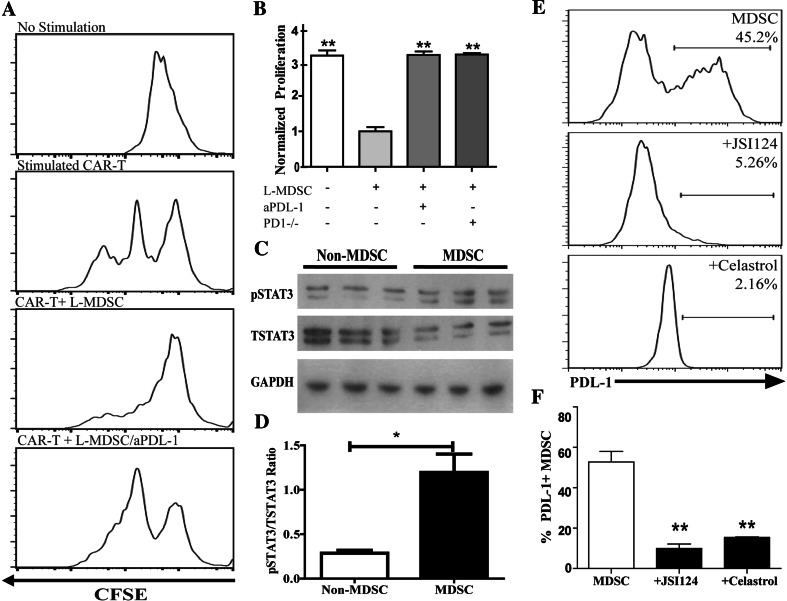
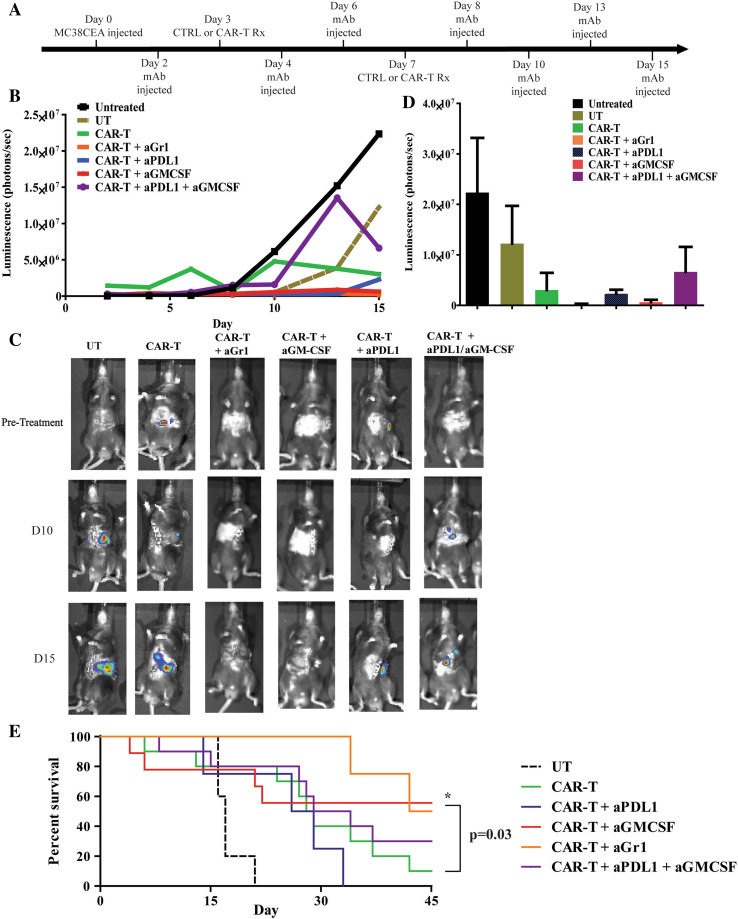
Chimeric antigen receptor-modified T cell (CAR-T) technology, a promising immunotherapeutic tool, has not been applied specifically to treat liver metastases (LM). While CAR-T delivery to LM can be optimized by regional intrahepatic infusion, we propose that liver CD11b+Gr-1+ myeloid-derived suppressor cells (L-MDSC) will inhibit the efficacy of CAR-T in the intrahepatic space. We studied anti-CEA CAR-T in a murine model of CEA+ LM and identified mechanisms through which L-MDSC expand and inhibit CAR-T function. We established CEA+ LM in mice and studied purified L-MDSC and responses to treatment with intrahepatic anti-CEA CAR-T infusions. L-MDSC expanded threefold in response to LM, and their expansion was dependent on GM-CSF, which was produced by tumor cells. L-MDSC utilized PD-L1 to suppress anti-tumor responses through engagement of PD-1 on CAR-T. GM-CSF, in cooperation with STAT3, promoted L-MDSC PD-L1 expression. CAR-T efficacy was rescued when mice received CAR-T in combination with MDSC depletion, GM-CSF neutralization to prevent MDSC expansion, or PD-L1 blockade. As L-MDSC suppressed anti-CEA CAR-T, infusion of anti-CEA CAR-T in tandem with agents targeting L-MDSC is a rational strategy for future clinical trials.


Conflict of interest statement

The authors have no conflict of interest to disclose.

Figures

Fig. 1
Fig. 1
L-MDSC expand in response to LM and suppress CAR-T. LM were established by splenic injections of either MC38 or MC38CEA tumor cells, and livers were harvested 2 weeks of tumor growth. Flow cytometry was used to evaluate the expansion of L-MDSC in response to LM. a Sequential gating of L-MDSC as live, CD11b+, and Gr-1+ liver leukocytes from normal or tumor-bearing livers. Cells were enriched by immunomagnetic beading for CD45+ NPC prior to staining. b Dot plot confirming high level of Gr-1 and CD11b co-expression among liver leukocytes. c L-MDSC were co-cultured with CFSE-labeled anti-CEA CAR-T stimulated by irradiated MC38CEA cells, and pooled results from three independent experiments are graphed. The percentages of cells having undergone division (CFSE-low) were normalized to the unstimulated group. Bar graphs represent mean ± SEM; dot plots and histograms are representative of ≥3 mice per group and have been confirmed with at least two separate experiments (*p ≤ 0.05, **p ≤ 0.01)
Fig. 2
Fig. 2
L-MDSC depletion improves CAR-T efficacy. LM were established by splenic injections of MC38CEA cells, and saline or anti-Gr-1 antibody was injected intraperitoneally on days 7 and 11 post-tumor establishment. Livers were harvested for NPC isolation, staining, and analysis after 14 days. a Flow cytometry dot plots of the L-MDSC (live, CD11c−CD11b+Gr-1+) population with or without anti-Gr-1 treatment. Cells were enriched by immunomagnetic beading for CD45+ NPC prior to staining. b Absolute L-MDSC numbers per 100,000 cells in liver isolate were calculated according to cell counts. c Mice with established LM received infusions of UT or CAR-T after 7 days, in addition to anti-Gr-1 (aGr-1) treatment in designated groups on days 7 and 11. Flow cytometry was used to determine the percentages of viable CEA+ tumor cells among all liver NPC after killing at day 26. d Survival curves for in vivo examination of ≥12 animals with LM treated with UT or CAR-T with and without Gr-1-antibody. Bar graphs represent mean ± SEM; dot plots are representative samples, survival significance displayed as relative to CAR-T+aGr-1 group (**p ≤ 0.01)
Fig. 3
Fig. 3
L-MDSC expansion is driven by tumor-associated GM-CSF. LM were established by splenic injections of MC38CEA cells, and isotype control (IgG) or anti-GM-CSF antibody (aGM-CSF) was injected intraperitoneally on days 4, 6, and 8 post-tumor establishment. a Flow cytometry was used following harvest after 9 days to evaluate MDSC frequency (live, CD11b+Gr-1+ cells) (right, representative of three independent experiments). For this experiment, MDSC percentage values reflect analysis of bulk NPC not subjected to fractionation based on CD45 expression. b Serum GM-CSF and L-MDSC absolute numbers as determined by flow cytometry were quantified from mice at various time points post-LM establishment or CTRL (non-tumor bearing). c Whole liver lysate GM-CSF was measured from mice following LM establishment or CTRL animals. d The percentage of cells acquiring an MDSC phenotype (CD11b+Gr-1+) was determined by flow cytometry from bone marrow cells cultured for 3–4 days with exposure to recombinant GM-CSF, GM-CSF-producing MC38CEA tumor, or tumor-conditioned medium. Bar graphs represent mean ± SEM; dots plots are representative of ≥3 mice per group and have been confirmed with ≥2 separate experiments (*p ≤ 0.05, ***p ≤ 0.001)
Fig. 4
Fig. 4
L-MDSC suppression through PD-1/PD-L1 is modulated by GM-CSF. a Flow cytometry was used to determine PD-1 expression on fresh CAR-T (CAR-T gated as CD3+Wi2+ cells) relative to FMO controls. b Flow cytometry was used to determine PD-L1 expression on L-MDSC (gated CD11c−CD11b+Gr-1+) isolated from tumor-bearing mice after 2 weeks of tumor growth relative to FMO controls. c Representative dot plots indicating PD-L1 expression as determined from BM-derived MDSC (gated as live, CD45+CD11c−CD11b+Gr-1+ cells) following exposure to recombinant GM-CSF or GM-CSF-producing tumor ex vivo. d Pooled results from two independent experiments are graphed. Bar graphs represent mean ± SEM; dot plots and histograms are representative of ≥3 mice per group and have been confirmed with ≥2 separate experiments (*p ≤ 0.05)
Fig. 5
Fig. 5
L-MDSC suppress CAR-T through STAT3-dependent PD-L1 expression. a Representative CFSE histograms that demonstrate CAR-T proliferation (second panel) were suppressed by L-MDSC (third panel) and rescued by the addition of anti-PD-L1 antibody (aPD-L1). b Pooled results from three independent experiments are graphed, with proliferation normalized to that of the minimal proliferation value. The percentage of proliferating CAR-T was calculated based upon CFSE-low cells. c Phosphorylated STAT3 (pSTAT3) and total STAT3 (TSTAT3) expression levels in MDSC (CD11b+NPC) and non-MDSC (CD11b-fraction) from tumor-bearing livers were assayed by Western blot. d pSTAT3 to TSTAT3 ratio obtained from the Western blot analysis was calculated for MDSC and non-MDSC. e Flow cytometry was used to determine PD-L1 expression on L-MDSC following ex vivo culture with the STAT3 inhibitors JSI-124 and celastrol. f Pooled results from four independent experiments are graphed. Bar graphs represent mean ± SEM; dot plots and histograms are representative of ≥3 mice per group and have been confirmed with ≥3 separate experiments. Normalized proliferation = experimental %proliferation/%proliferation of CAR-T+MDSC (**p ≤ 0.01, ***p ≤ 0.001)
Fig. 6
Fig. 6
Neutralization of GM-CSF and PD-L1 improves regional anti-CEA CAR-T efficacy. a Mice were injected with luciferase-expressing MC38CEA cells to establish LM and received treatments as indicated in addition to daily systemic IL2 support. b Mice were injected with luciferin and imaged for 15 days to evaluate tumor progression expressed as bioluminescence (photon/s). c Representative images of tumor burden at indicated time points. d Bar graphs indicate quantified tumor bioluminescence presented at day 15 following LM establishment. Groups were untreated (n = 3), untransduced (UT, n = 5), CAR-T (n = 11), CAR-T+aGr-1 (n = 10), CAR-T+aPD-L1 (n = 5), CAR-T+aGM-CSF (n = 10), CAR-T+aPD-L1+aGM-CSF (n = 11). e Survival of the animals treated with antibodies was tracked for up to 45 days after tumor injections. Kaplan–Meier curves were constructed and groups compared with the log-rank test. CAR-T+anti-GM-CSF treatment was significantly higher than CAR-T alone (*p = 0.03)

References

    1. Donadon M, Ribero D, Morris-Stiff G, Abdalla EK, Vauthey JN. New paradigm in the management of liver-only metastases from colorectal cancer. Gastrointest Cancer Res. 2007;1(1):20–27. - PMC - PubMed
    1. Tomlinson JS, Jarnagin WR, DeMatteo RP, Fong Y, Kornprat P, Gonen M, Kemeny N, Brennan MF, Blumgart LH, D’Angelica M. Actual 10-year survival after resection of colorectal liver metastases defines cure. J Clin Oncol. 2007;25(29):4575–4580. doi: 10.1200/JCO.2007.11.0833. - DOI - PubMed
    1. Grothey A, Sargent D. Overall survival of patients with advanced colorectal cancer correlates with availability of fluorouracil, irinotecan, and oxaliplatin regardless of whether doublet or single-agent therapy is used first line. J Clin Oncol. 2005;23(36):9441–9442. doi: 10.1200/JCO.2005.04.4792. - DOI - PubMed
    1. Rothenberg ML, Oza AM, Bigelow RH, Berlin JD, Marshall JL, Ramanathan RK, Hart LL, Gupta S, Garay CA, Burger BG, Le Bail N, Haller DG. Superiority of oxaliplatin and fluorouracil-leucovorin compared with either therapy alone in patients with progressive colorectal cancer after irinotecan and fluorouracil-leucovorin: interim results of a phase III trial. J Clin Oncol. 2003;21(11):2059–2069. doi: 10.1200/JCO.2003.11.126. - DOI - PubMed
    1. Katz SC, Pillarisetty V, Bamboat ZM, Shia J, Hedvat C, Gonen M, Jarnagin W, Fong Y, Blumgart L, D’Angelica M, DeMatteo RP. T cell infiltrate predicts long-term survival following resection of colorectal cancer liver metastases. Ann Surg Oncol. 2009;16(9):2524–2530. doi: 10.1245/s10434-009-0585-3. - DOI - PubMed

Publication types

MeSH terms

Substances