. 2015 Nov;8(6):1324-38.
doi: 10.1038/mi.2015.22. Epub 2015 Apr 8.

Epithelial-specific A2B adenosine receptor signaling protects the colonic epithelial barrier during acute colitis

Affiliations

Epithelial-specific A2B adenosine receptor signaling protects the colonic epithelial barrier during acute colitis

C M Aherne et al. Mucosal Immunol. 2015 Nov.

Erratum in

Abstract

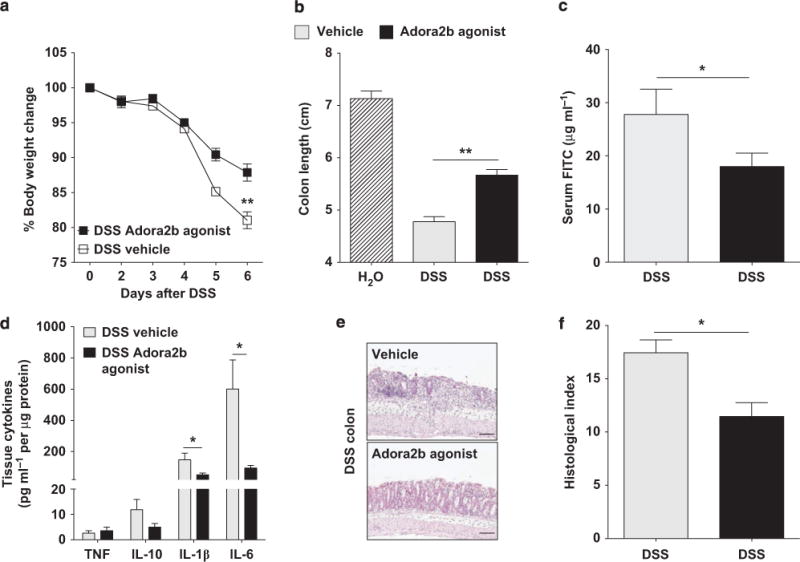
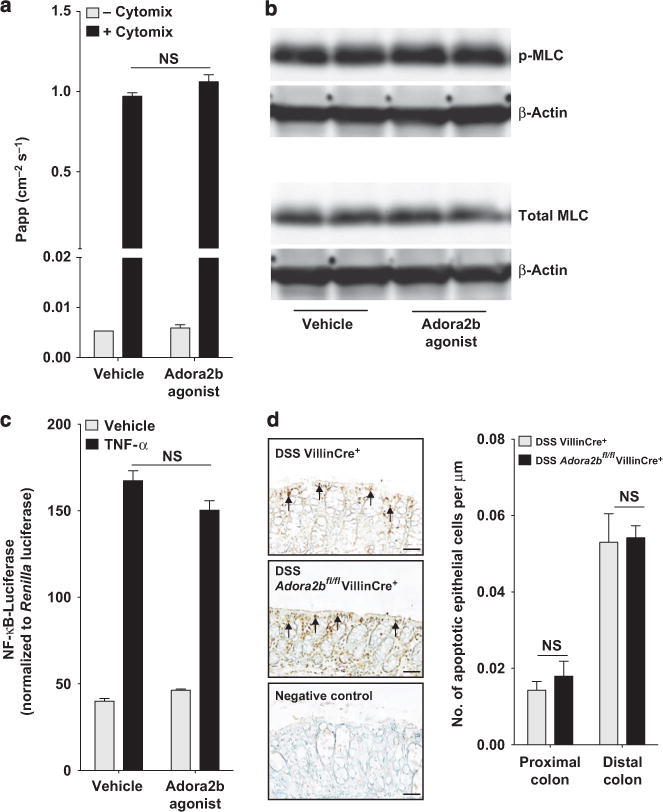
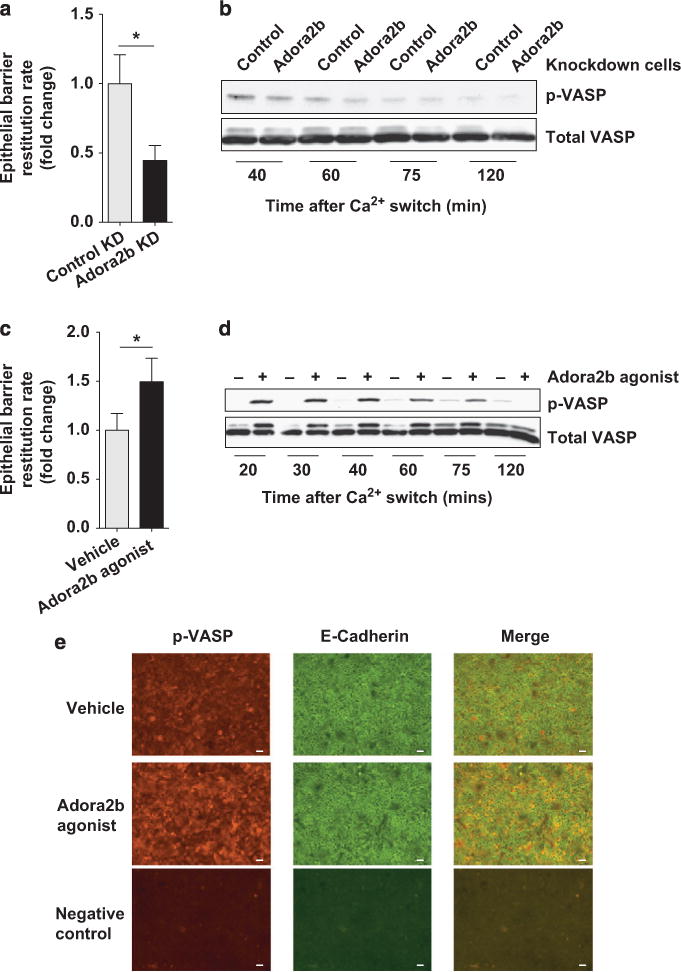
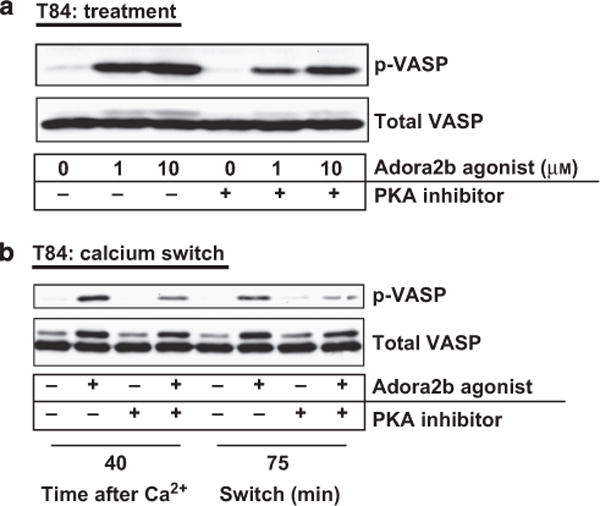
Central to inflammatory bowel disease (IBD) pathogenesis is loss of mucosal barrier function. Emerging evidence implicates extracellular adenosine signaling in attenuating mucosal inflammation. We hypothesized that adenosine-mediated protection from intestinal barrier dysfunction involves tissue-specific signaling through the A2B adenosine receptor (Adora2b) at the intestinal mucosal surface. To address this hypothesis, we combined pharmacologic studies and studies in mice with global or tissue-specific deletion of the Adora2b receptor. Adora2b(-/-) mice experienced a significantly heightened severity of colitis, associated with a more acute onset of disease and loss of intestinal epithelial barrier function. Comparison of mice with Adora2b deletion on vascular endothelial cells (Adora2b(fl/fl)VeCadCre(+)) or intestinal epithelia (Adora2b(fl/fl)VillinCre(+)) revealed a selective role for epithelial Adora2b signaling in attenuating colonic inflammation. In vitro studies with Adora2b knockdown in intestinal epithelial cultures or pharmacologic studies highlighted Adora2b-driven phosphorylation of vasodilator-stimulated phosphoprotein (VASP) as a specific barrier repair response. Similarly, in vivo studies in genetic mouse models or treatment studies with an Adora2b agonist (BAY 60-6583) recapitulate these findings. Taken together, our results suggest that intestinal epithelial Adora2b signaling provides protection during intestinal inflammation via enhancing mucosal barrier responses.


Conflict of interest statement

DISCLOSURE

The authors declare no conflict of interest.

Figures

Figure 1
Figure 1
Adora2b (A2B adenosine receptor)-deficient mice experience early onset of acute colitis. Gender-, age-, and weight-matched Adora2b-deficient mice (Adora2b−/−) or C57BL/6 wild-type controls (Adora2b+/+) were exposed to dextran sulfate sodium (DSS) (3–3.5%) over a time course of 7 days. (a) Daily weight measurements were obtained for each group of mice. (b) Following killing, colons were harvested and measured. Results are representative of one to two independent experiments with n 4–13 mice per group. (c) Mice were administered FITC (fluorescein isothiocyanate)-dextran by oral gavage (0.6 mg g−1 at 80 mg ml−1) 4 h before= killing. Serum was harvested at killing (days 1 and 3 after DSS) and fluoresence measurement was used to determine FITC levels; n = 2–9 mice per group from one independent experiment per time point. (d) Following colon harvest at day 7 after DSS, colonic lamina propria leukocytes were isolated and flow cytometry determined the frequency of GR-1+ (neutrophils), SiglecF+ (eosinophils), F4/80+ (macrophages), and MHCII+CD11cHi (dendritic cells) cells. Actual cell number for each cell type was calculated based on the frequency of cell type multiplied by cell counts following organ harvest. Results are representative of one independent experiment with n = 3–4 mice per group. (e) Representative histological sections from whole colon of Adora2b−/− or Adora2b+/+ mice harvested following 7 days DSS. Bar = 100 μm; images acquired at original magnification ×10. (f) Blinded histological analysis of whole colon from each group following DSS. Data represent 8–10 mice per group. Unless stated otherwise, results are representative of two independent experiments with 3–10 mice per group and are displayed as mean±s.e.m. Two-way analysis of variance (ANOVA) with post hoc Bonferroni t-test was used to determine statistical weight change, but in all other cases Student’s t-test was used. *P<0.5; **P<0.001; ***P<0.0001.
Figure 2
Figure 2
Adora2b (A2B adenosine receptor) in the vascular endothelium does not contribute to DSS (dextran sulfate sodium) colitis disease activity. Mice with vascular endothelial specific deletion of Adora2b (Adora2bfl/flVeCadCre+) were generated and exposed to water or DSS (3%) along with their wild-type Cre controls (VeCadCre+). Following 7 days, mice were killed and the whole colon harvested by blunt dissection. (a) Daily weight measurements were taken for each group. (b) Upon harvest colon length was measured. (c) Representative whole colonic histological sections are displayed. Bar = 100 μm; images acquired at original magnification ×10. (d) Blinded histological analysis of whole colon from each group following DSS. Results are representative of 7–8 mice per DSS group and 2 mice per water group, and are displayed as mean±s.e.m.
Figure 3
Figure 3
Epithelial-specific deletion of the Adora2b (A2B adenosine receptor) receptor results in significantly increased susceptibility to acute colitis. Mice with intestinal epithelial specific deletion of Adora2b (Adora2bfl/flVillinCre+) were generated and exposed to water or DSS (dextran sulfate sodium, 3–3.5%) along with their wild-type Cre controls (VillinCre+). Mice were killed at 3, 4, and 7 days after DSS, and colons harvested by blunt dissection. (a) Daily weight measurements were assessed for each group of mice. (b) Following harvest at day 3, 4, or 7 colon lengths were measured. Results are representative of one to two independent experiments per time point with 4–18 mice per group. (c) On day 4 after DSS, FITC (fluorescein isothiocyanate)-dextran was administered by oral gavage (0.6 mg g−1 at 80 mg ml−1) 4 h before killing and serum collection. Fluorescence measurement was used to determine FITC levels; n = 3–8 mice per group from one experiment. (d) Following harvest at day 7 after DSS, colon tissue was homogenized and tissue cytokines were measured by Meso Scale (Meso Scale Discovery, Rockville, MD). Results are displayed normalized to protein content and are representative of 4–6 mice per group. (e) Representative histological sections from distal colon of Adora2bfl/flVillinCre+ or VillinCre+ mice harvested following 7 days DSS. Bar = 100 μm; images are acquired at original magnification ×10. (f) Bar graph of blinded histological scoring of the distal colon following 7 days of DSS; n = 7–10 mice per group. Unless stated otherwise, results are representative of two to three independent experiments with 4–10 mice per DSS group and are displayed as mean±s.e.m. Two-way analysis of variance (ANOVA) with post hoc Bonferroni t-test was used to determine statistical weight change, but in all other cases Student’s t-test was used. *P<0.05.
Figure 4
Figure 4
Treatment with an Adora2b (A2B adenosine receptor) agonist mediates mucosal protection observed in a model of acute colitis. Gender-, age-, and weight-matched C57BL/6 mice were treated with an Adora2b-specific agonist (BAY 60-6583; 1.2–1.25 mg kg−1 per day) or vehicle (30% Solutol HS15 in 0.9% saline) using a subcutaneous osmotic pump beginning 1 day before administration of DSS (dextran sulfate sodium, 3.5–4%) for 6 days. Mice exposed to DSS were orally gavaged with FITC (fluorescein isothiocyanate)-dextran (0.6 mg g−1 at 80 mg ml−1) 4 h before killing on day 6, serum collection, and blunt dissection of the colon. (a) Daily weight measurements were obtained for each group of mice. (b) Colon lengths were measured upon harvest. (c) Fluorescence measurement determined FITC levels in the serum on day 6 after DSS. (d) Following harvest, cytokines in colonic tissue were measured by Meso Scale. Results are displayed normalized to protein content and represent 4–5 mice per group. (e) Representative colonic histological images from vehicle and Adora2b agonist-treated mice exposed to DSS. Bar = 100 μm; images were acquired at original magnification ×10. (f) Bar graph of blinded histological scoring of the distal colon from vehicle and Adora2b agonist-treated mice exposed to DSS. Results are displayed as mean±s.e.m. and are representative of one to two independent experiments with 3–7 mice per group. Two-way analysis of variance (ANOVA) with post hoc Bonferroni t-test was used to determine statistical weight change, but in all other cases Student’s t-test was used. *P<0.5; **P<0.001.
Figure 5
Figure 5
Epithelial Adora2b (A2B adenosine receptor) signaling does not affect epithelial barrier breakdown. (a) A combination of tumor necrosis factor-α (TNFα), interleukin-1β (IL-1β), and interferon γ (IFNγ) (all 10 ng ml−1) or media alone was added to the basolateral aspect of polarized T84 intestinal epithelial cells. Vehicle or the Adora2b agonist (BAY 60-6583; 10 μM) was added to both chambers. Following 72 h, FITC (fluorescein isothiocyanate)-labeled dextran (3 kDa) was added to the apical chamber and a flux assay was performed. The permeability of the monolayer was assessed by measuring the concentration of FITC in the basolateral chamber over time, calculated as the apparent permeability (Papp: cm−2 s−1). Results are representative of three independent experiments with 2–4 wells per group. (b) Confluent T84 intestinal epithelial cells were treated on the basolateral and apical aspect with vehicle or Adora2b-specific agonist (BAY 60-6583; 10 μM) for 30 min before cell harvest and total protein extraction. p-MLC (myosin light chain) (Ser19), total MLC, and β-actin levels were determined by Western blot analysis. Results are representative of three independent experiments with 2–3 wells per experiment. (c) Caco-2 intestinal epithelial cells were transfected with an equal amount of a nuclear factor-κB (NF-κB)-responsive promoter attached to a firefly luciferase reporter (NF-κB-luciferase) and a control reporter vector (Renilla luciferase). Cells were treated in triplicate for 6 h with tumor necrosis factor-α (TNF-α) (10 ng ml−1) and the Adora2b agonist (BAY 60-6583; 10 μM). Equal volumes of cell lysate were assayed for luciferase activity. Data were normalized to Renilla luciferase and are representative of three independent experiments. (d) Mice with intestinal epithelial specific deletion of Adora2b (Adora2bfl/flVillinCre+) were exposed to water or DSS (dextran sulfate sodium, 3%) along with their wild-type Cre controls (VillinCre+) for 4 days and colons harvested by blunt dissection. Representative images are displayed of apoptotic colonic epithelial cells identified by TUNEL (terminal deoxynucleotidyl transferase-mediated deoxyuridine triphosphate nick end labeling) staining of paraffin-embedded colonic sections. Arrows point to positively stained cells. Bar = 50 μm; images were acquired at original magnification ×20. Terminal deoxynucleotidyl transferase was omitted as a negative control. Bar graph of the number of apoptotic colonic epithelial cells in the proximal or distal colon of each group of mice. The number is displayed relative to the length of basement membrane. Scoring was carried out in a blinded manner in three randomly selected mice per group of 6, with a total of six to eight sections per mouse. All results are displayed as the mean±s.e.m. Statistical analysis was performed using the Student’s t-test.
Figure 6
Figure 6
Epithelial Adora2b (A2B adenosine receptor) promotes barrier restitution in intestinal epithelial cells. Calcium switch assays were performed using intestinal epithelial cells with a fully competent barrier. Cells were placed in calcium-depleting conditions until barrier function was fully compromised and subsequently allowed to recover in calcium complete media for the time points outlined. (a) Barrier recovery studies were performed with T84 intestinal epithelial cells with constitutive Adora2b knockdown (Adora2b KD) or nonspecific gene KD (control KD) as mentioned. FITC (fluorescein isothiocyanate)-labeled dextran (10 kDa) was added to the apical aspect of the cells at the start of the recovery period. Media from the basolateral aspect were sampled every 15 min for 105 min and fluorescence in the media at each point was measured to analyze rate of barrier restitution. Results are displayed as fold change in the rate of restitution and represent two independent experiments with 4–6 wells per experiment. (b) Constitutive Adora2b or control KD cells were used in calcium switch assays as described above and allowed to recover for the indicated times. Total protein was extracted and phosphorylated vasodilator-stimulated phosphoprotein (p-VASP) (Ser157) and total VASP levels were determined by Western blot analysis. Results are representative of three independent experiments with 2 wells per time point per experiment. (c) T84 intestinal epithelial cells were used in calcium switch assays. Vehicle or the Adora2b-specific agonist (BAY 60-6583; 10 μM) was added to both the basolateral and apical aspects of the cells at the beginning of the recovery period. Barrier restitution rate was determined as described in a. Results are representative of three independent experiments with 4–6 wells per experiment. (d) T84 intestinal epithelial cells were treated as described in c and cells were harvested at different time points during the recovery period as indicated. Total protein was extracted and p-VASP (Ser157) and total VASP levels were determined by Western blot analysis. Results are representative of three independent experiments with 2 wells per time point per experiment. (e) Calcium switch assays were performed with T84 cells as described in c. Cells were allowed to recover for 30 min in the presence of vehicle or Adora2b agonist before fixation with 2% paraformaldehyde. Cells were costained with a p-VASP (Ser157) and an E-cadherin antibody followed by fluorescent secondary antibody labeling. Primary antibodies were omitted as negative control. Representative images were acquired at original magnification ×20. Bar = 50 μm. Results are representative of three independent experiments with at least 2 wells per group. Results are displayed as mean±s.e.m. Statistical analysis was performed using the Student’s t-test. *P<0.05.
Figure 7
Figure 7
Epithelial vasodilator-stimulated phosphoprotein (VASP) (Ser157) phosphorylation is induced by Adora2b (A2B adenosine receptor) signaling through protein kinase A (PKA). (a) T84 intestinal epithelial cells were pretreated on both the basolateral and apical aspect of the cell monolayer with the PKA inhibitor (H89, 30 μM) for 45 min before 5 min treatment with increasing concentrations of the Adora2b-specific agonist (BAY 60-6583; 1 and 10 μM) in the presence or absence of the PKA inhibitor. Cells were harvested, total protein extracted, and p-VASP (Ser157) and total VASP levels were determined by Western blot analysis. (b) Calcium switch assays were performed using T84 intestinal epithelial cells with a fully competent barrier. Cells were placed in calcium-depleting conditions until barrier function was fully compromised and subsequently allowed to recover in calcium complete media for the time points outlined. Cells were treated on both the basolateral and apical aspect with the Adora2b-specific agonist (BAY 60-6583; 10 μM) in the presence or absence of the PKA inhibitor (H89, 30 μM) from the beginning of the recovery period for the time points indicated. Cells were harvested, total protein extracted, and p-VASP (Ser157) and total VASP levels were determined by Western blot analysis. Results are representative of three independent experiments with 2–3 wells per time point per experiment.
Figure 8
Figure 8
Loss of epithelial Adora2b (A2B adenosine receptor) expression results in significantly reduced localization of p-VASP (phosphorylated vasodilator-stimulated phosphoprotein) (Ser157) to the intestinal epithelial barrier during acute colitis. Mice with intestinal epithelial-specific deletion of Adora2b (Adora2bfl/flVillinCre+) were exposed to DSS (dextran sulfate sodium) (3%) along with their wild-type Cre controls (VillinCre+). Following 4 and 7 days DSS, colons were harvested by blunt dissection and formalin fixed. (a and b) Formalin-fixed colons were deparaffinized and rehydrated. Slides were costained with p-VASP (Ser157) and E-cadherin antibodies and appropriate fluorescent secondary antibodies. DAPI (4′,6-diamidino-2-phenylindole) served as a nuclear counterstain. Omission of primary antibodies was used as a negative control. Representative images were acquired at original magnification ×20. Bar = 50 μm. (c) p-VASP (Ser157) costaining of E-cadherin-positive cells was calculated using Olympus software (Shinjuku, Tokyo, Japan). Image analysis was performed in a blinded manner using images acquired at the same settings, with a defined threshold of intensity applied to all images. Results represent the percentage staining of three identically sized randomly selected E-cadherin-positive regions of interest from each image. Day 4 results represent one image per mouse with four mice in each group. Day 7 results represent 4–5 images per mouse with 5–7 mice per group. Data are displayed as the mean±s.e.m. Statistical analysis was performed using the Student’s t-test. *P<0.05 and ***P<0.0001.
Figure 9
Figure 9
Adora2b (A2B adenosine receptor) agonist treatment results in significantly increased localization of p-VASP (phosphorylated vasodilator-stimulated phosphoprotein) (Ser157) to the intestinal epithelial barrier in vivo during DSS (dextran sulfate sodium) colitis. Gender-, age-, and weight-matched C57BL/6 mice were treated with an Adora2b-specific agonist (BAY 60-6583; 1.2–1.25 mg/kg−1 per day) or vehicle for 6 days during DSS as described in Figure 4. Colons were harvested by blunt dissection and formalin fixed. (a) Formalin-fixed colons were deparaffinized and rehydrated. Sections were costained with p-VASP (Ser157) and E-cadherin antibodies as described in Figure 7a and b. Representative images were acquired at original magnification ×20. Bar = 50 μm. (b) p-VASP (Ser157) staining of E-cadherin-positive cells was calculated as described in Figure 7c. Results are representative of 1–3 images per mouse with 5–7 mice per group. Statistical analysis was performed using the Student’s t-test. Data are displayed as the mean±s.e.m. ***P<0.0001.

References

    1. Khor B, Gardet A, Xavier RJ. Genetics and pathogenesis of inflammatory bowel disease. Nature. 2011;474:307–317. - PMC - PubMed
    1. Molodecky NA, et al. Increasing incidence and prevalence of the inflammatory bowel diseases with time, based on systematic review. Gastroenterology. 2012;142:46–54 e42. - PubMed
    1. Aherne CM, Kewley EM, Eltzschig HK. The resurgence of A2B adenosine receptor signaling. Biochim Biophys Acta. 2011;1808:1329–1339. - PMC - PubMed
    1. Lukashev D, Ohta A, Apasov S, Chen JF, Sitkovsky M. Cutting edge: physiologic attenuation of proinflammatory transcription by the Gs protein-coupled A2A adenosine receptor in vivo. J Immunol. 2004;173:21–24. - PubMed
    1. Impellizzeri D, et al. CGS 21680, an agonist of the adenosine (A2A) receptor, decreases acute lung inflammation. Eur J Pharmacol. 2011;668:305–316. - PubMed

Publication types

Substances

LinkOut - more resources