Flecainide exerts paradoxical effects on sodium currents and atrial arrhythmia in murine RyR2-P2328S hearts
- PMID: 25850710
- PMCID: PMC4510817
- DOI: 10.1111/apha.12505
Flecainide exerts paradoxical effects on sodium currents and atrial arrhythmia in murine RyR2-P2328S hearts
Abstract
Aims: Cardiac ryanodine receptor mutations are associated with catecholaminergic polymorphic ventricular tachycardia (CPVT), and some, including RyR2-P2328S, also predispose to atrial fibrillation. Recent work associates reduced atrial Nav 1.5 currents in homozygous RyR2-P2328S (RyR2(S/S) ) mice with slowed conduction and increased arrhythmogenicity. Yet clinically, and in murine models, the Nav 1.5 blocker flecainide reduces ventricular arrhythmogenicity in CPVT. We aimed to determine whether, and how, flecainide influences atrial arrhythmogenicity in RyR2(S/S) mice and their wild-type (WT) littermates.
Methods: We explored effects of 1 μm flecainide on WT and RyR2(S/S) atria. Arrhythmic incidence, action potential (AP) conduction velocity (CV), atrial effective refractory period (AERP) and AP wavelength (λ = CV × AERP) were measured using multi-electrode array recordings in Langendorff-perfused hearts; Na(+) currents (INa ) were recorded using loose patch clamping of superfused atria.
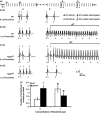
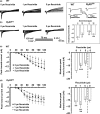
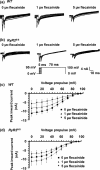
Results: RyR2(S/S) showed more frequent atrial arrhythmias, slower CV, reduced INa and unchanged AERP compared to WT. Flecainide was anti-arrhythmic in RyR2(S/S) but pro-arrhythmic in WT. It increased INa in RyR2(S/S) atria, whereas it reduced INa as expected in WT. It increased AERP while sparing CV in RyR2(S/S) , but reduced CV while sparing AERP in WT. Thus, RyR2(S/S) hearts have low λ relative to WT; flecainide then increases λ in RyR2(S/S) but decreases λ in WT.
Conclusions: Flecainide (1 μm) rescues the RyR2-P2328S atrial arrhythmogenic phenotype by restoring compromised INa and λ, changes recently attributed to increased sarcoplasmic reticular Ca(2+) release. This contrasts with the increased arrhythmic incidence and reduced INa and λ with flecainide in WT.
Keywords: CPVT; Na+ currents; atrial arrhythmia; conduction velocity; flecainide; ryanodine receptor.
© 2015 The Authors. Acta Physiologica published by John Wiley & Sons Ltd on behalf of Scandinavian Physiological Society.
Figures


Comment in
-
Linking ryanodine receptor Ca(2+) leak and Na(+) current in heart: a day in the life of flecainide.Acta Physiol (Oxf). 2015 Jul;214(3):300-2. doi: 10.1111/apha.12526. Epub 2015 May 27. Acta Physiol (Oxf). 2015. PMID: 25976700 No abstract available.
Similar articles
-
Ca2+-dependent modulation of voltage-gated myocyte sodium channels.Biochem Soc Trans. 2021 Nov 1;49(5):1941-1961. doi: 10.1042/BST20200604. Biochem Soc Trans. 2021. PMID: 34643236 Free PMC article. Review.
-
Flecainide Paradoxically Activates Cardiac Ryanodine Receptor Channels under Low Activity Conditions: A Potential Pro-Arrhythmic Action.Cells. 2021 Aug 16;10(8):2101. doi: 10.3390/cells10082101. Cells. 2021. PMID: 34440870 Free PMC article.
-
Loss of Nav1.5 expression and function in murine atria containing the RyR2-P2328S gain-of-function mutation.Cardiovasc Res. 2013 Sep 1;99(4):751-9. doi: 10.1093/cvr/cvt141. Epub 2013 May 30. Cardiovasc Res. 2013. PMID: 23723061
-
The RyR2-P2328S mutation downregulates Nav1.5 producing arrhythmic substrate in murine ventricles.Pflugers Arch. 2016 Apr;468(4):655-65. doi: 10.1007/s00424-015-1750-0. Epub 2015 Nov 6. Pflugers Arch. 2016. PMID: 26545784 Free PMC article.
-
Multiple targets for flecainide action: implications for cardiac arrhythmogenesis.Br J Pharmacol. 2018 Apr;175(8):1260-1278. doi: 10.1111/bph.13807. Epub 2017 May 12. Br J Pharmacol. 2018. PMID: 28369767 Free PMC article. Review.
Cited by
-
Ventricular pro-arrhythmic phenotype, arrhythmic substrate, ageing and mitochondrial dysfunction in peroxisome proliferator activated receptor-γ coactivator-1β deficient (Pgc-1β-/-) murine hearts.Mech Ageing Dev. 2018 Jul;173:92-103. doi: 10.1016/j.mad.2018.05.004. Epub 2018 May 12. Mech Ageing Dev. 2018. PMID: 29763629 Free PMC article.
-
Reduced cardiomyocyte Na+ current in the age-dependent murine Pgc-1β-/- model of ventricular arrhythmia.J Cell Physiol. 2019 Apr;234(4):3921-3932. doi: 10.1002/jcp.27183. Epub 2018 Aug 26. J Cell Physiol. 2019. PMID: 30146680 Free PMC article.
-
Ca2+-dependent modulation of voltage-gated myocyte sodium channels.Biochem Soc Trans. 2021 Nov 1;49(5):1941-1961. doi: 10.1042/BST20200604. Biochem Soc Trans. 2021. PMID: 34643236 Free PMC article. Review.
-
Flecainide Paradoxically Activates Cardiac Ryanodine Receptor Channels under Low Activity Conditions: A Potential Pro-Arrhythmic Action.Cells. 2021 Aug 16;10(8):2101. doi: 10.3390/cells10082101. Cells. 2021. PMID: 34440870 Free PMC article.
-
Advances in basic and translational research in atrial fibrillation.Philos Trans R Soc Lond B Biol Sci. 2023 Jun 19;378(1879):20220174. doi: 10.1098/rstb.2022.0174. Epub 2023 May 1. Philos Trans R Soc Lond B Biol Sci. 2023. PMID: 37122214 Free PMC article. Review.
References
-
- Benjamin EJ, Wolf PA, D'Agostino RB, Silbershatz H, Kannel WB. Levy D. Impact of atrial fibrillation on the risk of death: the Framingham Heart Study. Circulation. 1998;98:946–952. - PubMed
-
- Bhuiyan ZA, van den Berg MP, van Tintelen JP, Bink-Boelkens MTE, Wiesfeld ACP, Alders M, Postma AV, van Langen I, Mannens MMAM. Wilde AAM. Expanding spectrum of human RYR2-related disease: new electrocardiographic, structural, and genetic features. Circulation. 2007;116:1569–1576. - PubMed
Publication types
MeSH terms
Substances
Grants and funding
- BB/FO23863/1/BB_/Biotechnology and Biological Sciences Research Council/United Kingdom
- MR/M001288/1/MRC_/Medical Research Council/United Kingdom
- PG/14/79/31102/BHF_/British Heart Foundation/United Kingdom
- WT_/Wellcome Trust/United Kingdom
- BB/F023863/1/BB_/Biotechnology and Biological Sciences Research Council/United Kingdom
LinkOut - more resources
Full Text Sources
Other Literature Sources
Medical
Miscellaneous

