Review
. 2015 Jul;65(4):293-310.
doi: 10.1007/s12576-015-0375-6. Epub 2015 Apr 8.

Responses of skeletal muscles to gravitational unloading and/or reloading

Affiliations
Review

Responses of skeletal muscles to gravitational unloading and/or reloading

Takashi Ohira et al. J Physiol Sci. 2015 Jul.

Abstract

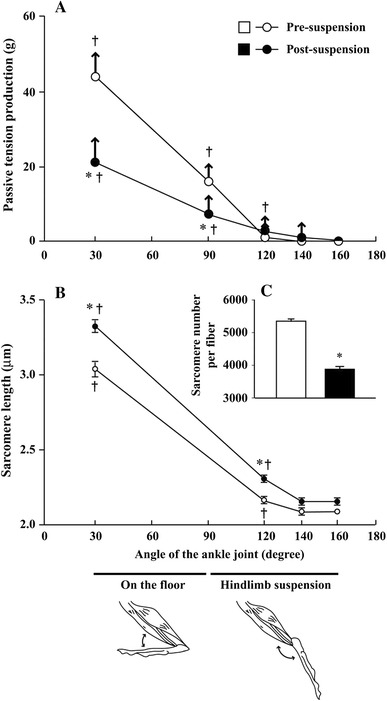
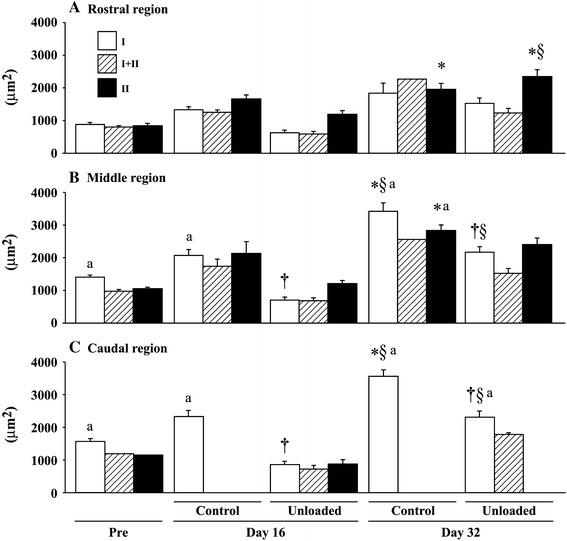
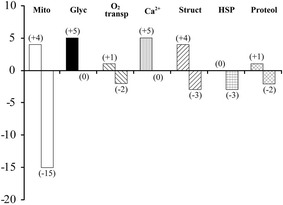
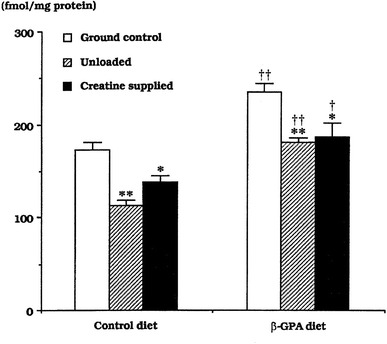
Adaptation of morphological, metabolic, and contractile properties of skeletal muscles to inhibition of antigravity activities by exposure to a microgravity environment or by simulation models, such as chronic bedrest in humans or hindlimb suspension in rodents, has been well reported. Such physiological adaptations are generally detrimental in daily life on earth. Since the development of suitable countermeasure(s) is essential to prevent or inhibit these adaptations, effects of neural, mechanical, and metabolic factors on these properties in both humans and animals were reviewed. Special attention was paid to the roles of the motoneurons (both efferent and afferent neurograms) and electromyogram activities as the neural factors, force development, and/or length of sarcomeres as the mechanical factors and mitochondrial bioenergetics as the metabolic factors.


Figures

Fig. 1
Fig. 1
Relationship between the anterior angle of the ankle joint and passive (open and closed circles) and active (arrows) tension development (A: n = 5 for each group) and the mean in vivo length of sarcomeres (B; 10 rats for each group and 5 muscles or 5 × 30 fibers for each angle) before and after 14-day hindlimb suspension. The total sarcomere number per fiber is also illustrated (C; 5 muscles or 5 × 60 fibers for each group). Mean ± SEM. * and : p < 0.05 vs. pre-suspension control and the levels at a 160° ankle joint angle, respectively. Cited from [15]
Fig. 2
Fig. 2
Region-specific responses of fiber cross-sectional area in adductor longus muscle to 16 days of hindlimb suspension and ambulation recovery in Wistar Hannover rats. Mean ± SEM; n = 5 in each group/stage. Pre, day 16, and day 32: before hindlimb unloading, immediately after termination of 16-day unloading or cage housing, and 16 days after ambulation on the floor or 32 days of cage housing, respectively. I, II, and I+II: fibers expressing pure type I (slow) and II (fast), and coexpressing both type I and II myosin heavy chain. *, , and §: p < 0.05 vs. pre, age-matched control, and respective group at day 16, respectively. a: p < 0.05 vs. the rostral region. Cited from [6]
Fig. 3
Fig. 3
Numbers of up- and downregulated proteins in mouse neck muscle following 3-month spaceflight vs. the age-matched ground-based vivarium laboratory control. Mito, mitochondria; Glyc, glycolysis; O2 transp, oxygen transport; Ca2+, calcium metabolism; Struct, myofibrillar structure; HSP, heat shock proteins; Proteol, proteolysis. Cited from [35]
Fig. 4
Fig. 4
Responses of the maximum binding capacity of β2-adrenoceptors in rat soleus to hindlimb unloading and/or supplementation of creatine or its analog, β-guanidinopropionic acid (β-GPA). Mean ± SEM. * and **: p < 0.05 and 0.01 vs. ground control; and ††: p < 0.05 and 0.01 vs. the respective group in the control diet group. Cited from [23]
Fig. 5
Fig. 5
Region-specific responses of fiber phenotypes in adductor longus muscle of Wiatar Hannover rats to 16 days of hindlimb suspension and ambulation recovery. Mean ± SEM; n = 5 in each group/stage. See Fig. 2 for the symbols and abbreviations. Cited from [6]
Fig. 6
Fig. 6
Mean percentages of rat soleus muscle fibers expressing various isoforms of myosin heavy chain (MHC) after 2 weeks of spaceflight. *, **, and : p < 0.05, p < 0.005, and p < 0.001 vs. control. Cited from [1]
Fig. 7
Fig. 7
Contractile properties of single fibers of soleus muscle. A Pictures showing the typical patterns of tension development in single fibers of control and unloaded rats immediately after 3-month cage housing or unloading. B Changes in the cross-sectional area of fibers, which were used for the analysis of contractile properties. C Absolute maximally activated isometric tension (P o). D Relative maximally activated isometric tension (F max) per fiber cross-sectional area. E Unloaded shortening velocity (V o). F Sensitivity of the fibers to calcium: calcium concentration when half of the maximum tension was obtained. Mean ± SEM. and §: p < 0.05 vs. the level immediately after 3-month unloading or cage housing (R+0-mo) and the age-matched control, respectively. FL, fiber length. R+1-mo, R+2-mo, and R+3-mo: 1, 2, and 3 months after R+0-mo, respectively. Cited from [108]
Fig. 8
Fig. 8
Pictures showing the location of nerve endplates, indicated by arrowheads, in single soleus muscle fibers sampled from the cage control and hindlimb-unloaded 3-month old rats. Cited from [108]
Fig. 9
Fig. 9
Percent distribution of muscle fibers with various numbers of nerve endplates 4 days after birth (pre-exp.) and 3 months after unloading or cage housing (R+0-mo, A), 1 (B), 2 (C), and 3 (D) months after ambulation recovery, respectively. Mean ± SEM. *, , and §: p < 0.05 vs. the 4-day old control, R+0-mo, and the age-matched control, respectively. See Fig. 7 for other abbreviations. Cited from [108]
Fig. 10
Fig. 10
Responses of contractile profiles of slow soleus muscle fibers to 2 and 4 months of bedrest and 1 month of ambulation recovery in male subjects. A Fiber diameter. B Absolute Ca2+-activated maximal force (P o). C Relative Ca2+-activated maximal force (F max) per cross-sectional area. D Unloaded shortening velocity (V o). Mean ± SEM. FL, fiber length. * and : p < 0.05 vs. pre-bedrest and 4 months of bedrest, respectively. Number of fibers: 25 per group. Cited from [60]

References

    1. Allen L, Yasui W, Tanaka T, Ohira Y, Nagaoka S, Sekiguchi C, Hinds WE, Roy RR, Edgerton VR. Myonuclear number and myosin heavy chain expression in rat soleus single muscle fibers after spaceflight. J Appl Physiol. 1996;81:145–151. - PubMed
    1. Caiozzo VJ, Baker MJ, Herrick RE, Tao M, Baldwin KM. Effects of spaceflight on skeletal muscle: mechanical properties and myosin isoform content of slow muscle. J Appl Physiol. 1994;76:1764–1773. - PubMed
    1. Edgerton VR, Roy RR (1996) Neuromuscular adaptations to actual and simulated spaceflight. In: Fregly MJ, Blatteis CM (eds) Handbook of physiology, Sect 4, Environmental physiology, III. The gravitational environment, Oxford University Press, New York, pp 721–763
    1. Martin TP, Edgerton VR, Grindland RE. Influence of spaceflight on rat skeletal muscle. J Appl Physiol. 1988;65:2318–2325. - PubMed
    1. Miu B, Martin TP, Roy RR, Oganov V, Ilyina-Kakueva E, Marini JF, Leger JJ, Bodine-Fowler SC, Edgerton VR. Metabolic and morphologic properties of single muscle fibers in the rat after spaceflight, Cosmos 1887. FASEB J. 1990;4:64–72. - PubMed