. 2015 Apr 8:6:6619.
doi: 10.1038/ncomms7619.

Interplay between chemotaxis and contact inhibition of locomotion determines exploratory cell migration

Affiliations

Interplay between chemotaxis and contact inhibition of locomotion determines exploratory cell migration

Benjamin Lin et al. Nat Commun. .

Abstract

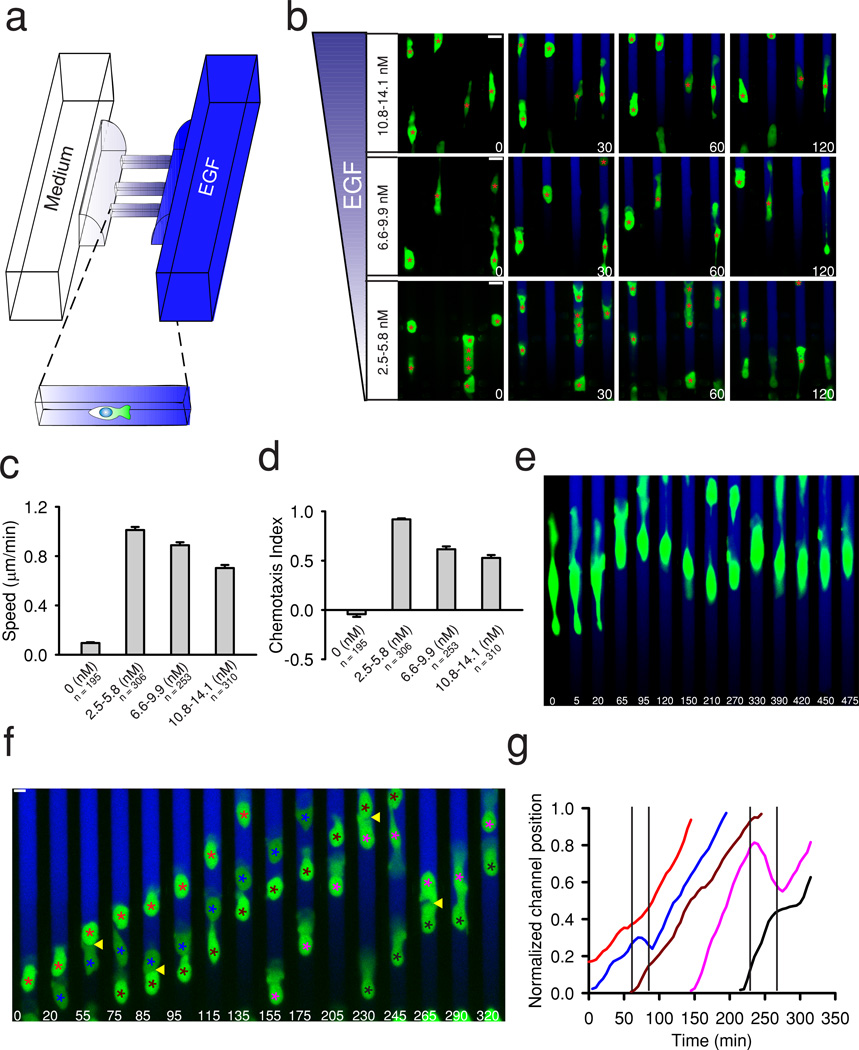
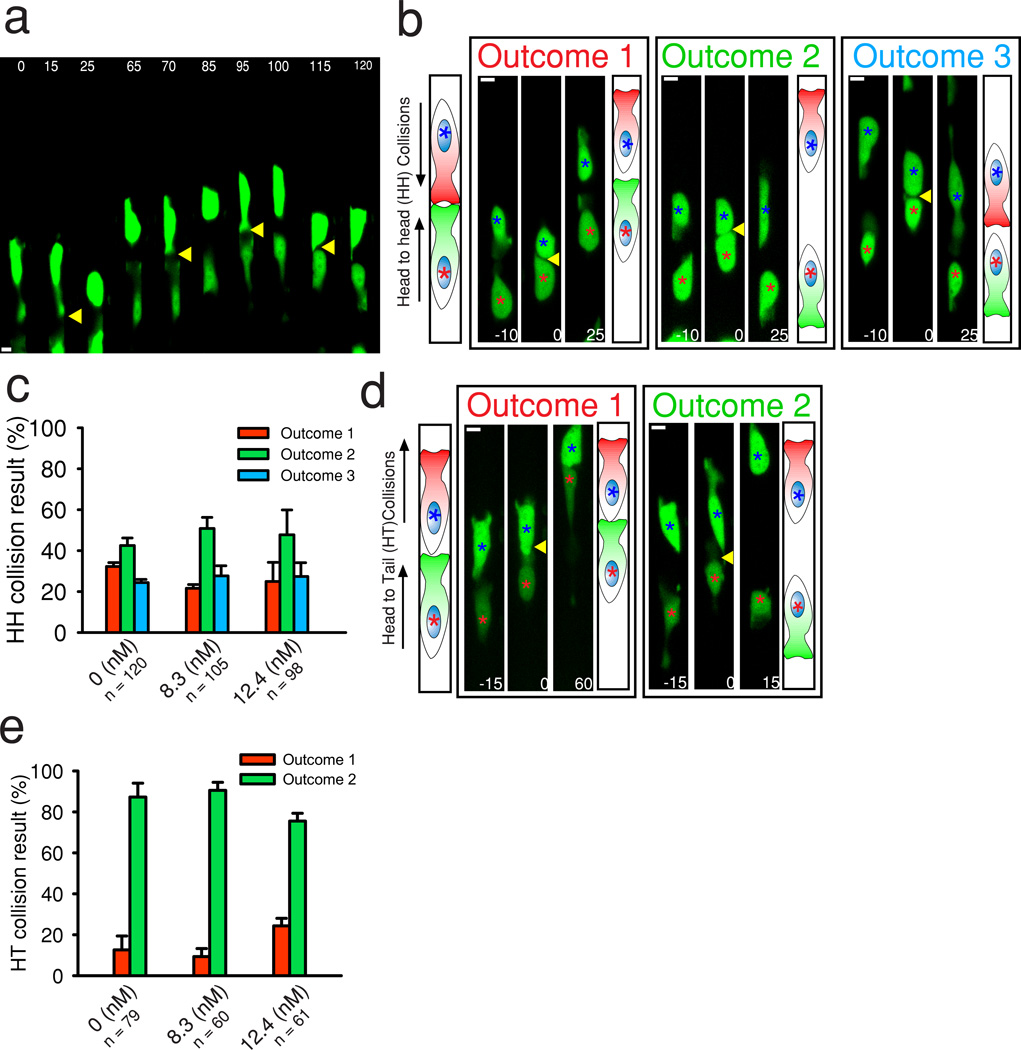
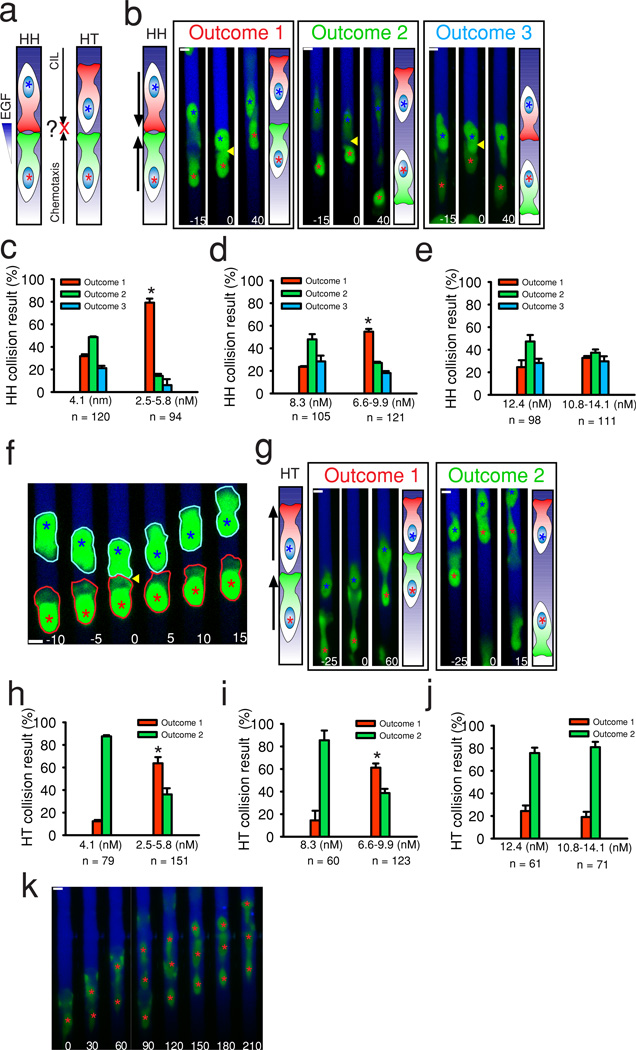
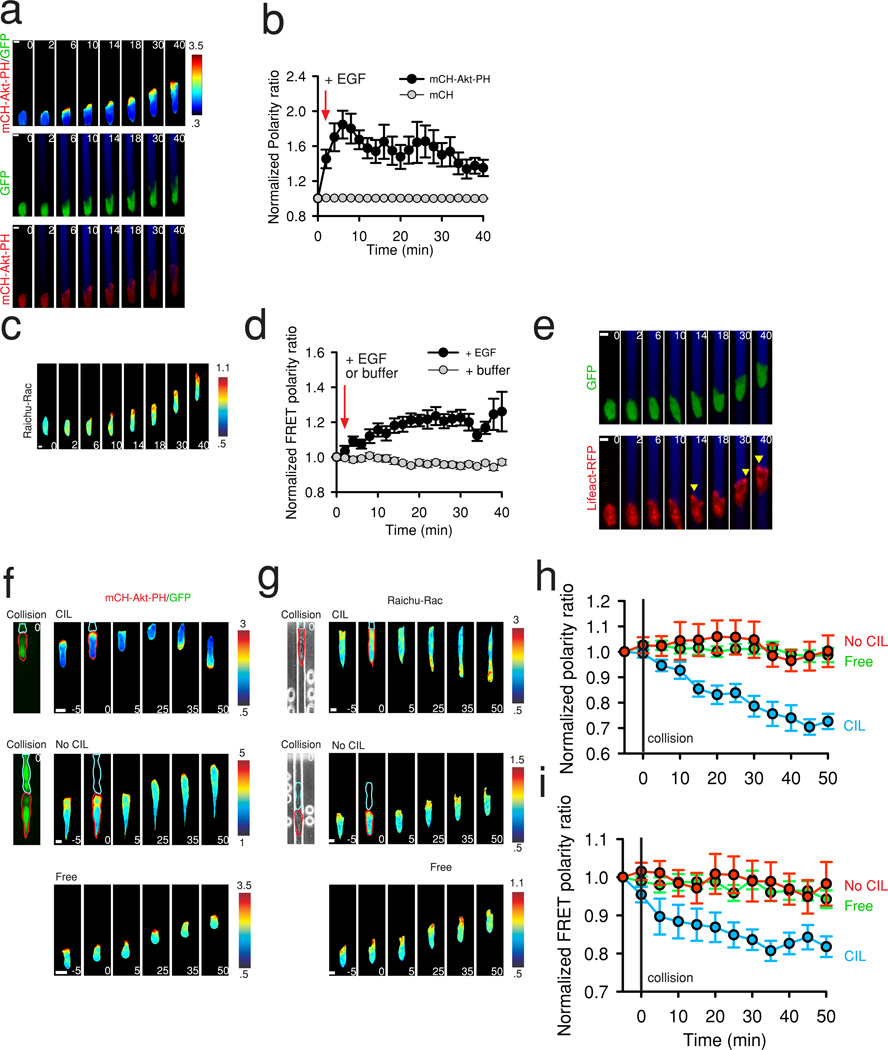
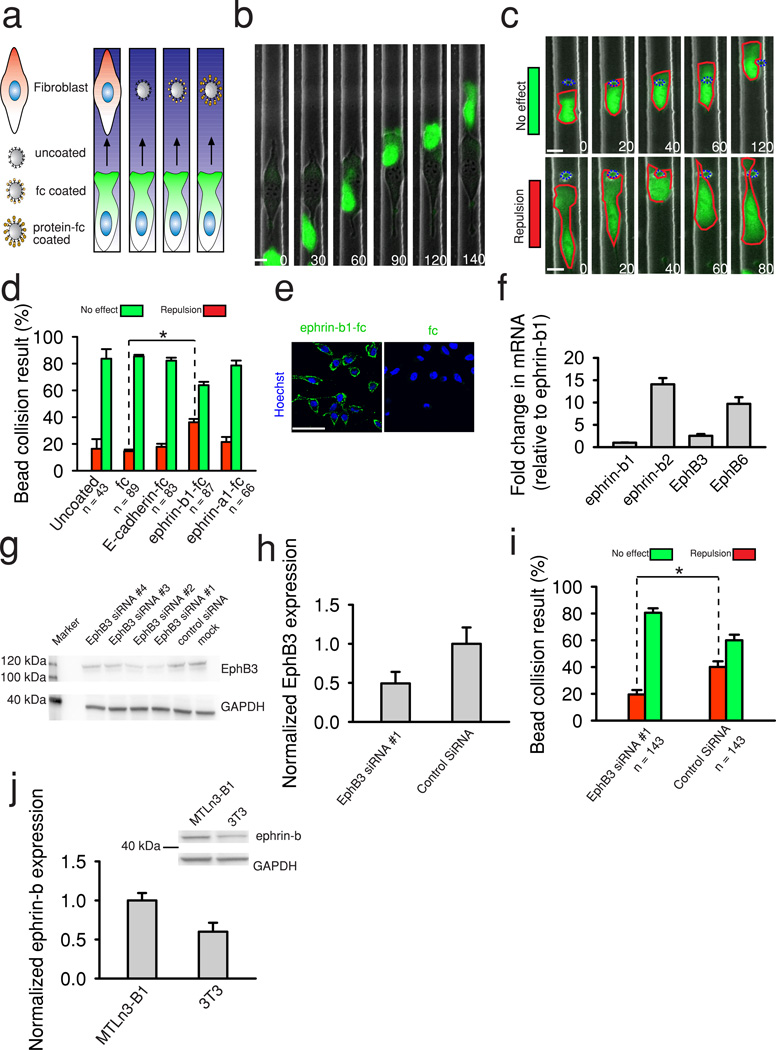
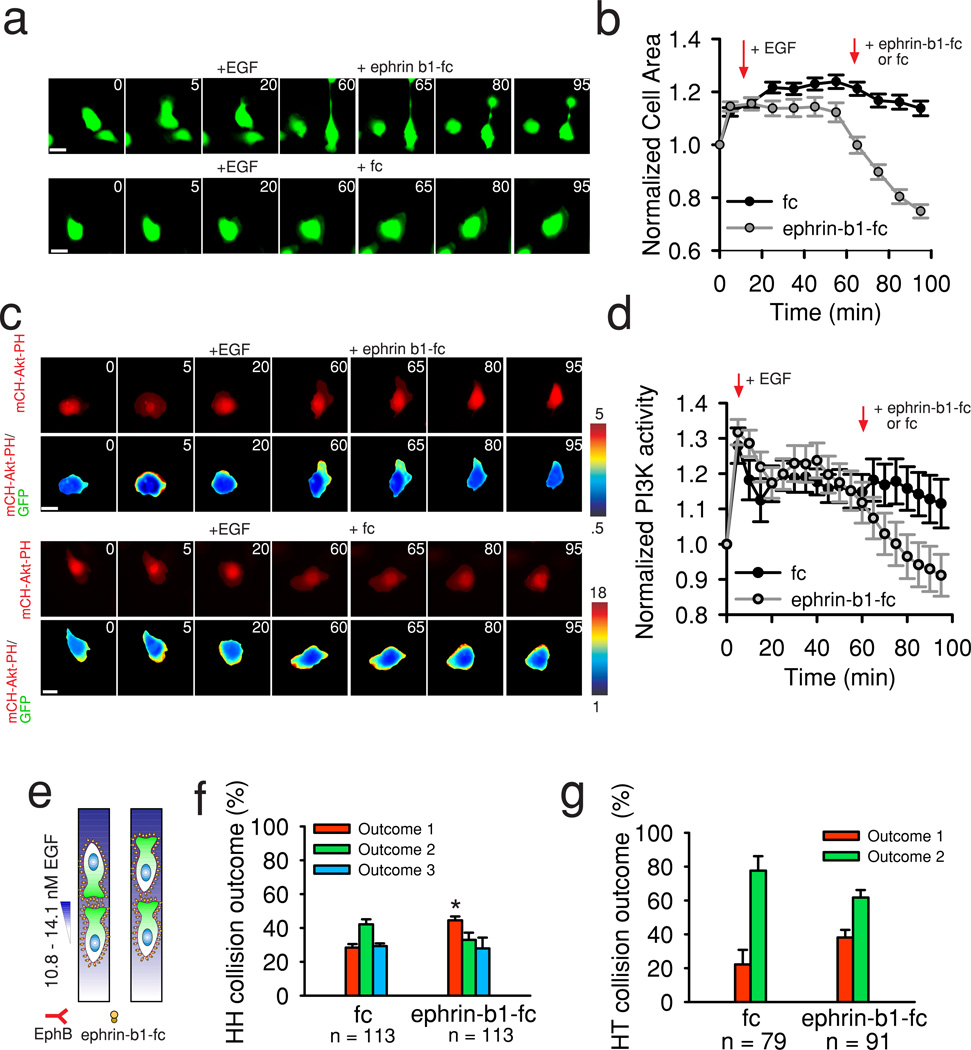
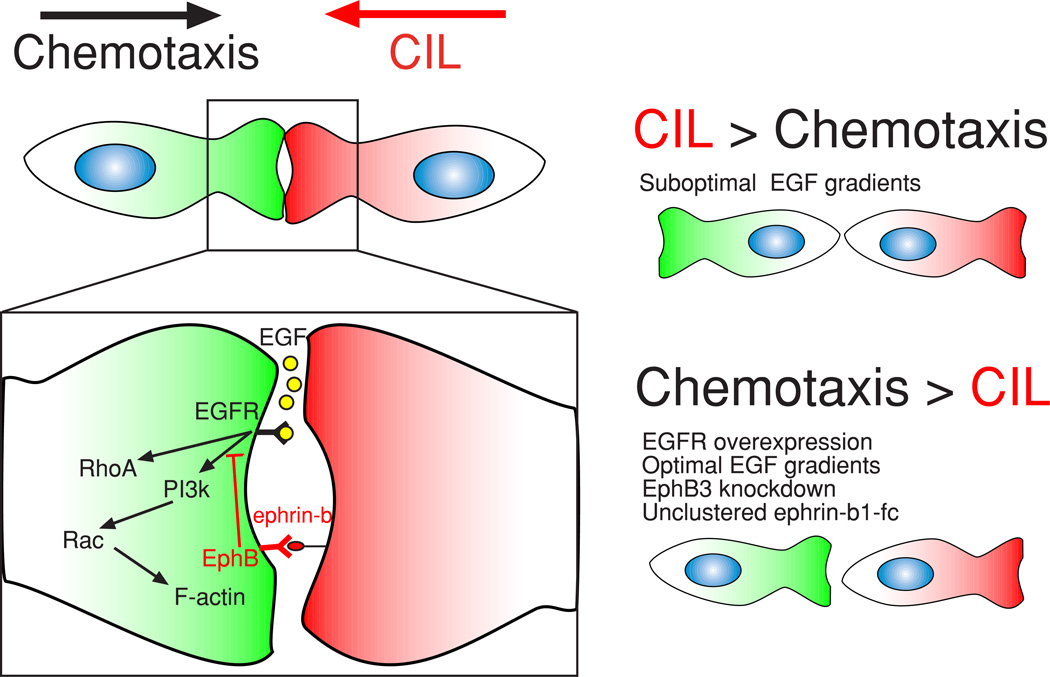
Directed cell migration in native environments is influenced by multiple migratory cues. These cues may include simultaneously occurring attractive soluble growth factor gradients and repulsive effects arising from cell-cell contact, termed contact inhibition of locomotion (CIL). How single cells reconcile potentially conflicting cues remains poorly understood. Here we show that a dynamic crosstalk between epidermal growth factor (EGF)-mediated chemotaxis and CIL guides metastatic breast cancer cell motility, whereby cells become progressively insensitive to CIL in a chemotactic input-dependent manner. This balance is determined via integration of protrusion-enhancing signalling from EGF gradients and protrusion-suppressing signalling induced by CIL, mediated in part through EphB. Our results further suggest that EphB and EGF signalling inputs control protrusion formation by converging onto regulation of phosphatidylinositol 3-kinase (PI3K). We propose that this intricate interplay may enhance the spread of loose cell ensembles in pathophysiological conditions such as cancer, and possibly other physiological settings.


Figures

Figure 1
Figure 1. MTLn3-B1 chemotaxis in different EGF gradients and influences from CIL
(a) Schematic of the microfluidic device used to produce defined gradients of EGF across microchannels housing MTLn3-B1 cells. (b) Representative images of MTLn3-B1 cells undergoing chemotaxis in different EGF gradients. Green color visualizes expression of GFP. The gradient is visualized with a Dextran dye shown in blue here and in subsequent images. Red asterisks track cell positions from time = 0. Images are rotated to aid in visualization. Times are in minutes. Scale bars, 20 µm. (c-d) Quantification of velocity and chemotaxis index of MTLn3-B1 cells under control (0 nM) and indicated EGF gradients from (b). Data is the mean from the number of indicated cells from n >= 3 independent experiments with error bars showing SEM. (e) An MTLn3-B1 cell displaying oscillations in migration in 10.8–14.1 nM EGF gradients. (f) MTLn3-B1 cells undergoing CIL during chemotaxis. Colored asterisks track different cells. Yellow arrows highlight CIL events. Times are in minutes. Scale bars, 10 µm. (g) Quantification of channel position of MTLn3-B1 cells in (f). Colored lines track the position of the corresponding cells in (g) denoted by similarly colored asterisks. Black vertical lines indicate collisions.
Figure 2
Figure 2. Characterization of CIL in uniform concentrations of EGF
(a) MTLn3-B1 cells displaying random motility and undergoing multiple CIL events in a uniform concentration of EGF (8.3 nM ). (b, d) Representative examples of the outcomes of head to head and head to tail collisions in MTLn3-B1 cells with corresponding illustrations, respectively. Collisions occur at time t = 0. Colored asterisks track different cells. Yellow arrows indicate collisions. Times are in minutes. Scale bars, 10 µm. (c, e) Probability of head to head and head to tail collision outcomes in the indicated uniform concentrations of EGF. The total number of cells are indicated per condition. Data represents the mean from n =3 independent experiments per condition and error bars show SEM.
Figure 3
Figure 3. Integration of chemotaxis and CIL is input dependent
(a) Schematic of how chemotaxis and CIL cues conflict during different cell collisions. (b, g) Examples of the outcomes of head to head (b) and head to tail (g) collisions in MTLn3-B1 cells in gradients of EGF with corresponding illustrations. Collisions occur at time t = 0. Green color indicates expression of GFP. The gradient of EGF is shown in blue visualized with a Dextran dye here and in all subsequent images. Colored asterisks track different cells. Yellow arrows indicate collisions. (c-e) Probabilities of head to head collision outcomes in gradients of EGF vs. uniform concentrations. Uniform concentrations are taken from Figure 2c. Number of collisions analyzed is indicated. Data shown is the mean of n = 3 independent experiments with error bars representing SEM. Statistical comparisons are made between the same outcome (red bars) in uniform vs. gradient using a two sided student’s t-test. (f) Example of a head to head collision in which the protrusion of a MTLn3-B1 cell migrating up the gradient (red outline, red asterisk) is not affected by a cell collision (other colliding cell shown with blue outline, blue asterisk). Time t = 0 denotes when the collision occurred. Yellow arrow indicates the collision. (h-j) Probabilities of head to tail collision outcomes in gradients of EGF vs. uniform concentrations. Uniform concentrations are taken from Figure 2e. Total collisions analyzed per condition are displayed. Data is the mean of n = 3 independent experiments per condition. Error bars are SEM. Statistical comparisons are made between the same outcome (red bars) in uniform vs. gradient using a two sided student’s t-test. (k) A group of MTLn3-B1 cells streaming up a gradient of EGF. Red asterisks track cell positions. Times are in minutes. Scale bars, 10 µm. * = p < 1e–3.
Figure 4
Figure 4. PI3K and Rac polarize and retain persistent activity at the leading edge during chemotaxis and are inhibited during CIL
(a) Representative images of PI3K activity during MTLn3-B1 chemotaxis to EGF (2.5–5.8 nM). The pseudcolor images (top panel) represent the ratio between mCH-Akt-PH and GFP. The green color (middle panel) visualizes GFP expression. Red color (bottom panel) displays mCH-Akt-PH. (b) Quantification of the polarity ratio in chemotaxing mCH-Akt-PH expressing MTLn3-B1 cells vs. control mCH expressing cells. Data represents the mean of n >= 20 cells per condition from n = 3 independent experiments. Error bars are SEM. (c) Representative images of Rac activity during MTLn3-B1 chemotaxis to EGF (2.5–5.8 nM). Pseudocolor images show the FRET ratio (YFP FRET/CFP) from a Raichu-Rac construct. (d) Quantification of the FRET polarity ratio in MTLn3-B1 cells with and without a gradient of EGF. Data represesents the mean from n >= 12 cells from n = 3 independent experiments. Error bars show SEM. (e) Representative images of the localization of F-actin during MTLn3-B1 chemotaxis to EGF (2.5–5.8 nM). Green color (top panel) indicates expression of GFP. Red color (bottom panel) displays Lifeact-RFP. Yellow arrows highlight localized enrichment of F-actin. (f-g) Visualization of (f) PI3K activity and (g) Rac activity in cells in collisions resulting in CIL (top panel), not resulting in CIL (middle panel), and in freely migrating cells (bottom panel). Collisions occur at time t = 0. The first image in the top and middle series of images visualizes the collision, showing the tracked cell outlined in red and the cell it is colliding with in blue. These outlines are reproduced in the ratio image at time = 0. Pseudocolor images represent the ratio between mCH-Akt-PH and GFP in (f) and the FRET ratio (YFP FRET/CFP) in (g). (h-i) Quantification of the polarity ratio in cells in collisions with and without CIL and free moving cells for (h) PI3K and (i) Rac. Data represents the mean from n >= 11 cells per condition from 3 independent experiments with error bars representing SEM. Times are in minutes. Scale bars, 10 µm.
Figure 5
Figure 5. EphB signaling is sufficient to induce CIL in MTLn3-B1 cells
(a) Schematic of the different obstacles assessed for their ability to induce CIL in chemotaxing MTLn3-B1 cells (2.5–5.8 nM EGF gradients). (b) An MTLn3-B1 cell migrating around a 3T3 cell during chemotaxis. Green color indicates expression of GFP in the MTLn3-B1 cell. (c) Examples of MTLn3-B1 cells undergoing repulsion (top panel) or being unaffected (bottom panel) by collisions with silica beads during EGF chemotaxis. Red dashed lines highlight cell boundaries shown in green. Blue dashed lines outline silica beads. Times are in minutes. Scale bars, 10 µm. (d) Quantification of MTLn3-B1 bead collision events during chemotaxis with different silica bead coatings. Number of total collisions analyzed per condition is indicated from n >= 2 independent experiments per condition. Error bars are SEM. Statistical comparisons are assessed with a two sided student's t-test. * = p<.05. (e) Visualization of the binding of ephrin-b1-fc or fc to cells by immunostaining against the fc domain (shown in green). Nuclei are denoted in blue with Hoechst 33342. Scale bars, 50 µm. (f) Relative expression of ephrin-b ligand and EphB receptors in MTLn3-B1 cells from real time RT-PCR. Data represents the mean from n = 3 biological replicates. Error bars are SD. (g) Representative western blot of 4 different siRNA knockdowns of EphB3 in MTLn3-B1 along with control siRNA (non targeting) and mock treated cells. GAPDH is the loading control. (h) Quantification of EphB3 knockdown in MTLn3-B1 cells using EphB3 siRNA #1 compared to a control siRNA. Data is from 3 independent experiments and is normalized to a loading control (GAPDH). Errors bars are SD. (i) Quantification of collision results between EphB3 siRNA#1 treated or control siRNA treated MTLn3-B1 cells with ephrin-b1-fc coated beads. Number of total collisions analyzed per condition is indicated from n = 3 independent experiments. Error bars are SEM. Statistical comparisons are assessed with a two sided student's t-test. * = p<.05. (j) Quantification of ephrin-b isoforms in MTLn3-B1 cells and 3T3 cells. Data is taken from n = 3 independent replicates. (Inset) Representative western blot of ephrin-b isoforms in MTLn3-B1 cells and 3T3 cells. GAPDH is used as a loading control..
Figure 6
Figure 6. EphB signaling suppresses EGF protrusion signaling in MTLn3 Cells
(a) Selected images of MTLn3-B1 cells stimulated with EGF and then treated with either clustered ephrin-b1-fc (Top panel) or fc (Bottom panel). Green color indicates expression of GFP. (b) Quantification of cell area after indicated treatments in a. Data is the mean from n >= 90 cells per condition from n = 3 independent experiments. Error bars are SEM. (c) PI3K activity after EGF treatment followed by the addition of either clustered ephrin-b1-fc (top two panels) or fc (bottom two panels). Red color indicates localization of mCH-Akt-PH, while the pseudocolor indicates the ratio of mCH-Akt-PH to cytosolic GFP. Times are in minutes. Scale bars, 20 µm. (d) Quantification of PI3K activity from data in c. Data is the mean from n >= 22 cells from n >= 3 independent experiments. Error bars are SEM. (e) Schematic of EphB receptor masking upon incubation with unclustered ephrin-b1-fc ligands. (f-g) HH and HT collision outcome probabilities in 10.8–14.1 nM EGF gradients after preincubation with either 4 µg/ml unclustered fc or ephrin-b1-fc. Total collisions analyzed per condition are displayed. Data is the mean of n = 4 independent experiments per condition. Error bars are SEM. Statistical comparisons are made between the same outcome (red bars) in fc vs. ephrin-b1-fc using a two sided student’s t-test. Times are in minutes. Scale bars, 10 µm. * = p < .01.
Figure 7
Figure 7. Integration of chemotaxis and CIL signaling determines the direction of migration
The interplay between chemotaxis and CIL is mediated in MTLn3-B1 cells by the convergence of EGF (chemotaxis) and EphB/ephrin-b (CIL) signaling above PI3K. Various conditions can shift the signaling balance between pathways and thus affect the resulting direction of migration.

Similar articles

Cited by

References

    1. Schmitt AM, et al. Wnt-Ryk signalling mediates medial-lateral retinotectal topographic mapping. Nature. 2006;439:31–37. - PubMed
    1. Carmona-Fontaine C, et al. Contact inhibition of locomotion in vivo controls neural crest directional migration. Nature. 2008;456:957–961. - PMC - PubMed
    1. Theveneau E, et al. Collective chemotaxis Requires Contact-Dependent Cell Polarity. Developmental Cell. 2010;19:39–53. - PMC - PubMed
    1. Condeelis J, Singer RH, Segall JE. THE GREAT ESCAPE: When Cancer Cells Hijack the Genes for chemotaxis and Motility. Annual Review of Cell and Developmental Biology. 2005;21:695–718. - PubMed
    1. Sidani M, et al. Cofilin determines the migration behavior and turning frequency of metastatic cancer cells. The Journal of Cell Biology. 2007;179:777–791. - PMC - PubMed

Publication types