

A climate change context for the decline of a foundation tree species in south-western Australia: insights from phylogeography and species distribution modelling
- PMID: 25851142
- PMCID: PMC4640123
- DOI: 10.1093/aob/mcv044
A climate change context for the decline of a foundation tree species in south-western Australia: insights from phylogeography and species distribution modelling
Abstract
Background and aims: A worldwide increase in tree decline and mortality has been linked to climate change and, where these represent foundation species, this can have important implications for ecosystem functions. This study tests a combined approach of phylogeographic analysis and species distribution modelling to provide a climate change context for an observed decline in crown health and an increase in mortality in Eucalyptus wandoo, an endemic tree of south-western Australia.
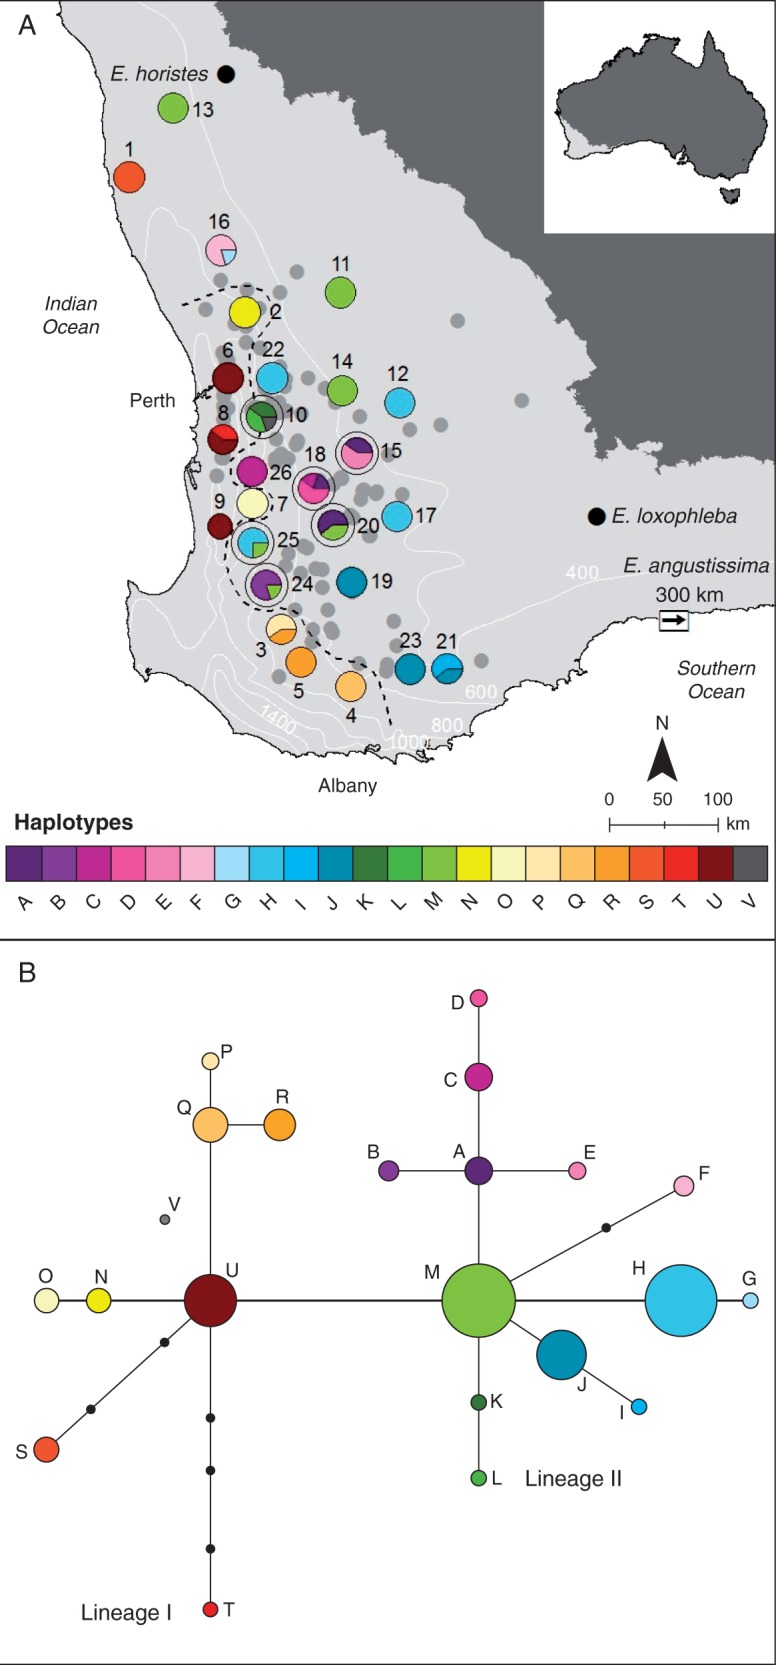
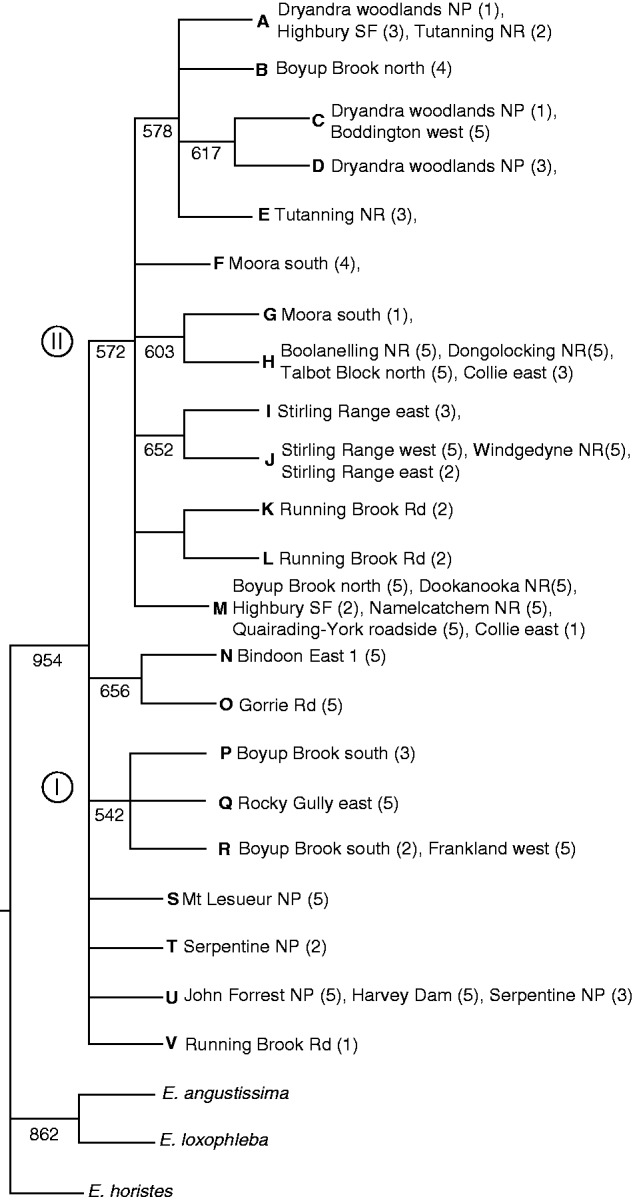
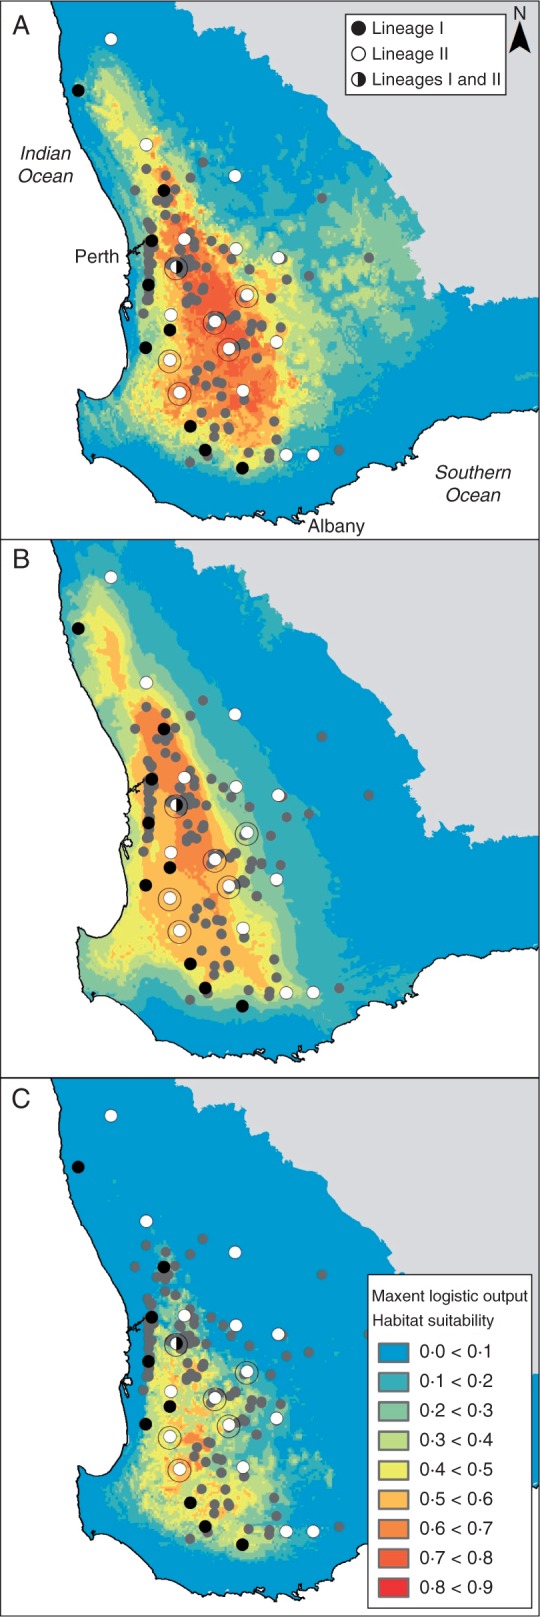
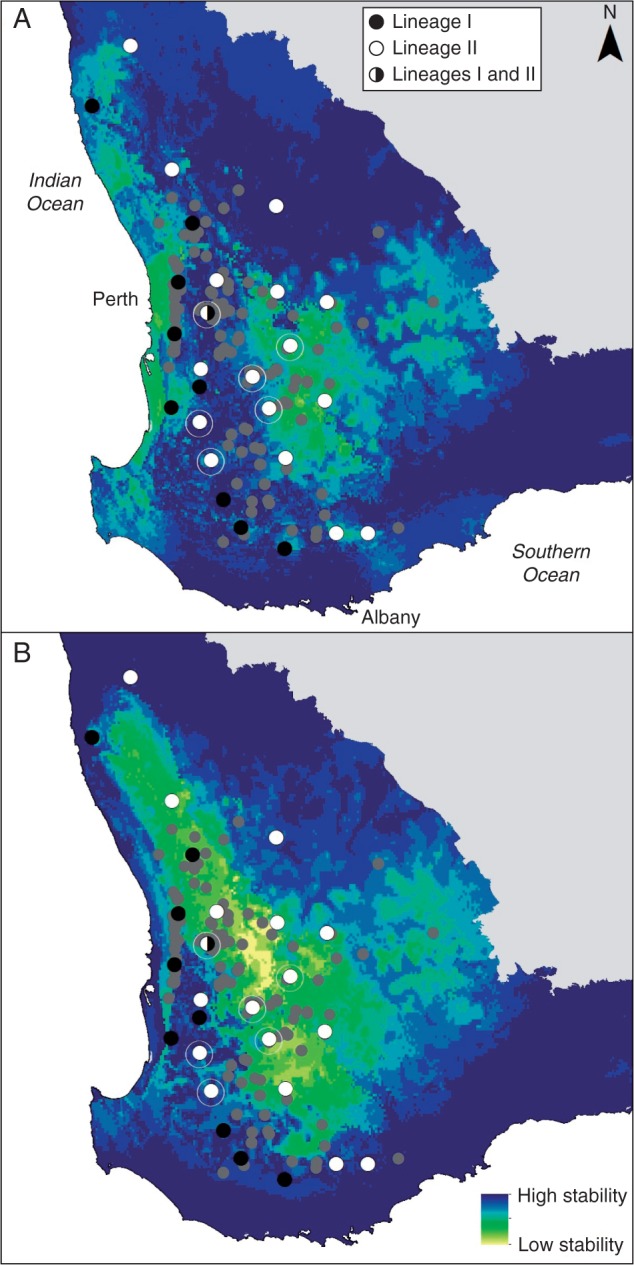
Methods: Phylogeographic analyses were undertaken using restriction fragment length polymorphism analysis of chloroplast DNA in 26 populations across the species distribution. Parsimony analysis of haplotype relationships was conducted, a haplotype network was prepared, and haplotype and nucleotide diversity were calculated. Species distribution modelling was undertaken using Maxent models based on extant species occurrences and projected to climate models of the last glacial maximum (LGM).
Key results: A structured pattern of diversity was identified, with the presence of two groups that followed a climatic gradient from mesic to semi-arid regions. Most populations were represented by a single haplotype, but many haplotypes were shared among populations, with some having widespread distributions. A putative refugial area with high haplotype diversity was identified at the centre of the species distribution. Species distribution modelling showed high climatic suitability at the LGM and high climatic stability in the central region where higher genetic diversity was found, and low suitability elsewhere, consistent with a pattern of range contraction.
Conclusions: Combination of phylogeography and paleo-distribution modelling can provide an evolutionary context for climate-driven tree decline, as both can be used to cross-validate evidence for refugia and contraction under harsh climatic conditions. This approach identified a central refugial area in the test species E. wandoo, with more recent expansion into peripheral areas from where it had contracted at the LGM. This signature of contraction from lower rainfall areas is consistent with current observations of decline on the semi-arid margin of the range, and indicates low capacity to tolerate forecast climatic change. Identification of a paleo-historical context for current tree decline enables conservation interventions to focus on maintaining genetic diversity, which provides the evolutionary potential for adaptation to climate change.
Keywords: Climate change; Eucalyptus wandoo; LGM; Myrtaceae; evolution; forest decline; haplotypes; last glacial maximum; phylogeography; refugia; species distribution modelling; tree decline..
© The Author 2015. Published by Oxford University Press on behalf of the Annals of Botany Company. All rights reserved. For Permissions, please email: journals.permissions@oup.com.
Figures
Similar articles
-
Genetic and palaeo-climatic evidence for widespread persistence of the coastal tree species Eucalyptus gomphocephala (Myrtaceae) during the Last Glacial Maximum.Ann Bot. 2014 Jan;113(1):55-67. doi: 10.1093/aob/mct253. Epub 2013 Nov 26. Ann Bot. 2014. PMID: 24284819 Free PMC article.
-
Phylogeography and genetic structure of a Tertiary relict tree species, Tapiscia sinensis (Tapisciaceae): implications for conservation.Ann Bot. 2015 Oct;116(5):727-37. doi: 10.1093/aob/mcv112. Epub 2015 Jul 17. Ann Bot. 2015. PMID: 26187222 Free PMC article.
-
Demographical history and palaeodistribution modelling show range shift towards Amazon Basin for a Neotropical tree species in the LGM.BMC Evol Biol. 2016 Oct 13;16(1):213. doi: 10.1186/s12862-016-0779-9. BMC Evol Biol. 2016. PMID: 27737632 Free PMC article.
-
Evaluating signatures of glacial refugia for North Atlantic benthic marine taxa.Ecology. 2008 Nov;89(11 Suppl):S108-22. doi: 10.1890/08-0257.1. Ecology. 2008. PMID: 19097488 Review.
-
Persistence and stochasticity are key determinants of genetic diversity in plants associated with banded iron formation inselbergs.Biol Rev Camb Philos Soc. 2019 Jun;94(3):753-772. doi: 10.1111/brv.12477. Epub 2018 Nov 26. Biol Rev Camb Philos Soc. 2019. PMID: 30479069 Review.
Cited by
-
Long-term climatic stability drives accumulation and maintenance of divergent freshwater fish lineages in a temperate biodiversity hotspot.Heredity (Edinb). 2024 Sep;133(3):149-159. doi: 10.1038/s41437-024-00700-6. Epub 2024 Jun 25. Heredity (Edinb). 2024. PMID: 38918613 Free PMC article.
-
Plants and climate change: complexities and surprises.Ann Bot. 2015 Nov;116(6):849-64. doi: 10.1093/aob/mcv169. Ann Bot. 2015. PMID: 26555281 Free PMC article. Review.
-
Extensive Genetic Connectivity and Historical Persistence Are Features of Two Widespread Tree Species in the Ancient Pilbara Region of Western Australia.Genes (Basel). 2020 Jul 29;11(8):863. doi: 10.3390/genes11080863. Genes (Basel). 2020. PMID: 32751318 Free PMC article.
-
Influence of Pleistocene climatic oscillations on the phylogeography and demographic history of endemic vulnerable trees (section Magnolia) of the Tropical Montane Cloud Forest in Mexico.PeerJ. 2021 Sep 28;9:e12181. doi: 10.7717/peerj.12181. eCollection 2021. PeerJ. 2021. PMID: 34692249 Free PMC article.
References
-
- Allen CD, Macalady AK, Chenchouni H, et al. 2010. A global overview of drought and heat-induced tree mortality reveals emerging climate change risks for forests. Forest Ecology and Management 259: 660–684.
-
- Anderegg WRL, Kane JM, Anderegg LDL. 2013. Consequences of widespread tree mortality triggered by drought and temperature stress. Nature Climate Change 3: 30–36.
-
- Avise JC. 2000. Phylogeography: the history and formation of species . Cambridge, MA: Harvard University Press.
-
- Bandelt HJ, Forster P, Röhl A. 1999. Median-joining networks for inferring intraspecific phylogenies. Molecular Biology and Evolution 16: 37–48. - PubMed
-
- Bates B, Hope P, Ryan B, Smith I, Charles S. 2008. Key findings from the Indian Ocean Climate Initiative and their impact on policy development in Australia. Climatic Change 89: 339–354.
Publication types
MeSH terms
Substances
LinkOut - more resources
Full Text Sources
Other Literature Sources
Medical
