. 2015 May 22;290(21):13401-16.
doi: 10.1074/jbc.M114.632190. Epub 2015 Apr 7.

Thiobenzothiazole-modified Hydrocortisones Display Anti-inflammatory Activity with Reduced Impact on Islet β-Cell Function

Affiliations

Thiobenzothiazole-modified Hydrocortisones Display Anti-inflammatory Activity with Reduced Impact on Islet β-Cell Function

Susan J Burke et al. J Biol Chem. .

Abstract

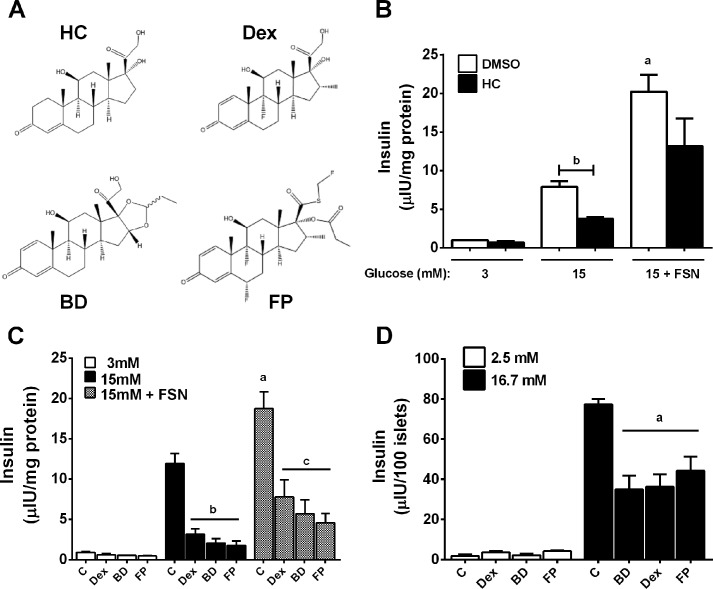
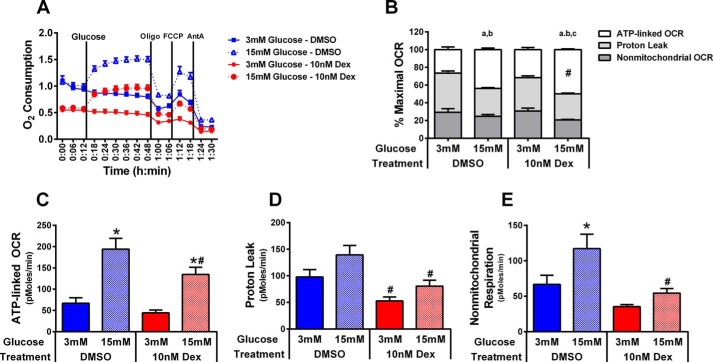
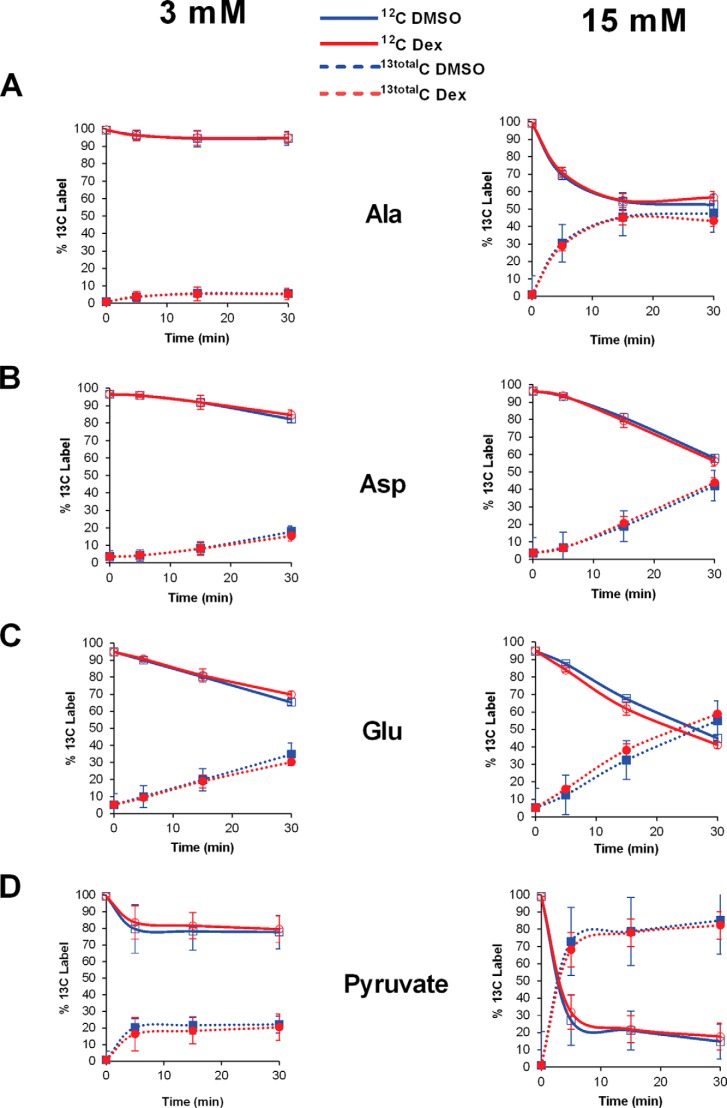
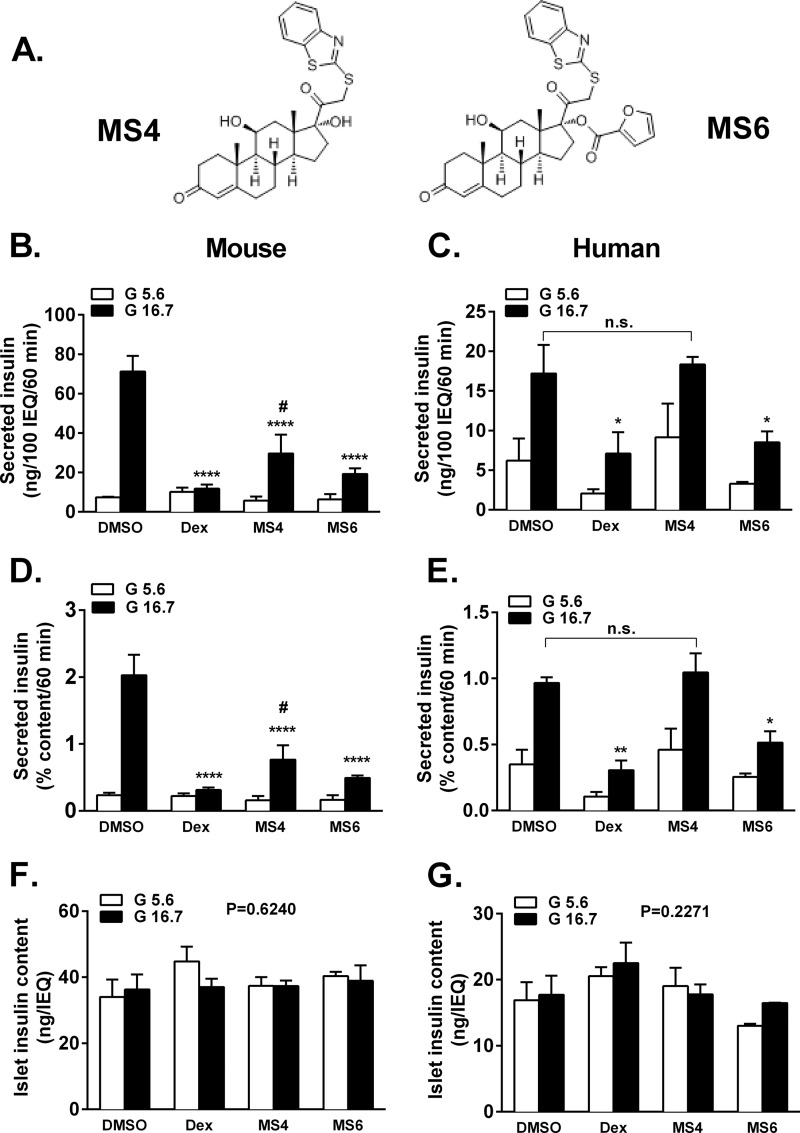
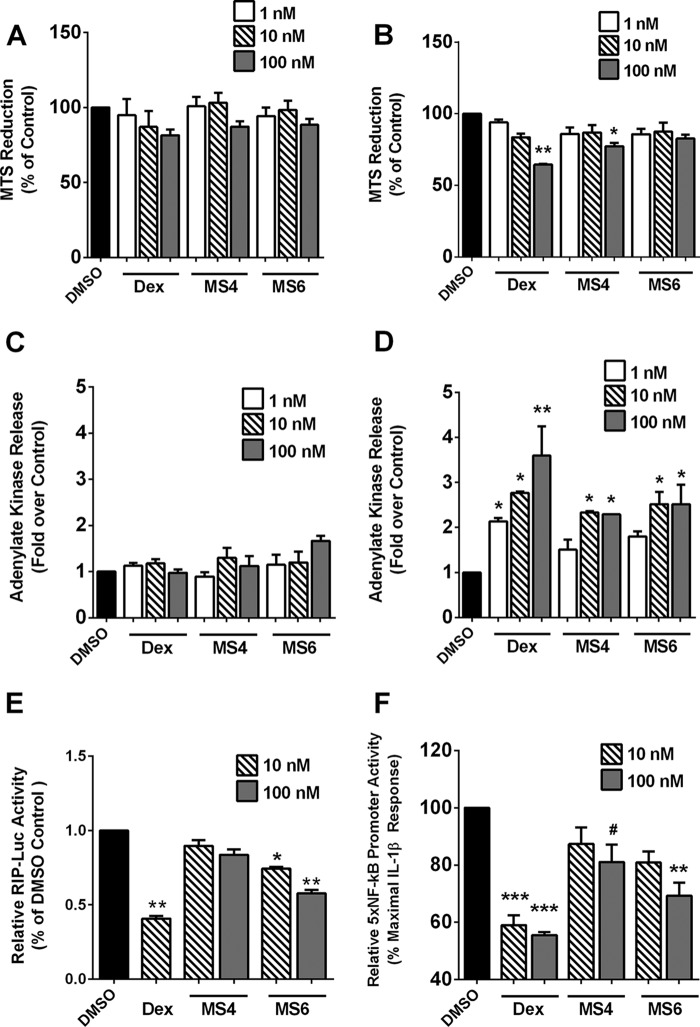
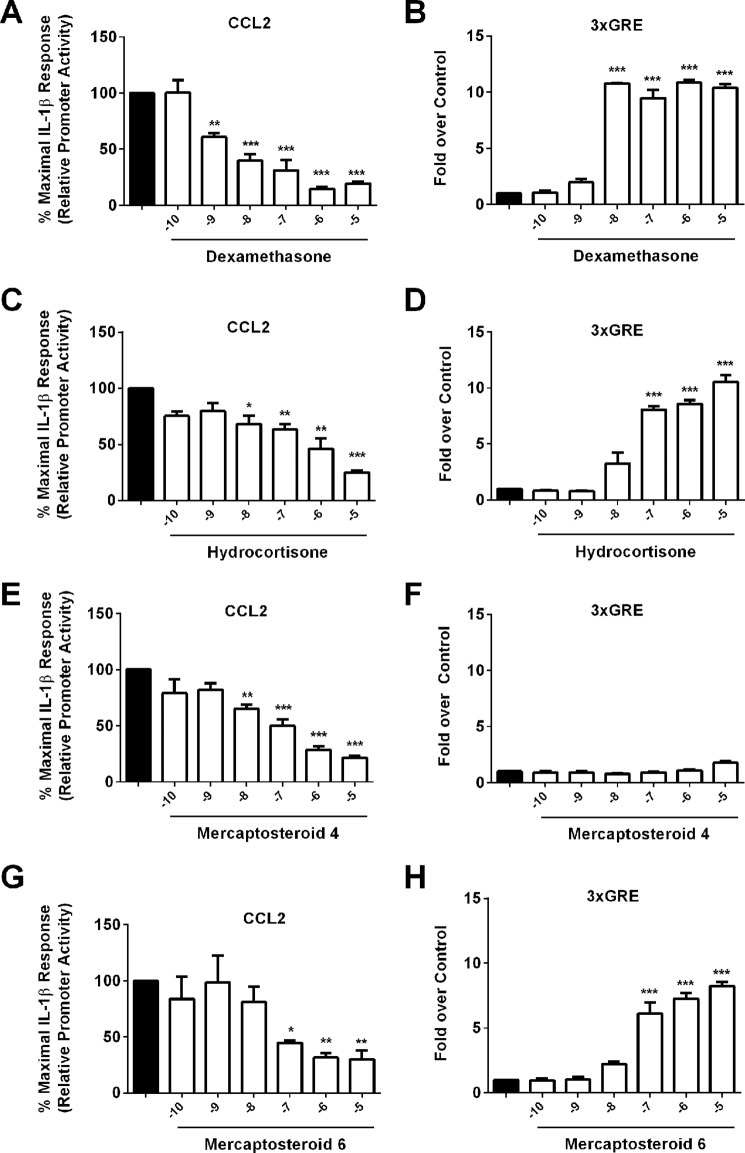
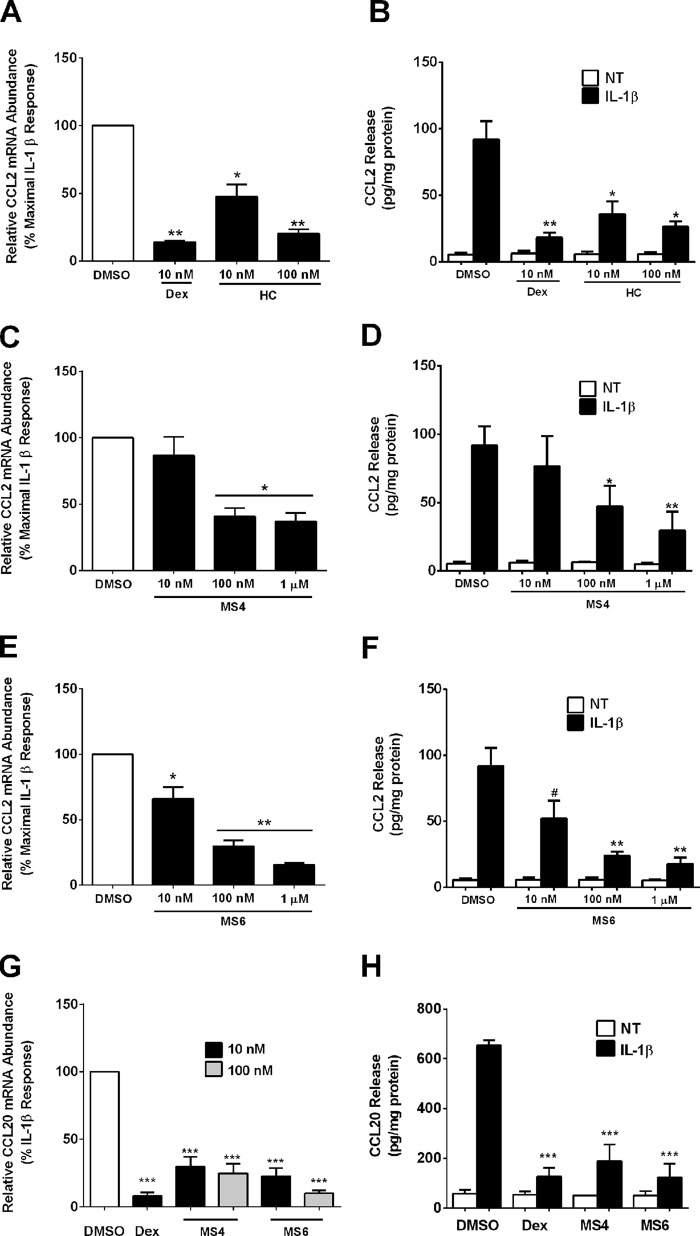
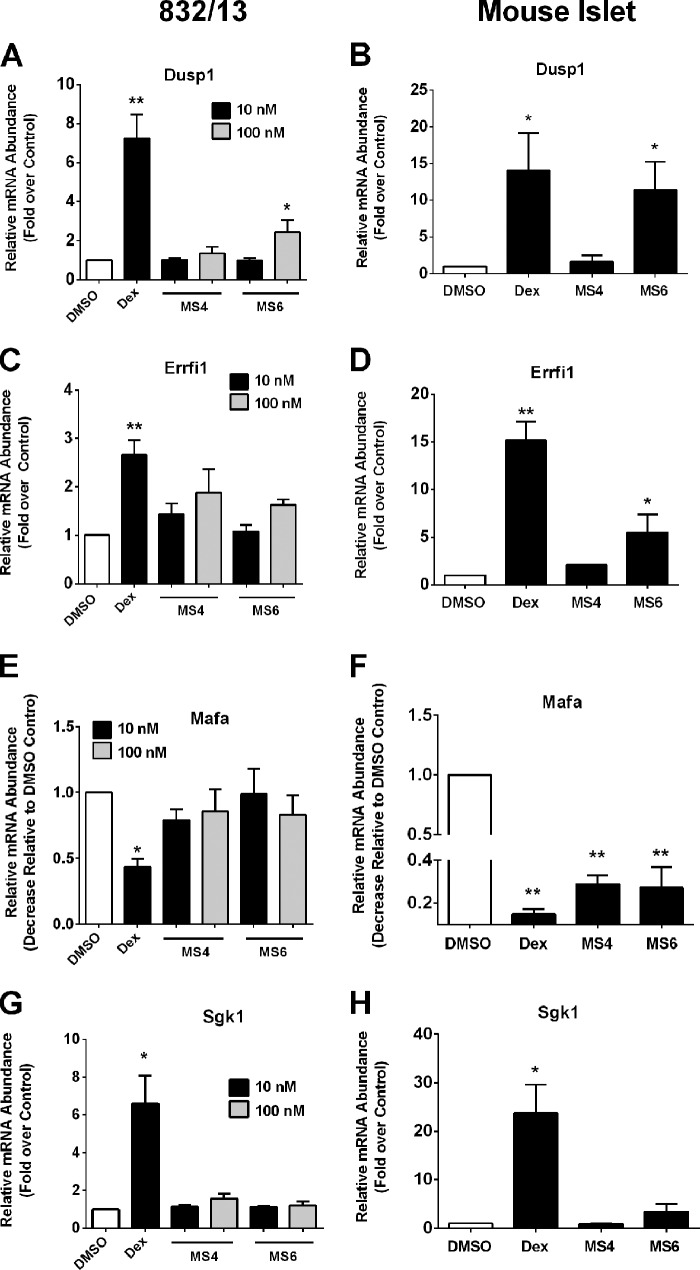
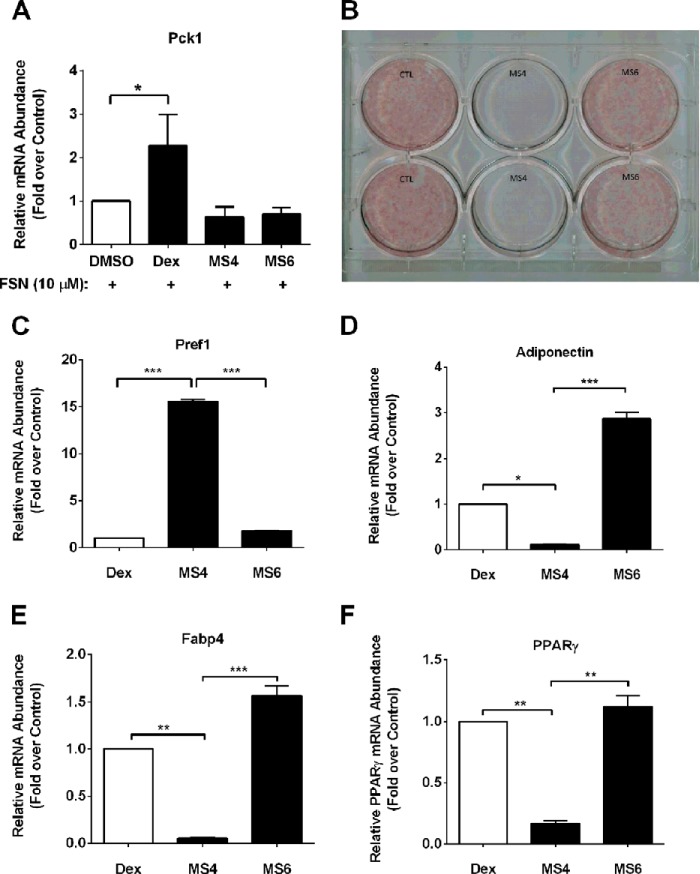
Glucocorticoids signal through the glucocorticoid receptor (GR) and are administered clinically for a variety of situations, including inflammatory disorders, specific cancers, rheumatoid arthritis, and organ/tissue transplantation. However, glucocorticoid therapy is also associated with additional complications, including steroid-induced diabetes. We hypothesized that modification of the steroid backbone is one strategy to enhance the therapeutic potential of GR activation. Toward this goal, two commercially unavailable, thiobenzothiazole-containing derivatives of hydrocortisone (termed MS4 and MS6) were examined using 832/13 rat insulinoma cells as well as rodent and human islets. We found that MS4 had transrepression properties but lacked transactivation ability, whereas MS6 retained both transactivation and transrepression activities. In addition, MS4 and MS6 both displayed anti-inflammatory activity. Furthermore, MS4 displayed reduced impact on islet β-cell function in both rodent and human islets. Similar to dexamethasone, MS6 promoted adipocyte development in vitro, whereas MS4 did not. Moreover, neither MS4 nor MS6 activated the Pck1 (Pepck) gene in primary rat hepatocytes. We conclude that modification of the functional groups attached to the D-ring of the hydrocortisone steroid molecule produces compounds with altered structure-function GR agonist activity with decreased impact on insulin secretion and reduced adipogenic potential but with preservation of anti-inflammatory activity.

Keywords: adipogenesis; chemokine; glucocorticoid; inflammation; insulin secretion.


Figures

FIGURE 1.
FIGURE 1.
Glucocorticoids impair insulin secretion in 832/13 rat insulinoma cells and isolated rat islets. A, structures of commercially available synthetic glucocorticoids. B, 832/13 cells were cultured overnight (18–24 h) in the presence or absence of 100 nm hydrocortisone (HC), followed by measurements of insulin secretion in response to 3 or 15 mm glucose or 15 mm glucose plus 5 μm forskolin (FSN). a, p < 0.05 versus DMSO 15 mm glucose group; b, p < 0.01. C, 832/13 cells were incubated overnight with either DMSO vehicle control (C) or 10 nm Dex, budesonide (BD), or fluticasone propionate (FP). Insulin secretion was measured in response to 3 mm and 15 mm glucose and 15 mm glucose plus 5 μm forskolin. a, p < 0.05 versus DMSO control 15 mm glucose group; b, p < 0.05 versus DMSO control 15 mm group; c, p < 0.05 versus DMSO control 15 mm plus forskolin group. D, isolated rat islets were cultured overnight in the presence of either DMSO control (C) or 10 nm Dex, budesonide, or fluticasone propionate. Insulin secretion was measured in the presence of 2.5 and 16.7 mm glucose. a, p < 0.05 versus DMSO control 15 mm group. Error bars, S.E.
FIGURE 2.
FIGURE 2.
Dexamethasone decreases oxygen consumption. 832/13 cells were seeded at a density of 50,000 cells/well on V7-PS plates to be analyzed using a Seahorse XF24 Analyzer. Cells were exposed to either DMSO control or 10 nm Dex for 18 h prior to measurements. Mitochondrial function (A) was tested as basal OCR at 3 mm glucose followed by the sequential addition of glucose (3 mm (solid lines) versus 15 mm (dashed lines)), oligomycin (Oligo; 0.5 μg/ml), carbonyl cyanide p-trifluoromethoxyphenylhydrazone (FCCP) (2.5 μm), and antimycin A (AntA; 10 μm). The relative contribution to maximal OCR of ATP-linked OCR, proton leak, and nonmitochondrial respiration is represented as percentage of maximal OCR (B), whereas absolute rates are presented in C–E. OCR linked to ATP production was calculated as the difference between maximal OCR (at either 3 or 15 mm glucose) minus OCR after inhibition of ATP synthase (oligomycin addition). Nonmitochondrial respiration was defined as the OCR remaining following the addition of antimycin A (Ant A), whereas proton leak was calculated as the difference in OCR after oligomycin minus antimycin A injection. Data are mean ± S.E. (error bars) for 12–16 samples. a, p < 0.05 ATP-linked OCR for 3 mm versus 15 mm glucose; b, p < 0.05 proton leak for 3 mm glucose versus 15 mm glucose; c, p < 0.05 for nonmitochondrial OCR for 3 mm versus 15 mm glucose; *, p < 0.05 3 mm versus 15 mm glucose; #, p < 0.05 DMSO versus Dex.
FIGURE 3.
FIGURE 3.
Kinetic flux profiling by mass spectrometry reveals glucose-induced but not glucocorticoid-induced changes in metabolites associated with stimulus-secretion coupling. 832/13 cells were exposed to either DMSO or 10 nm Dex overnight. The cell culture medium was then replaced with a Hepes balanced salt solution containing either 3 or 15 mm [U-13C]glucose, and cells were harvested at the time points indicated. Cellular extracts were analyzed by UPLC-MS for 13C incorporation into water-soluble metabolites. Replicate data are shown as means ± S.D.
FIGURE 4.
FIGURE 4.
Glucose-stimulated insulin secretion is improved in mouse and human islets exposed to MS4 when compared with Dex and MS6. A, structures of MS4 and MS4. B, D, and F, C57BL6 islets were cultured overnight in the presence of either 100 nm Dex, MS4, or MS6 followed by static incubation in either 5.6 or 16.7 mm glucose. Insulin secreted into the culture medium and total insulin content were measured by radioimmunoassay. ****, p < 0.001 versus DMSO 16.7 mm glucose; #, p < 0.05 versus MS4 5.6 mm glucose (C, E, and G). Human islets were cultured overnight in the presence of either 100 nm Dex, MS4, or MS6 followed by static incubation in either 5.6 or 16.7 mm glucose. Insulin secreted into the culture medium and total insulin content were measured by radioimmunoassay. *, p < 0.05 versus DMSO, 16.7 mm glucose; ** p < 0.01 versus DMSO, 16.7 mm glucose. Error bars, S.E.
FIGURE 5.
FIGURE 5.
Mercaptosteroids display reduced toxicity when compared with dexamethasone. A–D, 832/13 cells were treated with the indicated concentrations of Dex, MS4, and MS6 for 24 h (A and C) or 48 h (B and D). MTS reduction (A and B) and adenylate kinase release into the culture medium (C and D) were measured after exposure to the indicated steroidal concentrations. E, 832/13 cells were transfected with a luciferase reporter gene driven by the rat insulin promoter (RIP-Luc). 12 h post-transfection, cells were exposed to either Dex (10 nm), MS4 (10 and 100 nm), or MS6 (10 and 100 nm) for 18 h. F, 832/13 cells were transduced with an adenovirus expressing the 5xNF-κB-luciferase reporter gene. 24 h after viral transduction, cells were pretreated for 1 h with Dex, MS4, and MS6, followed by exposure to 1 ng/ml IL-1β for 4 h. E and F, Promoter activity was normalized to total cellular protein content. Data are expressed as means ± S.E. (error bars) from three independent experiments. ***, p < 0.001 versus DMSO (F); **, p < 0.01 versus DMSO (B, E, and F); *, p < 0.05 versus DMSO (B, D, and E); #, p < 0.1 versus DMSO (F).
FIGURE 6.
FIGURE 6.
MS6 displays both transactivation and transrepression activity in promoter-luciferase reporter assays. 832/13 cells were transfected with luciferase reporter constructs containing either −3.6 kb of the Ccl2 gene promoter (CCL2) or three copies of a consensus GRE in tandem (3xGRE). A, C, E, and G, 24 h post-transfection, cells were pretreated for 1 h with the indicated concentrations of Dex (A), HC (C), MS4 (E), and MS6 (G) and then cultured for 4 h with 1 ng/ml IL-1β. B, D, F, and H, cells were treated for 4 h with the log10 of the steroid concentrations as shown on the x axis. Data are means ± S.E. (error bars) from 3–4 individual experiments. ***, p < 0.001 versus DMSO (black bar); **, p < 0.01 versus DMSO (black bar); *, p < 0.05 versus DMSO (black bar).
FIGURE 7.
FIGURE 7.
Mercaptosteroids suppress Ccl2 and Ccl20 gene expression and secretion of protein. A–H, 832/13 cells were pretreated with the indicated concentrations of steroids for 1 h followed by a 6-h exposure to 1 ng/ml IL-1β. Relative mRNA abundance of Ccl2 (A, C, and E) and Ccl20 (G) was normalized to RPS9. ***, p < 0.001 versus DMSO (G); **, p < 0.01 versus DMSO (A and E); *, p < 0.05 versus DMSO (A, C, and E). CCL2 (B, D, and F) and CCL20 (H) release into the medium was measured by ELISA and normalized to total protein content. ***, p < 0.001 versus DMSO (black bar; G); **, p < 0.01 versus DMSO (black bar; B, D, and F); *, p < 0.05 versus DMSO (black bar; B and D); #, p < 0.1 versus DMSO (black bar; F). Data are expressed as means ± S.E. (error bars) from three independent experiments.
FIGURE 8.
FIGURE 8.
Differential expression of genes related to β-cell function by Dex and mercaptosteroids. A, C, E, and G, 832/13 cells were cultured with Dex (10 nm), MS4 (10 and 100 nm), or MS6 (10 and 100 nm) for 6 h. B, D, F, and H, isolated mouse islets were cultured with 100 nm Dex, MS4, and MS6 for 6 h. A–H, relative expression levels of Dusp1, Errfi1, Mafa, and Sgk1 were normalized to RPS9. *, p < 0.05 versus DMSO; **, p < 0.01 versus DMSO. Data are expressed as means ± S.E. (error bars).
FIGURE 9.
FIGURE 9.
MS6, but not MS4, promotes adipocyte differentiation. A, primary rat hepatocytes were treated with 100 nm Dex, MS4, or MS6 in the presence 10 μm forskolin (FSN). Following RNA isolation, Pck1 (Pepck) mRNA abundance was measured and normalized to RPS9. B, murine 3T3-L1 preadipocytes were induced to differentiate using the standard MDI induction mixture containing 100 nm Dex (CTL) or 100 nm each of either MS4 or MS6. Cell monolayers were subjected to Oil Red O staining 5 days after the induction of adipogenesis. RNA was isolated from the conditions indicated in B, followed by detection of transcript levels of Pref1 (C), adiponectin (D), Fabp4 (E), and Pparg (F), followed by normalization to the housekeeping gene RPS9. Data are shown as means + S.E. (error bars) for two independent experiments, each performed in duplicate. ***, p < 0.001; **, p < 0.01; *, p < 0.05.

Similar articles

Cited by

References

    1. Kadmiel M., Cidlowski J. A. (2013) Glucocorticoid receptor signaling in health and disease. Trends Pharmacol. Sci. 34, 518–530 - PMC - PubMed
    1. Schäcke H., Döcke W. D., Asadullah K. (2002) Mechanisms involved in the side effects of glucocorticoids. Pharmacol. Ther. 96, 23–43 - PubMed
    1. van Raalte D. H., Diamant M. (2014) Steroid diabetes: from mechanism to treatment? Neth. J. Med. 72, 62–72 - PubMed
    1. Delaunay F., Khan A., Cintra A., Davani B., Ling Z. C., Andersson A., Ostenson C. G., Gustafsson J., Efendic S., Okret S. (1997) Pancreatic beta cells are important targets for the diabetogenic effects of glucocorticoids. J. Clin. Invest. 100, 2094–2098 - PMC - PubMed
    1. Blondeau B., Sahly I., Massouridès E., Singh-Estivalet A., Valtat B., Dorchene D., Jaisser F., Bréant B., Tronche F. (2012) Novel transgenic mice for inducible gene overexpression in pancreatic cells define glucocorticoid receptor-mediated regulations of beta cells. PLoS One 7, e30210. - PMC - PubMed

Publication types

MeSH terms