. 2015 May 22;290(21):13064-78.
doi: 10.1074/jbc.M115.637439. Epub 2015 Apr 7.

Essential Role for Zinc Transporter 2 (ZnT2)-mediated Zinc Transport in Mammary Gland Development and Function during Lactation

Affiliations

Essential Role for Zinc Transporter 2 (ZnT2)-mediated Zinc Transport in Mammary Gland Development and Function during Lactation

Sooyeon Lee et al. J Biol Chem. .

Abstract

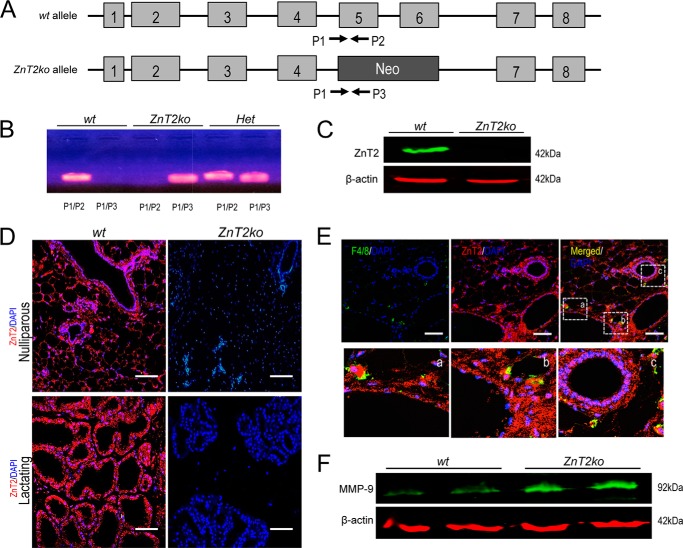
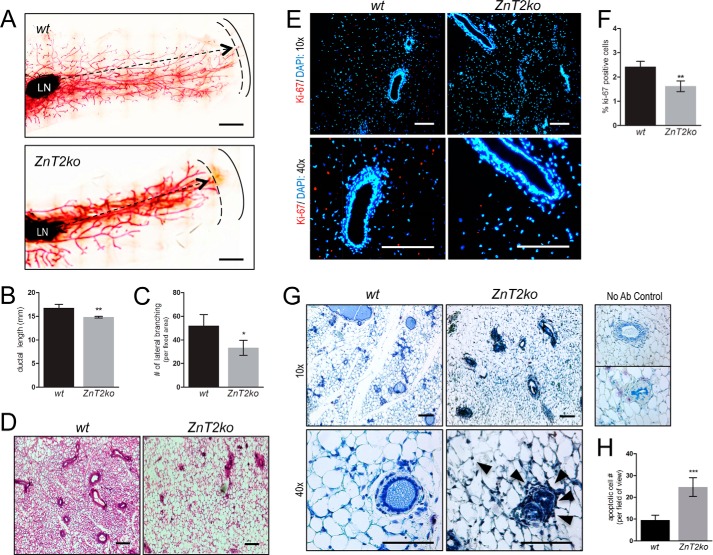
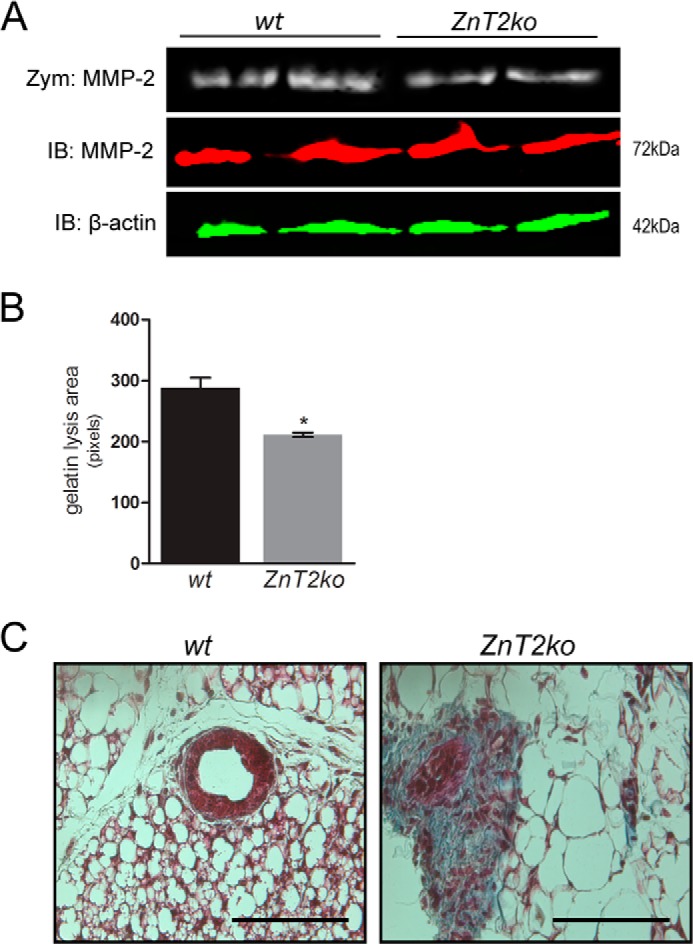
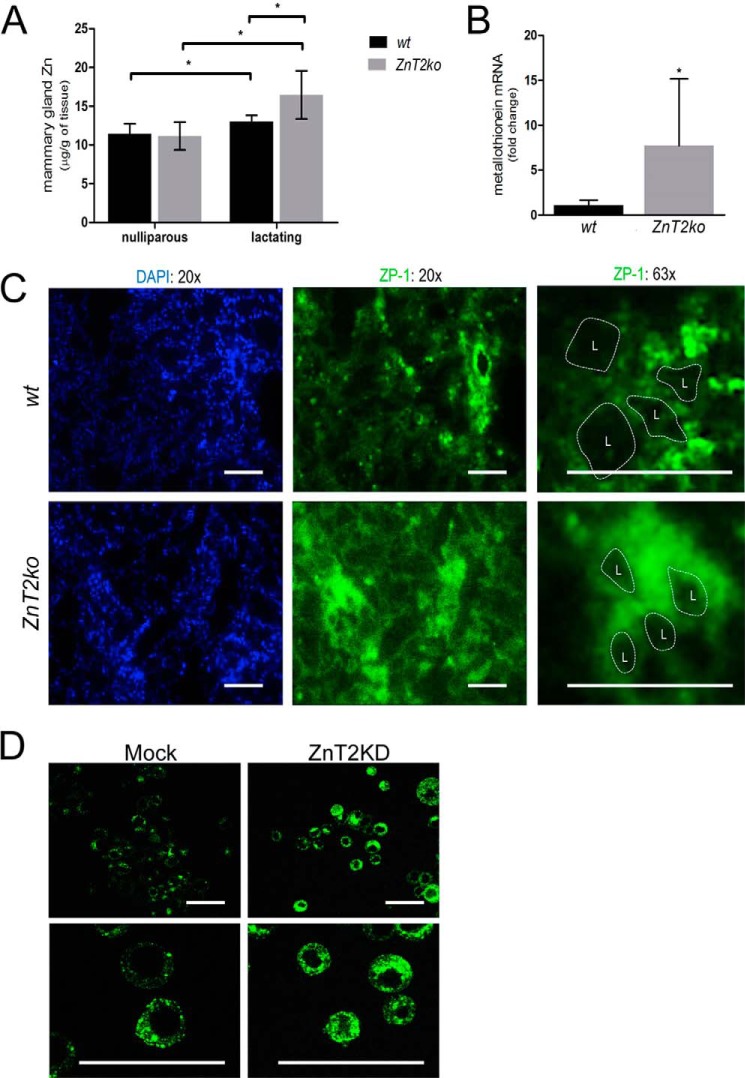
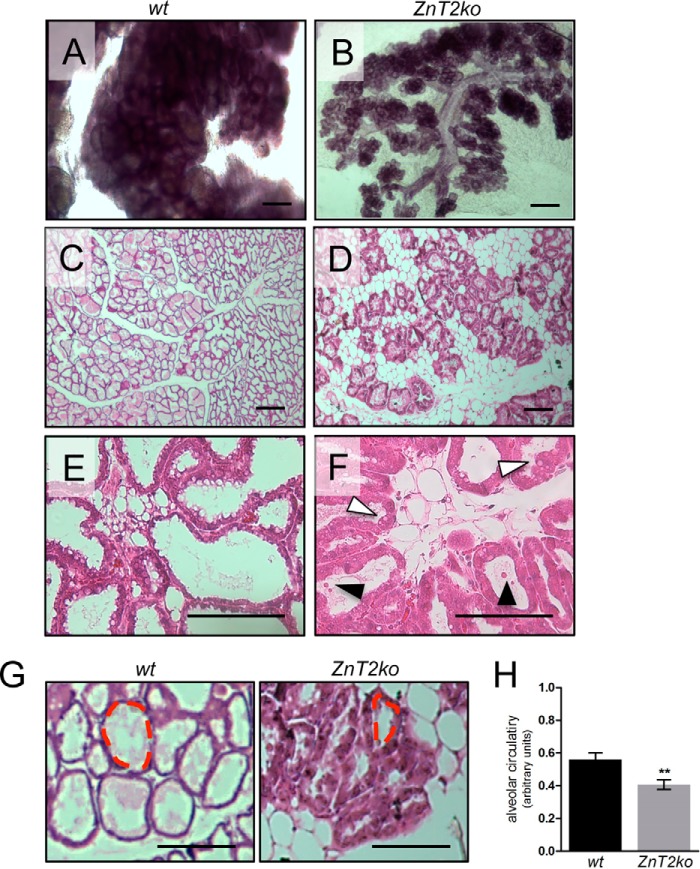
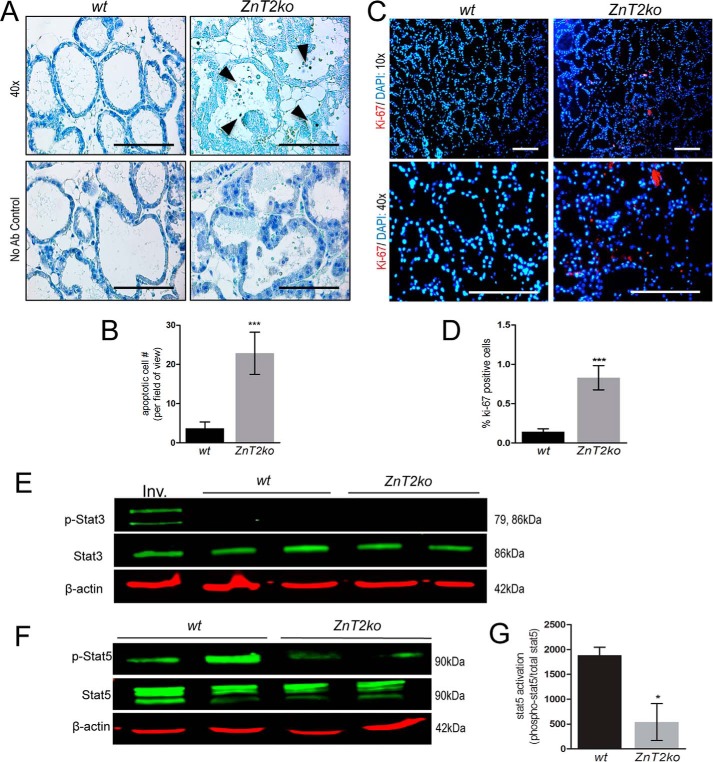
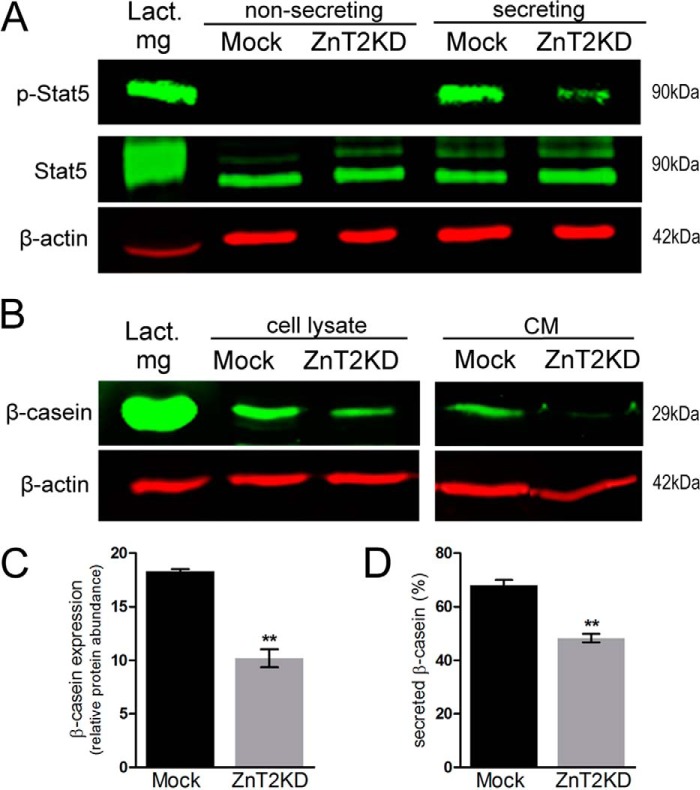
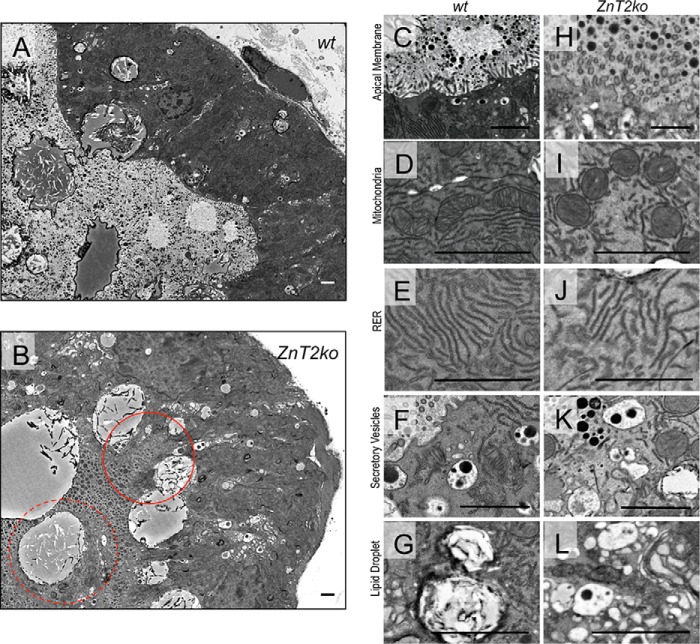
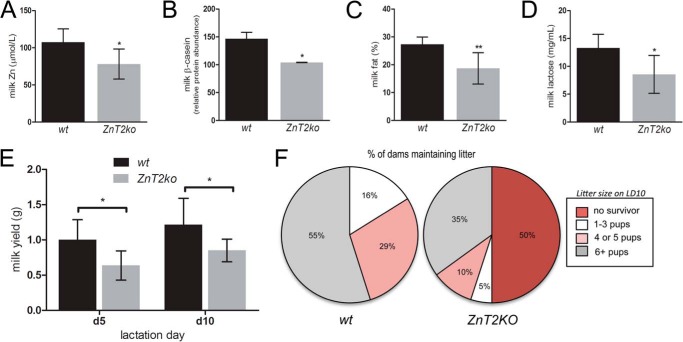
The zinc transporter ZnT2 (SLC30A2) imports zinc into vesicles in secreting mammary epithelial cells (MECs) and is critical for zinc efflux into milk during lactation. Recent studies show that ZnT2 also imports zinc into mitochondria and is expressed in the non-lactating mammary gland and non-secreting MECs, highlighting the importance of ZnT2 in general mammary gland biology. In this study we used nulliparous and lactating ZnT2-null mice and characterized the consequences on mammary gland development, function during lactation, and milk composition. We found that ZnT2 was primarily expressed in MECs and to a limited extent in macrophages in the nulliparous mammary gland and loss of ZnT2 impaired mammary expansion during development. Secondly, we found that lactating ZnT2-null mice had substantial defects in mammary gland architecture and MEC function during secretion, including fewer, condensed and disorganized alveoli, impaired Stat5 activation, and unpolarized MECs. Loss of ZnT2 led to reduced milk volume and milk containing less protein, fat, and lactose compared with wild-type littermates, implicating ZnT2 in the regulation of mammary differentiation and optimal milk production during lactation. Together, these results demonstrate that ZnT2-mediated zinc transport is critical for mammary gland function, suggesting that defects in ZnT2 not only reduce milk zinc concentration but may compromise breast health and increase the risk for lactation insufficiency in lactating women.

Keywords: ZnT2; development; differentiation; lactation; mammary gland; secretion; zinc; zinc transporter.


Figures

FIGURE 1.
FIGURE 1.
Verification of ZnT2-null genotype and localization of ZnT2 in the mammary gland. A, targeting strategy used to generate the ZnT2-null mice. A neomycin cassette (Neo) was inserted into the SLC30A2 (ZnT2) gene to eliminate exons 5 and 6; insertion resulted in an Exon5/6 knock-out genotype (ZnT2ko). B, agarose gel of ZnT2 DNA isolated from ear snips for verification of mouse genotype: wt was identified by a product resulting from P1/P2, ZnT2ko was identified by a product resulting from P1/P3, and heterozygotes (Het) were identified by products resulting from both P1/P2 and P1/P3. P1, primer 1; P2, primer 2; P3, primer 3. C, representative immunoblot of ZnT2 expression (green) in total membrane fractions of mammary glands prepared from ZnT2ko mice and their wild-type (wt) littermates. β-Actin (red) served as a loading control. Note the complete absence of ZnT2 in ZnT2ko mice. D, representative images of ZnT2 (red) in the nulliparous (top) and lactating (bottom) mammary glands of wild type (wt) and ZnT2-null (ZnT2ko) mice. Nuclei were counterstained with DAPI (blue). Note the complete absence of ZnT2 detected in mammary glands from nulliparous and lactating ZnT2ko mice. Note the presence of ZnT2 in the MEC of the ducts and alveoli buds and also in the stromal cells in the nulliparous mammary glands. Images of lactating mammary glands, which are naturally depleted of adipocytes, illustrate the substantial amount of ZnT2 expressed in MECs. Magnification, 40×. Scale bar, 100 μm. E, representative images of ZnT2 (red) and F4/80 (green, macrophage marker) in mammary glands of wild-type (wt) mice. Boxed areas in the merged image are enlarged in a, b, and c. Note co-localization (yellow) of ZnT2 and F4/80 around epithelial cells of ducts and alveoli buds. F, representative immunoblot of MMP-9 expression (green) in mammary glands from wt and ZnT2ko mice. β-Actin (red) served as a loading control.
FIGURE 2.
FIGURE 2.
Mammary gland invasion and expansion is impaired in ZnT2-null mice during development. A, representative images of whole mount analysis of mammary glands from nulliparous wild-type (wt) and ZnT2-null (ZnT2ko) mice. Arrows illustrate the ductal length from the lymph node (LN). Solid and dotted lines outline the fat pad and end of the ducts, respectively. Magnification, 4x (stitched images). Scale bar, 2 mm. B, quantification of ductal length in mammary glands from nulliparous wt and ZnT2ko mice. Data represent the mean ± S.D., n = 3 mice/genotype; **, p < 0.01. C, number of lateral branches in a fixed area of whole mount images. Data represent the mean ± S.D., n = 3 mice/genotype; *, p < 0.05. D, representative image of H&E-stained mammary gland sections from nulliparous wt and ZnT2ko mice. Note the lack of ducts, the collapsed ducts, and the larger adipocyte size in ZnT2ko compared with wt mice. Magnification, 10×. Scale bar, 200 μm. E, representative images of Ki-67 positive nuclei (red) in mammary gland sections from nulliparous wt and ZnT2ko mice. Nuclei were counterstained with DAPI (blue). Magnification, 10× (top), 40× (bottom). Scale bar, 100 μm. F, data represent the mean number of Ki-67+ cells ±S.D. in one 10× field; n = 3 mice/genotype; **, p < 0.01. G, representative images of TUNEL staining in mammary gland sections from nulliparous wt and ZnT2ko mice, counterstained with toluene blue. Note the presence of TUNEL-positive cells (arrowheads) in ZnT2ko compared with wt. No antibody (Ab) controls were not incubated with the TUNEL reaction mixture. Magnification, 10× (top), 40× (bottom). Scale bar, 100 μm. H, data represent the mean number of apoptotic cells ±S.D. in five 40× fields of view per section; n = 3 mice/genotype; ***, p < 0.001.
FIGURE 3.
FIGURE 3.
ZnT2 loss reduces MMP-2 activity and increases collagen deposition. A, evaluation of MMP-2 activity by gelatin zymography (Zym; cleared bands) and MMP-2 expression (red) by immunoblotting (IB) in mammary glands from wild-type (wt) and ZnT2-null (ZnT2ko) mice. β-Actin (green) served as a loading control. B, data represent mean gelatin lysis area ±S.D.; n = 4 mice/genotype; *. p < 0.05. The experiment was repeated twice. C, representative image of trichrome staining of mammary gland sections from nulliparous wt and ZnT2ko mice. Note the increase in collagen deposition (blue) around the collapsed ducts in ZnT2ko mice that was not present in wt mice. Magnification, 40×. Scale bar, 100 μm.
FIGURE 4.
FIGURE 4.
Loss of ZnT2 inhibits Zn2+ vesicularization and increases cytoplasmic Zn2+ in the mammary epithelium during lactation. A, zinc concentration was measured in mammary gland by atomic absorption spectroscopy in wild-type (wt) and ZnT2-null (ZnT2ko) mice. Data represent the mean mammary gland (μg of Zn/g of tissue) ±S.D. (wt n = 6 and ZnT2ko n = 4) Zn2+ concentration in nulliparous and lactating mammary glands; *, p < 0.05. B, expression of MT in the mammary gland of lactating wt and ZnT2ko mice. Data represent mean -fold change in MT expression of ZnT2ko mice relative to wt ±S.D.; wt n = 7 and ZnT2ko n = 5; *, p < 0.05. C, representative images of Zinpyr-1 (ZP-1) fluorescence (green) in frozen mammary gland sections from lactating wt and ZnT2ko mice. Nuclei were counterstained with DAPI (blue). Note the lack of punctate zinc fluorescence and the accumulation of zinc fluorescence in the mammary epithelium of ZnT2ko mice. Dotted lines outline the alveolar lumen (L). Magnification, 20× (left), 63× (right). Scale bar, 200 μm. D, representative images of Fluozin-3 fluorescence staining in mock-transfected (Mock) and ZnT2-attenuated (ZnT2KD) MECs. Note punctate vesicular zinc staining in mock and hazy cytoplasmic zinc staining in ZnT2KD. Scale bar, 50 μm.
FIGURE 5.
FIGURE 5.
Lactating ZnT2-null mice have morphological defects in the mammary gland. Whole mount analysis of mammary glands from lactating wild-type (wt; A) and ZnT2-null (ZnT2ko;B) mice is shown. Note the sparse alveolar structures in ZnT2ko compared with wt mice. Magnification, 4×. Scale bar, 200 μm. H&E-stained sections of mammary gland from lactating wt (C and E) and ZnT2ko (D and F) mice. Note the lack of alveoli and disorganization of alveolar structures, preserved adipocytes, and swollen MECs of ZnT2ko mice (D). Note the distended MECs lining the alveoli and lipid droplet accumulation in MEC (white arrowheads) and apoptotic cells (black arrowheads) in the alveolar lumen of ZnT2ko mice (F). Magnification, 10×. Scale bar, 100 μm (C and D); magnification, 40×. Scale bar, 100 μm (E and F). G, analysis of structural irregularity of alveoli in mammary glands from lactating wt and ZnT2ko mice, as measured by the alveolar circularity (0–1 arbitrary units). A representative image of H&E-stained mammary gland sections from lactating wt and ZnT2ko mice is shown. The dotted line illustrates alveolar circularity. Magnification, 40×. Scale bar, 200 μm. H, data represent mean alveolar circularity ±S.D., taken from 40 alveoli/mouse from n = 3 mice/genotype; **, p < 0.01.
FIGURE 6.
FIGURE 6.
Lactating ZnT2-null mice have increased cell turnover due to impaired lactational differentiation. A, representative images of TUNEL in sections of mammary gland from lactating wild-type (wt) and ZnT2-null (ZnT2ko) mice, counterstained with toluene blue. No antibody (Ab) controls were not incubated with TUNEL reaction mixture. Note the presence of TUNEL-positive cells and the extrusion of TUNEL-positive cells into the alveolar lumen (arrowhead) in ZnT2ko mice. Magnification, 40×. Scale bar, 100 μm. B, data represent the mean number of apoptotic cells ±S.D. in five 40× fields of view per section; n = 3 mice/genotype; ***, p < 0.001 C, representative images of Ki-67 positive nuclei (red) in mammary gland sections from lactating wt and ZnT2ko mice. Nuclei were counterstained with DAPI (blue). Magnification, 10× (top), 40× (bottom). Scale bar, 100 μm. D, data represent the mean number of Ki-67+ cells ±S.D. in one 10× field; n = 3 mice/genotype; ***, p < 0.001. E, representative immunoblot of p-Stat3 (green), a marker of involution, and total Stat3 (green) expression in cell lysates of mammary glands from lactating wild-type (wt) and ZnT2-null (ZnT2ko) mice. Involuting mammary gland (Inv.) served as a positive control. Stat3 (green) and β-actin (red) served as a loading control. Note the absence of p-Stat3 expression in both the lactating wt and ZnT2ko mice. F, representative immunoblot of p-Stat5 (green) in cell lysates from mammary glands from lactating wt and ZnT2ko mice. Total Stat5 (green) and β-actin (red) served as loading controls. G, quantification of Stat5 activation. Data represent the mean p-Stat5/total Stat5 ratio ±S.D., n = 4 mice/genotype; *, p < 0.05. The experiment was repeated twice.
FIGURE 7.
FIGURE 7.
ZnT2 attenuation impairs differentiation, milk production, and secretion in MECs in vitro. A, representative immunoblot of p-Stat5 (green) in cell lysates of non-secreting and secreting mock-transfected (Mock) and ZnT2-attenuated (ZnT2KD) MECs. Lactating mammary glands (Lact. mg) served as a positive control. Total Stat5 (green) and β-actin (red) served as loading controls. B, representative immunoblot of β-casein (green) in cell lysates and CM of Mock and ZnT2KD MECs. Lactating mammary glands (Lact. mg) served as a positive control, and β-actin (red) served as a loading control. C, quantification of β-casein expression in cell lysates of mock and ZnT2KD MECs. Data represent mean protein abundance normalized to total protein (band intensity/μg of protein) ±S.D., n = 3 samples/group; **, p < 0.01. D, percentage of β-casein that was secreted and calculated using the following formula: % secreted = (BSI of β-casein in CM)/(BSI of β-casein in CM+BSI of β-casein in lysate). Data represent the mean secreted β-casein (%) ±S.D., n = 3 samples/group; **, p < 0.01.
FIGURE 8.
FIGURE 8.
Lactating ZnT2-null mice have defects in MEC substructure. Transmission electron micrographs of mammary glands from lactating wild-type (wt) (A) and ZnT2-null (ZnT2ko) (B) mice. Magnification, 500×; scale bar = 2 μm. Note the formation of pseudolumina on the apical membrane (circle) and the presence of apoptotic cells in the alveolar lumen (dotted circle) in sections from ZnT2ko mice. Enlarged images of subcellular structures: apical membrane (C and H), mitochondria (D and I), rough endoplasmic reticulum (RER; E and J), secretory vesicles (F and K) and lipid droplets (G and L) in wt (C–G) and ZnT2ko (H–L) mice. Scale bar, 2 μm.
FIGURE 9.
FIGURE 9.
Compromised milk secretion in lactating ZnT2-null dams affect offspring survival. A, quantification of zinc concentration in milk from lactating wild-type (wt) and ZnT2-null (ZnT2ko) mice. Data represent the mean milk zinc concentration (μmol/liter) ±S.D., n = 5 mice/genotype; *, p < 0.05. B, quantification of β-casein levels in milk from lactating wt and ZnT2ko mice. Data represent the mean β-casein abundance normalized to total protein level (BSI/μg of protein) ±S.D., n = 5 mice/genotype; *, p < 0.05. C, quantification of fat levels in milk from lactating wt and ZnT2ko mice. Data represent mean fat (%) ±S.D., n = 5/genotype; **, p < 0.01. D, quantification of lactose concentration in milk from wt and ZnT2ko mice. Data represent mean milk lactose concentration (mg/ml) ±S.D., wt n = 10 mice and ZnT2ko n = 5 mice; *, p < 0.05. E, milk volume calculated as the difference between litter weight before and after suckling on LD5 and LD10 in wild-type (wt) and ZnT2-null (ZnT2ko) mice. Data represent mean milk yield (g) ±S.D. wt n = 10 litters, and ZnT2ko n = 5 litters); *, p < 0.05. F, pie graph of the percentage of dams maintaining the indicated litter size at LD10: no survivor, 1–3 pups, 4 or 5 pups and 6+ pups. Note the large percentage (∼50%) of ZnT2ko dams failing to maintain a litter up to LD10.

Similar articles

Cited by

References

    1. Neville M. C. (2009) Introduction: tight junctions and secretory activation in the mammary gland. J. Mammary Gland Biol. Neoplasia 14, 269–270 - PubMed
    1. Brisken C., Rajaram R. D. (2006) Alveolar and lactogenic differentiation. J. Mammary Gland Biol. Neoplasia 11, 239–248 - PubMed
    1. Bostanci Z., Mack R. P., Jr., Lee S., Soybel D. I., Kelleher S. L. (2014) Paradoxical zinc toxicity and oxidative stress in the mammary gland during marginal dietary zinc deficiency. Reprod. Toxicol. 10.1016/j.reprotox.2014.07.076 - DOI - PMC - PubMed
    1. Mutch P. B., Hurley L. S. (1980) Mammary gland function and development: effect of zinc deficiency in rat. Am. J. Physiol. 238, E26–E31 - PubMed
    1. Dempsey C., McCormick N. H., Croxford T. P., Seo Y. A., Grider A., Kelleher S. L. (2012) Marginal maternal zinc deficiency in lactating mice reduces secretory capacity and alters milk composition. J. Nutr. 142, 655–660 - PMC - PubMed

Publication types

LinkOut - more resources