Adaptive Modifications of Muscle Phenotype in High-Altitude Deer Mice Are Associated with Evolved Changes in Gene Regulation
- PMID: 25851956
- PMCID: PMC4592356
- DOI: 10.1093/molbev/msv076
Adaptive Modifications of Muscle Phenotype in High-Altitude Deer Mice Are Associated with Evolved Changes in Gene Regulation
Abstract
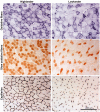
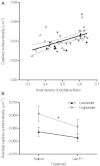
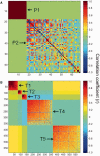
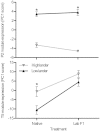
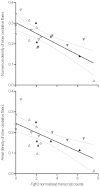
At high-altitude, small mammals are faced with the energetic challenge of sustaining thermogenesis and aerobic exercise in spite of the reduced O2 availability. Under conditions of hypoxic cold stress, metabolic demands of shivering thermogenesis and locomotion may require enhancements in the oxidative capacity and O2 diffusion capacity of skeletal muscle to compensate for the diminished tissue O2 supply. We used common-garden experiments involving highland and lowland deer mice (Peromyscus maniculatus) to investigate the transcriptional underpinnings of genetically based population differences and plasticity in muscle phenotype. We tested highland and lowland mice that were sampled in their native environments as well as lab-raised F1 progeny of wild-caught mice. Experiments revealed that highland natives had consistently greater oxidative fiber density and capillarity in the gastrocnemius muscle. RNA sequencing analyses revealed population differences in transcript abundance for 68 genes that clustered into two discrete transcriptional modules, and a large suite of transcripts (589 genes) with plastic expression patterns that clustered into five modules. The expression of two transcriptional modules was correlated with the oxidative phenotype and capillarity of the muscle, and these phenotype-associated modules were enriched for genes involved in energy metabolism, muscle plasticity, vascular development, and cell stress response. Although most of the individual transcripts that were differentially expressed between populations were negatively correlated with muscle phenotype, several genes involved in energy metabolism (e.g., Ckmt1, Ehhadh, Acaa1a) and angiogenesis (Notch4) were more highly expressed in highlanders, and the regulators of mitochondrial biogenesis, PGC-1α (Ppargc1a) and mitochondrial transcription factor A (Tfam), were positively correlated with muscle oxidative phenotype. These results suggest that evolved population differences in the oxidative capacity and capillarity of skeletal muscle involved expression changes in a small suite of coregulated genes.
Keywords: RNA-seq; capillarity; hypoxia adaptation; muscle fiber type; oxygen transport; physiological genomics.
© The Author 2015. Published by Oxford University Press on behalf of the Society for Molecular Biology and Evolution. All rights reserved. For permissions, please e-mail: journals.permissions@oup.com.
Figures



Comment in
-
Into Thin Air and Back: Deer Mouse Study Examines High-Altitude Adaptation.Mol Biol Evol. 2015 Aug;32(8):2217. doi: 10.1093/molbev/msv100. Epub 2015 May 22. Mol Biol Evol. 2015. PMID: 26002955 Free PMC article. No abstract available.
Similar articles
-
Chronic cold exposure induces mitochondrial plasticity in deer mice native to high altitudes.J Physiol. 2020 Dec;598(23):5411-5426. doi: 10.1113/JP280298. Epub 2020 Sep 14. J Physiol. 2020. PMID: 32886797 Free PMC article.
-
High-altitude ancestry and hypoxia acclimation have distinct effects on exercise capacity and muscle phenotype in deer mice.Am J Physiol Regul Integr Comp Physiol. 2015 May 1;308(9):R779-91. doi: 10.1152/ajpregu.00362.2014. Epub 2015 Feb 18. Am J Physiol Regul Integr Comp Physiol. 2015. PMID: 25695288 Free PMC article.
-
Evolved changes in phenotype across skeletal muscles in deer mice native to high altitude.Am J Physiol Regul Integr Comp Physiol. 2024 Apr 1;326(4):R297-R310. doi: 10.1152/ajpregu.00206.2023. Epub 2024 Feb 19. Am J Physiol Regul Integr Comp Physiol. 2024. PMID: 38372126 Free PMC article.
-
The Mitochondrial Basis for Adaptive Variation in Aerobic Performance in High-Altitude Deer Mice.Integr Comp Biol. 2018 Sep 1;58(3):506-518. doi: 10.1093/icb/icy056. Integr Comp Biol. 2018. PMID: 29873740 Review.
-
Evolved Mechanisms of Aerobic Performance and Hypoxia Resistance in High-Altitude Natives.Annu Rev Physiol. 2019 Feb 10;81:561-583. doi: 10.1146/annurev-physiol-021317-121527. Epub 2018 Sep 26. Annu Rev Physiol. 2019. PMID: 30256727 Review.
Cited by
-
Chromosome-Level Alpaca Reference Genome VicPac3.1 Improves Genomic Insight Into the Biology of New World Camelids.Front Genet. 2019 Jun 21;10:586. doi: 10.3389/fgene.2019.00586. eCollection 2019. Front Genet. 2019. PMID: 31293619 Free PMC article.
-
Nascent transcription reveals regulatory changes in extremophile fishes inhabiting hydrogen sulfide-rich environments.Proc Biol Sci. 2024 Jun;291(2025):20240412. doi: 10.1098/rspb.2024.0412. Epub 2024 Jun 19. Proc Biol Sci. 2024. PMID: 38889788 Free PMC article.
-
Regulation of muscle pyruvate dehydrogenase activity and fuel use during exercise in high-altitude deer mice.J Exp Biol. 2024 Aug 15;227(16):jeb246890. doi: 10.1242/jeb.246890. Epub 2024 Aug 20. J Exp Biol. 2024. PMID: 39054898 Free PMC article.
-
Genetic approaches in comparative and evolutionary physiology.Am J Physiol Regul Integr Comp Physiol. 2015 Aug 1;309(3):R197-214. doi: 10.1152/ajpregu.00100.2015. Epub 2015 Jun 3. Am J Physiol Regul Integr Comp Physiol. 2015. PMID: 26041111 Free PMC article. Review.
-
Characterization of pig skeletal muscle transcriptomes in response to low temperature.Vet Med Sci. 2023 Jan;9(1):181-190. doi: 10.1002/vms3.1025. Epub 2022 Dec 8. Vet Med Sci. 2023. PMID: 36480456 Free PMC article.
References
-
- Audet GN, Meek TH, Garland T, Jr, Olfert IM. Expression of angiogenic regulators and skeletal muscle capillarity in selectively bred high aerobic capacity mice. Exp Physiol. 2011;96:1138–1150. - PubMed
-
- Beaudry JL, McClelland GB. Thermogenesis in CD-1 mice after combined chronic hypoxia and cold acclimation. Comp Biochem Physiol B Biochem Mol Biol. 2010;157:301–309. - PubMed
-
- Benjamini Y, Hochberg Y. Controlling the false discovery rate: a practical and powerful approach to multiple testing. J R Stat Soc B. 1995;57:289–300.
Publication types
MeSH terms
Substances
Grants and funding
LinkOut - more resources
Full Text Sources
Other Literature Sources
Miscellaneous

