. 2015 Apr 7;8(371):rs2.
doi: 10.1126/scisignal.2005966.

An analysis of critical factors for quantitative immunoblotting

Affiliations

An analysis of critical factors for quantitative immunoblotting

Kevin A Janes. Sci Signal. .

Abstract

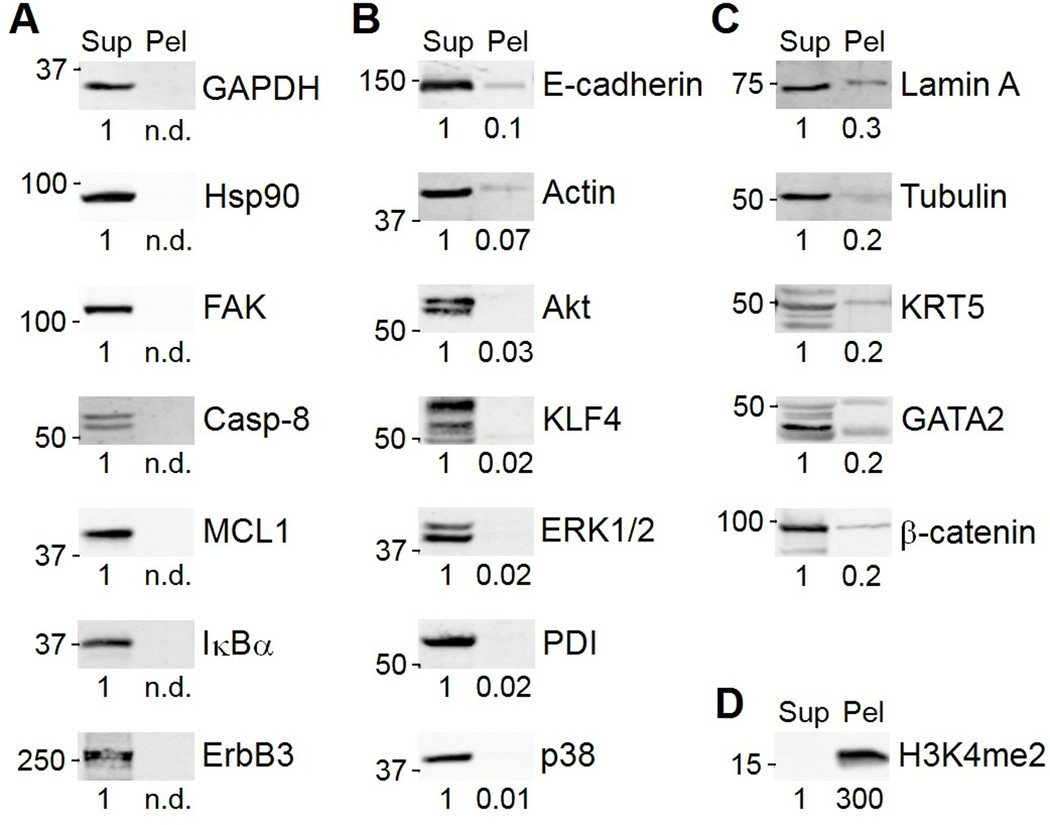
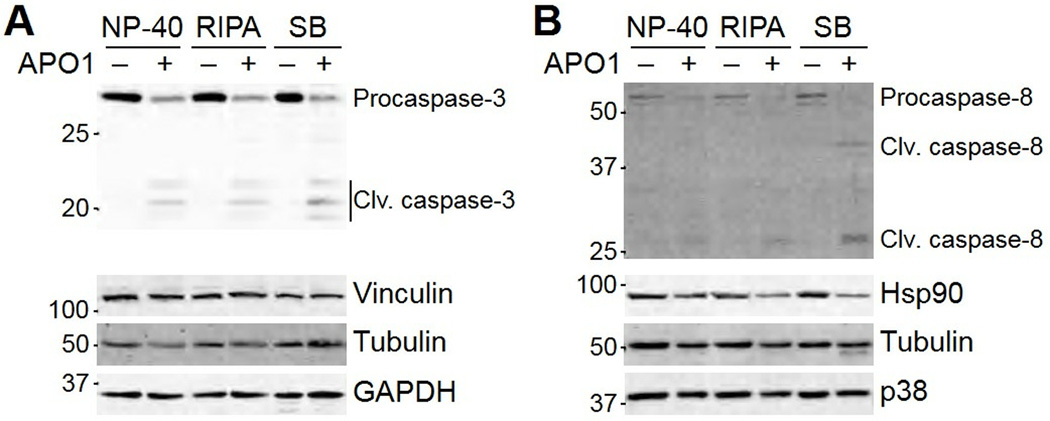
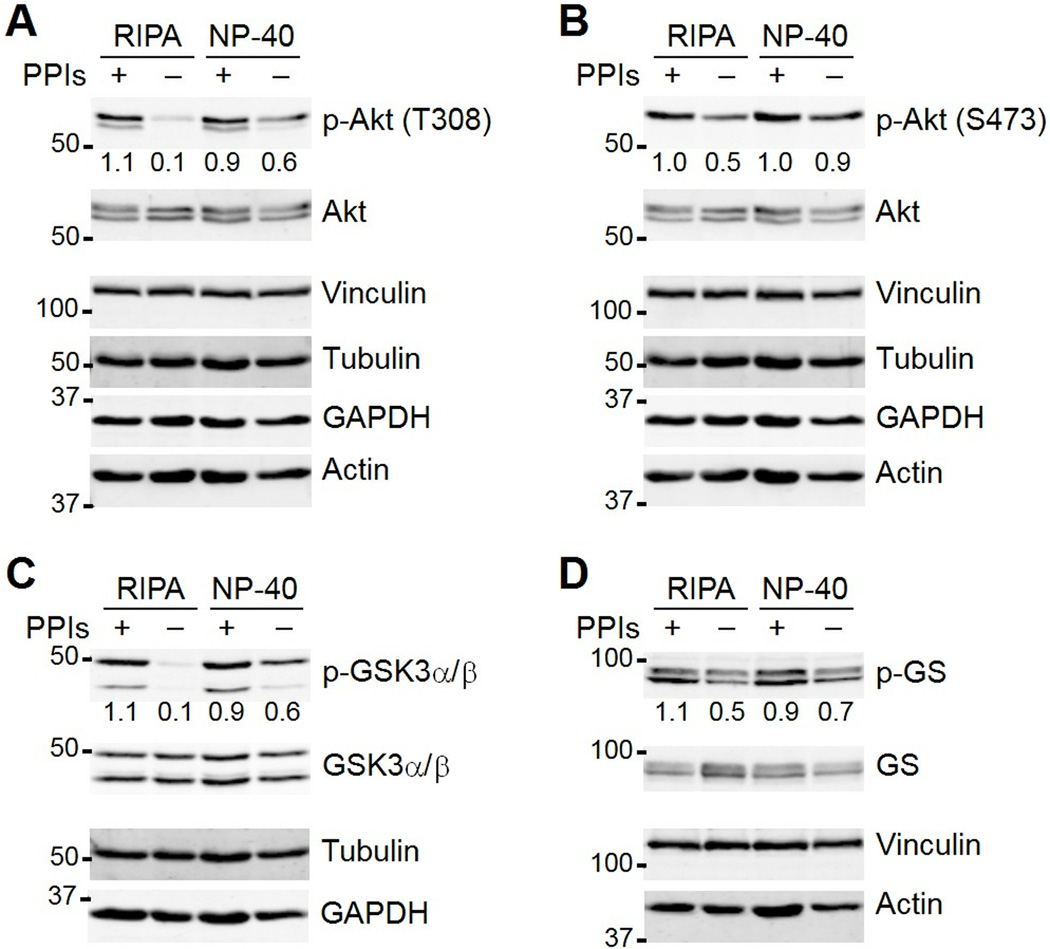
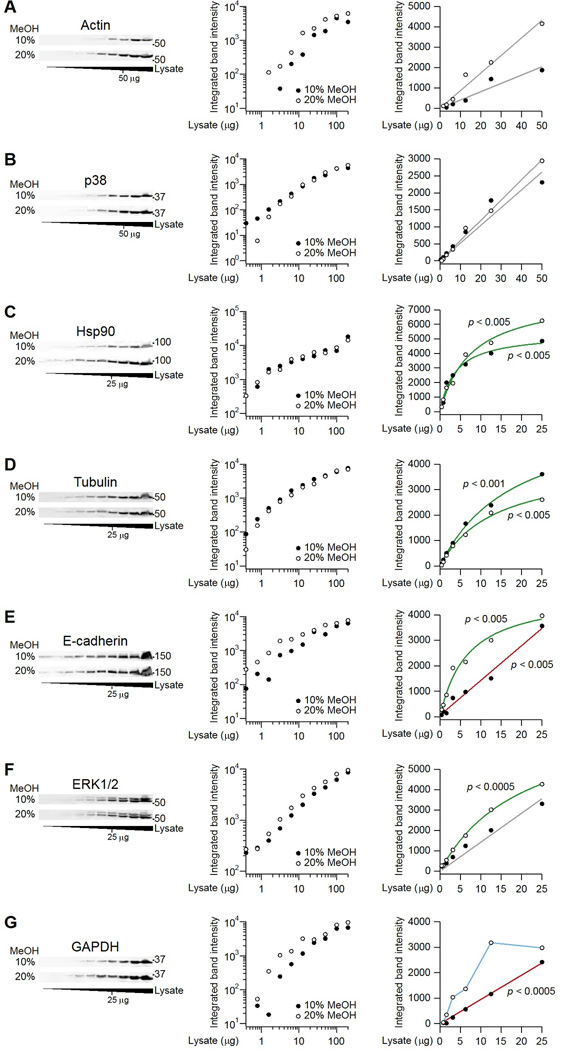
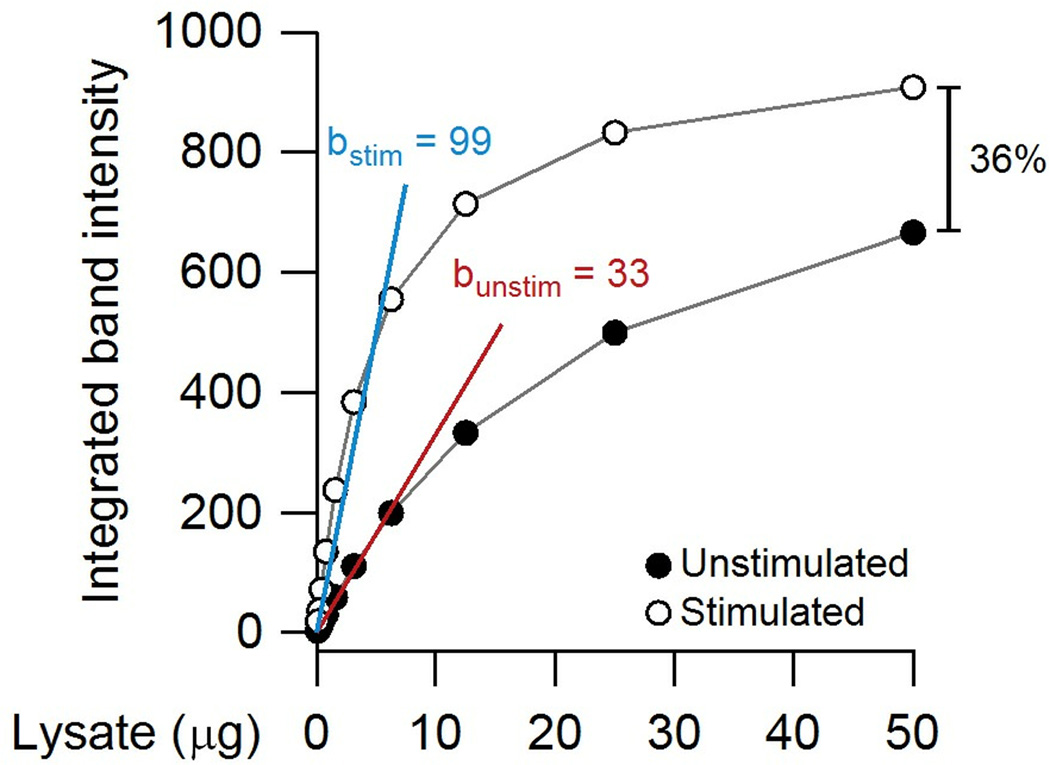
Immunoblotting (also known as Western blotting) combined with digital image analysis can be a reliable method for analyzing the abundance of proteins and protein modifications, but not every immunoblot-analysis combination produces an accurate result. I illustrate how sample preparation, protocol implementation, detection scheme, and normalization approach profoundly affect the quantitative performance of immunoblotting. This study implemented diagnostic experiments that assess an immunoblot-analysis workflow for accuracy and precision. The results showed that ignoring such diagnostics can lead to pseudoquantitative immunoblot data that markedly overestimate or underestimate true differences in protein abundance.


Figures

Fig. 1
Fig. 1
Radioimmunoprecipitation assay (RIPA) buffer solubilizes many, but not all, cellular proteins. (A) Examples of proteins that are entirely solubilized (100% in the supernatant, Sup). (B) Examples of proteins that are mostly solubilized (>90% Sup). (C) Examples of proteins that are partially solubilized (≤90% Sup). (D) Dimethyl-lysine 4 histone H3 (H3K4me2) resides almost entirely in the RIPA-insoluble pellet (Pel). Band intensities were quantified from the 16-bit digital image by densitometry in ImageJ and are shown normalized to the Sup lane for each target. n.d., not detected. Data are representative of 2–4 experiments.
Fig. 2
Fig. 2
Posttranslational modifications can move protein into the insoluble fraction of common lysis buffers. MCF10A-5E cells were exposed to the Fas crosslinking agent anti-APO-1 (1 µg/ml) (48) for 24 hours, then floating and adherent cells were lysed in NP-40 lysis buffer, RIPA buffer, or dithiothreitol-containing Laemmli sample buffer (SB). (A) Effect of solubilization conditions on the detection of cleavage products of caspase-3. (B) Effect of solubilization conditions on the detection of cleavage products of caspase-8. Vinculin, tubulin, GAPDH, Hsp90, and p38 were used as loading controls where indicated. Data are representative of three experiments.
Fig. 3
Fig. 3
Phosphatase inhibitors are critical to preserve certain phosphorylated residues under certain lysis conditions. (A, B) Effect of lysis buffer and presence or absence of phosphatase inhibitors (PPIs) on the detection of phosphorylated Akt (p-Akt) on Thr308 (T308) and Ser473 (S473). (C) Effect of lysis buffer and presence or absence of PPIs on detection of glycogen synthase kinase-3α/β phosphorylated on Ser21 and Ser9 (p-GSK3α/β). (D) Effect of lysis buffer and presence or absence of PPIs on detection of glycogen synthase phosphorylated on Ser641 (p-GS). AC16 cells were lysed in RIPA or NP-40 lysis buffer with or without PPIs. Vinculin, tubulin, GAPDH, and actin were used as loading controls where indicated. Total Akt, GSK3α/β, and GS were used to monitor specific changes in protein abundance. Band intensities were quantified from the 16-bit digital image by densitometry in ImageJ and are shown normalized to the average +PPI conditions for each target across both lysis conditions. Data are representative of two experiments.
Fig. 4
Fig. 4
Linearity and hyperbolic saturation of immunoblots determined by serial dilution. (A and B) Immunoblots for actin and p38 are linear under both transfer conditions. (C and D) Immunoblots for Hsp90 and tubulin are hyperbolically saturated under both transfer conditions. (E to G) Linear detection of immunoblots for E-cadherin, ERK1/2, and GAPDH occurred with tank transfer conditions containing 10% methanol. HT-29 cells were lysed in RIPA buffer, immunoblotted for the indicated targets, and imaged. Left panels show the immunoblots, middle panels show log-log plots of the quantified band intensities from the blots on the left, and the right panels show linear plots of the same data. Linear fits are gray when the hyperbolic model is no better than the linear model for that transfer condition. Linear fits are red when the linear fit of the associated transfer condition is better than the linear fit of the other transfer condition. Hyperbolic fits are green when the hyperbolic model is better than the linear model for that transfer condition. Data are in blue when neither the linear nor the hyperbolic model provides a better fit. Model comparisons were done by the F test (FDR = 5%; n = 5–8 dilutions). See file S1 for raw images and calculations.
Fig. 5
Fig. 5
Quantitative immunoblotting is challenging when imaging by chemiluminescence. (A to C) HT-29 lysates were prepared as in Fig. 4, immunoblotted for the indicated proteins, and imaged by IRDye fluorescence, enhanced chemiluminescence (ECL), or SuperSignal West Femto chemiluminescence as described (12, 16, 45, 46). Linear fits are shown in gray when the hyperbolic model is not significantly better than the linear model for that imaging condition. Linear fits are shown in red when the linear fit of the associated imaging condition is significantly better than the linear fit of the other imaging conditions. Hyperbolic fits are shown in green when the hyperbolic model is significantly better than the linear model for that imaging condition. Data are interpolated in blue when neither the linear nor the hyperbolic model provides a better fit. All model comparisons were done by the F test at a false-discovery rate of 5% (n = 4–8 dilutions). See file S2 for raw images and calcuations.
Fig. 6
Fig. 6
Reproducibility of quantitative immunoblots across biological replicates is improved after normalization to multiple loading controls. (A) Representative immunoblot for phosphorylated Smad2 on Ser245/250/255 (p-Smad2 linker) in MCF10A-5E cells stimulated with 50 ng/ml TGFβ for 30 minutes with or without 1 hour preincubation with 300 nM flavopiridol. Tubulin, Hsp90, GAPDH, and p38 were used as loading controls. Total Smad2 was used to monitor overall changes in protein abundance and served as a fifth candidate loading control for this analysis. (B) Raw p-Smad2 linker densitometry quantified in ImageJ. (C) Decrease in the coefficient of variation among p-Smad2 biological replicates with increasing numbers of loading controls. The best (GAPDH) and worst (tubulin) single loading-control normalizations are highlighted. (D) p-Smad2 linker densitometry after normalization to the mean band intensity of tubulin, Hsp90, GAPDH, p38, and total Smad2 for each biological replicate. For B and D, data are shown as the mean ± SE. of n = 4 biological replicates, with differences in means assessed by Welch’s two-sided t test. For C, data are shown as the mean coefficient of variation ± SD. of n = 1–10 possible normalization combinations for the indicated number of loading controls. See file S3 for raw images and calculations.
Fig. 7
Fig. 7
Membrane stripping and reprobing is a quantitative tradeoff between antibody removal and total protein loss. (A) Replicate immunoblots for phosphorylated ERK1/2 phosphorylated on Thr202 and Tyr204 of ERK1 or Thr185 and Tyr187 of ERK2 (p-ERK1/2) in AC16 cells stimulated with 100 ng/ml EGF for 5 minutes. GAPDH and tubulin were used as loading controls in the first immunoblot. (B) Reprobe of the membrane in A for total ERK1/2 after stripping with glycine buffer, guanidinium, or β-mercaptoethanol (βME) stripping buffer. Vinculin, Hsp90, and actin were used as loading controls for the reprobed blots. (C) Two-color fluorescence immunoblot for p-ERK1/2 (green) and total ERK1/2 (magenta) of the same lysates as in A. Vinculin and Hsp90 were used as loading controls. (D) Direct immunoblot for total ERK1/2 of the same lysates as in A. A lower percentage polyacrylamide gel was used in C and D to emphasize the total ERK1/2 upshift after stimulation with EGF. GAPDH, vinculin, Hsp90, and tubulin were used as loading controls. Data are representative of two experiments.
Fig. 8
Fig. 8
Workflow for absolute protein quantification. (A) Serial dilution of an albumin standard to calibrate recombinant purifications of GST-ERK2 and GST-p38 by Coomassie staining. (B) Albumin band intensity (black) plotted as a function of protein and fit to a hyperbolic model (gray) that infers the amounts of GST-ERK2 (green) and GST-p38 (purple) protein. (C) HT-29 and AC16 cells have roughly equal protein constituents by mass based on the amount of Hsp90, vinculin, tubulin, GAPDH, and actin detected in 25 µg of each sample. (D) Serial dilution of the GST-ERK2 standard to calibrate endogenous abundances of ERK2 in HT-29 and AC16 cells. (E) GST-ERK2 band intensity (black) plotted as a function of protein input and fit to a hyperbolic model (gray) that infers the amount of ERK2 in HT-29 cells (blue) and AC16 cells (red). (F) Serial dilution of the GST-p38 standard to calibrate endogenous abundances of p38 in HT-29 and AC16 cells. (E) GST-p38 band intensity (black) plotted as a function of protein input and fit to a hyperbolic model (gray). The model was used to infer the amount of ERK2 in HT-29 cells (blue) and AC16 cells (red). Data are representative of two experiments. See file S4 for raw images and calculations.
Fig. 9
Fig. 9
Quantifying partially saturated immunoblots can dramatically underestimate differences between samples. In this theoretical example, a serial dilution is performed with unstimulated and stimulated extracts. The relative change in the linear range of the immunoblot is 99 (blue) /33 (red) ~ threefold, whereas the relative change at fivefold higher loading is only 1.4 fold (36%).

References

    1. Green MR, Sambrook J. Molecular cloning: a laboratory manual. ed. 4th. Cold Spring Harbor, NY: Cold Spring Harbor Laboratory Press; 2012. p. 1890.
    1. Taylor SC, Posch A. The design of a quantitative western blot experiment. Biomed Res Int. 2014;2014:361590. - PMC - PubMed
    1. Taylor SC, Berkelman T, Yadav G, Hammond M. A defined methodology for reliable quantification of Western blot data. Mol Biotechnol. 2013;55:217–226. - PMC - PubMed
    1. Towbin H, Staehelin T, Gordon J. Electrophoretic transfer of proteins from polyacrylamide gels to nitrocellulose sheets: procedure and some applications. Proc Natl Acad Sci U S A. 1979;76:4350–4354. - PMC - PubMed
    1. Schneider CA, Rasband WS, Eliceiri KW. NIH Image to ImageJ: 25 years of image analysis. Nat Methods. 2012;9:671–675. - PMC - PubMed

Publication types