

Effects of Dietary n-3 Fatty Acids on Hepatic and Peripheral Insulin Sensitivity in Insulin-Resistant Humans
- PMID: 25852206
- PMCID: PMC4477338
- DOI: 10.2337/dc14-3101
Effects of Dietary n-3 Fatty Acids on Hepatic and Peripheral Insulin Sensitivity in Insulin-Resistant Humans
Abstract
Objective: Dietary n-3 polyunsaturated fatty acids, including eicosapentaenoic acid (EPA) and docosahexaenoic acid (DHA), prevent insulin resistance and stimulate mitochondrial biogenesis in rodents, but the findings of translational studies in humans are thus far ambiguous. The aim of this study was to evaluate the influence of EPA and DHA on insulin sensitivity, insulin secretion, and muscle mitochondrial function in insulin-resistant, nondiabetic humans using a robust study design and gold-standard measurements.
Research design and methods: Thirty-one insulin-resistant adults received 3.9 g/day EPA+DHA or placebo for 6 months in a randomized double-blind study. Hyperinsulinemic-euglycemic clamp with somatostatin was used to assess hepatic and peripheral insulin sensitivity. Postprandial glucose disposal and insulin secretion were measured after a meal. Measurements were performed at baseline and after 6 months of treatment. Abdominal fat distribution was evaluated by MRI. Muscle oxidative capacity was measured in isolated mitochondria using high-resolution respirometry and noninvasively by magnetic resonance spectroscopy.
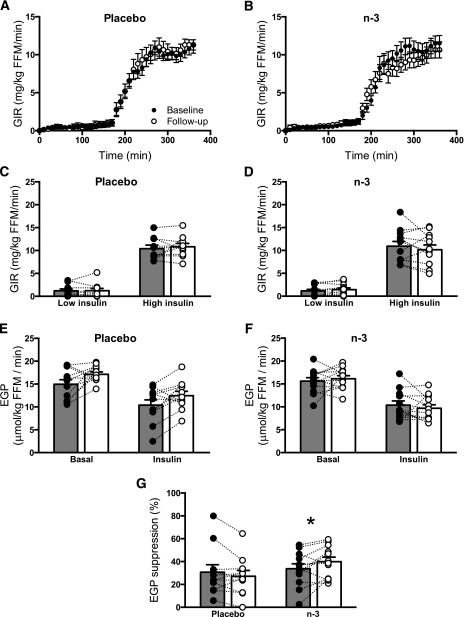
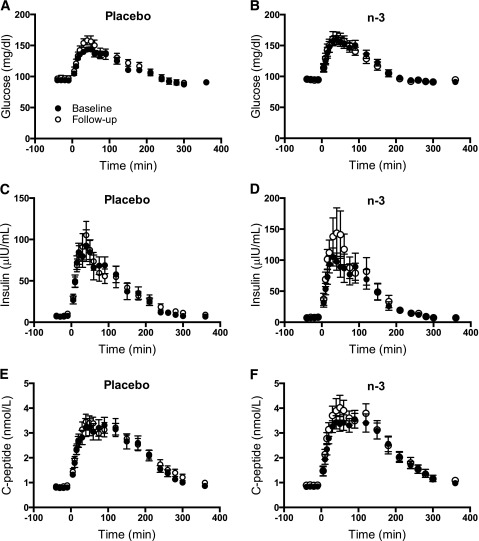
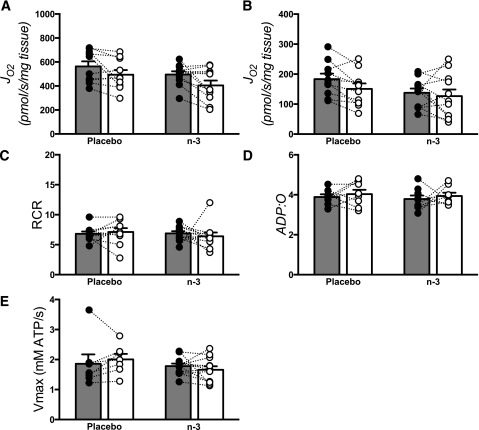
Results: Compared with placebo, EPA+DHA did not alter peripheral insulin sensitivity, postprandial glucose disposal, or insulin secretion. Hepatic insulin sensitivity, determined from the suppression of endogenous glucose production by insulin, exhibited a small but significant improvement with EPA+DHA compared with placebo. Muscle mitochondrial function was unchanged by EPA+DHA or placebo.
Conclusions: This study demonstrates that dietary EPA+DHA does not improve peripheral glucose disposal, insulin secretion, or skeletal muscle mitochondrial function in insulin-resistant nondiabetic humans. There was a modest improvement in hepatic insulin sensitivity with EPA+DHA, but this was not associated with any improvements in clinically meaningful outcomes.
Trial registration: ClinicalTrials.gov NCT01686568.
© 2015 by the American Diabetes Association. Readers may use this article as long as the work is properly cited, the use is educational and not for profit, and the work is not altered.
Figures
References
Publication types
MeSH terms
Substances
Associated data
Grants and funding
LinkOut - more resources
Full Text Sources
Other Literature Sources
Medical
Research Materials
