. 2015 Mar 12:10:127.
doi: 10.1186/s11671-015-0835-1. eCollection 2015.

Direct patterning of gold nanoparticles using flexographic printing for biosensing applications

Affiliations

Direct patterning of gold nanoparticles using flexographic printing for biosensing applications

Jamie Benson et al. Nanoscale Res Lett. .

Abstract

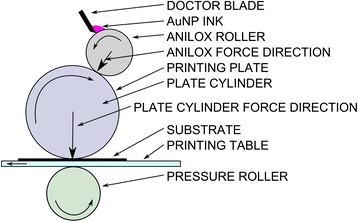
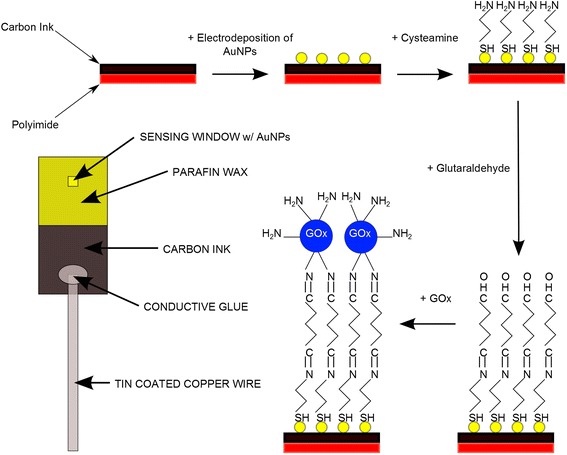
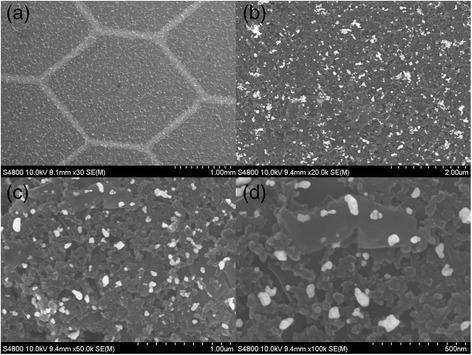
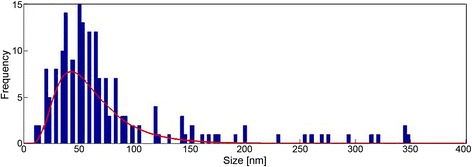
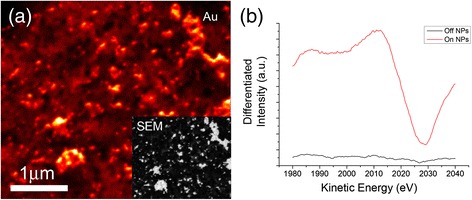
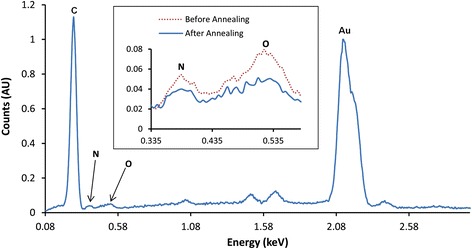
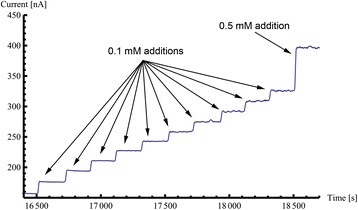
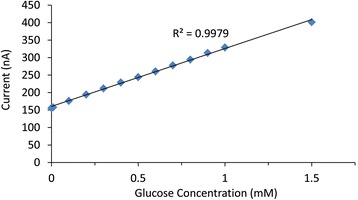
In this paper, we have presented the use of flexographic printing techniques in the selective patterning of gold nanoparticles (AuNPs) onto a substrate. Highly uniform coverage of AuNPs was selectively patterned on the substrate surface, which was subsequently used in the development of a glucose sensor. These AuNPs provide a biocompatible site for the attachment of enzymes and offer high sensitivity in the detection of glucose due to their large surface to volume ratio. The average size of the printed AuNPs is less than 60 nm. Glucose sensing tests were performed using printed carbon-AuNP electrodes functionalized with glucose oxidase (GOx). The results showed a high sensitivity of 5.52 μA mM(-1) cm(-2) with a detection limit of 26 μM. We have demonstrated the fabrication of AuNP-based biosensors using flexographic printing, which is ideal for low-cost, high-volume production of the devices.

Keywords: Biosensors 87.85.fk; Nanostructured materials in electrochemistry 82.45.Yz; Surface patterning 81.65.Cf.


Figures

Figure 1
Figure 1
Schematic diagram of a flexographic printer. Ink is transferred to the printing plate from the anilox roller at a rate controlled by the anilox surface features and the doctor blade. Ink is then printed onto the substrate from the printing plate in a continuous roll-to-roll manner.
Figure 2
Figure 2
Schematic diagram showing the functionalisation scheme. The scheme shows the major steps in the functionalisation scheme for AuNPs on carbon electrode. Starting with the printed carbon electrode AuNPs are printed and functionalized with cysteamine, glutaraldehyde and glucose oxidase, also included is a schematic of a fully prepared electrode for biosensing (left).
Figure 3
Figure 3
Images showing the contact angles of inks and for comparison, water. Images showing contact angles for (a) water, (b) AuNP ink + 0.5 g PVP and (c) AuNP ink, after drop casting onto printed carbon substrates. The images show contact angles of (a) 135°, (b) 42°, and (c) 6°, respectively, showing improved wetting by the AuNP ink.
Figure 4
Figure 4
SEM image of printed AuNP ink on carbon electrodes showing the pattering of the particles. (a) SEM characterisation shows well-defined patterning of the AuNP ink in a printed honeycomb pattern on carbon electrodes, at low magnification (30×). Higher magnification images (b) 20, (c) 50 and (d) 100 kx show the even distribution of the AuNPs on the surface.
Figure 5
Figure 5
Histogram showing AuNP size distribution on carbon electrode. After flexographic printing of the AuNP ink, particle size analysis was carried out on a 50-kx magnification SEM image of the particles. This analysis shows that the majority of the particles are less than 60 nm in size.
Figure 6
Figure 6
Scanning auger microscopy analysis of printed AuNPs on carbon electrode. (a) Scanning auger microscopy image of AuNPs using peak intensity from the centre of the Au peak (inset shows SEM image of corresponding area). (b) Differentiated spectra taken from areas on the AuNPs (red) and off of the AuNPs (black).
Figure 7
Figure 7
EDX spectrum of printed AuNPs at carbon electrode before and after annealing. Energy dispersive X-ray analysis of the AuNPs printed onto a carbon electrode shows carbon, gold, nitrogen and oxygen. The inset shows nitrogen and oxygen peaks before (red) and after (blue) annealing, indicating a reduction in nitrogen and oxygen peaks due to the annealing process.
Figure 8
Figure 8
Chronoamperometric graph showing fabricated polyimide-carbon-AuNP-GOx electrode response to glucose additions. After functionalisation, samples were tested for the electrochemical detection of glucose. These samples where tested with glucose concentration step increments of 0.1 and 0.5 mM as detailed in the figure.
Figure 9
Figure 9
Calibration curve for the polyimide-carbon-AuNP-GOx electrode responding to glucose. Plot of steady state current against concentration of glucose taken from the chronoamperometric data for a polyimide-carbon-AuNP-GOx electrode. The graph shows the linear response of the electrode for glucose additions up to 1.5 mM.

References

    1. Ghosh P, Han G, De M, Kim CK, Rotello VM. Gold nanoparticles in delivery applications. Adv Drug Deliv Rev. 2008;60:1307–15. doi: 10.1016/j.addr.2008.03.016. - DOI - PubMed
    1. El-Sayed IH, Huang XH, El-Sayed MA. Surface plasmon resonance scattering and absorption of anti-EGFR antibody conjugated gold nanoparticles in cancer diagnostics: applications in oral cancer. Nano Lett. 2005;5:829–34. doi: 10.1021/nl050074e. - DOI - PubMed
    1. Murphy CJ, Gole AM, Stone JW, Sisco PN, Alkilany AM, Goldsmith EC. Gold nanoparticles in biology: beyond toxicity to cellular imaging. Acc Chem Res. 2008;41:1721–30. doi: 10.1021/ar800035u. - DOI - PubMed
    1. Cao YC, Jin RC, Nam JM, Thaxton CS, Mirkin CA. Raman dye-labeled nanoparticle probes for proteins. J Am Chem Soc. 2003;125:14676–7. doi: 10.1021/ja0366235. - DOI - PubMed
    1. Wang J. Electrochemical biosensing based on noble metal nanoparticles. Microchim Acta. 2012;177:245–70. doi: 10.1007/s00604-011-0758-1. - DOI

LinkOut - more resources