. 2015 Mar 18:9:75.
doi: 10.3389/fncel.2015.00075. eCollection 2015.

The neural stem cell fate determinant TRIM32 regulates complex behavioral traits

Affiliations

The neural stem cell fate determinant TRIM32 regulates complex behavioral traits

Anna-Lena Hillje et al. Front Cell Neurosci. .

Abstract

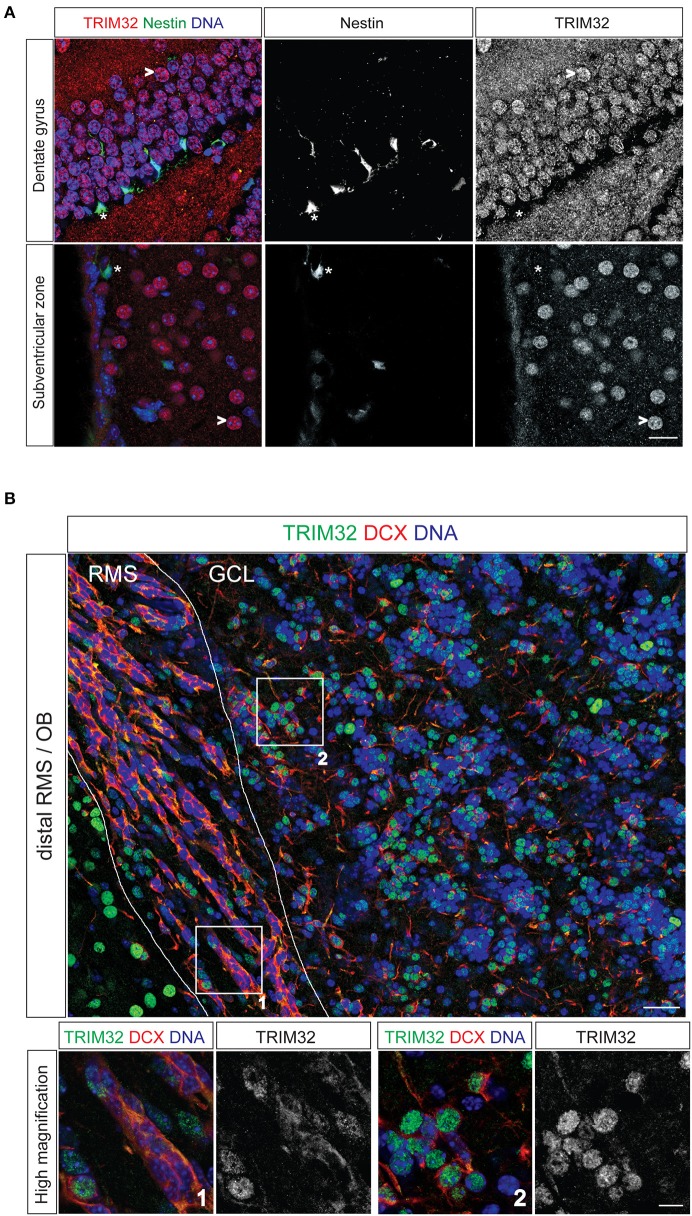
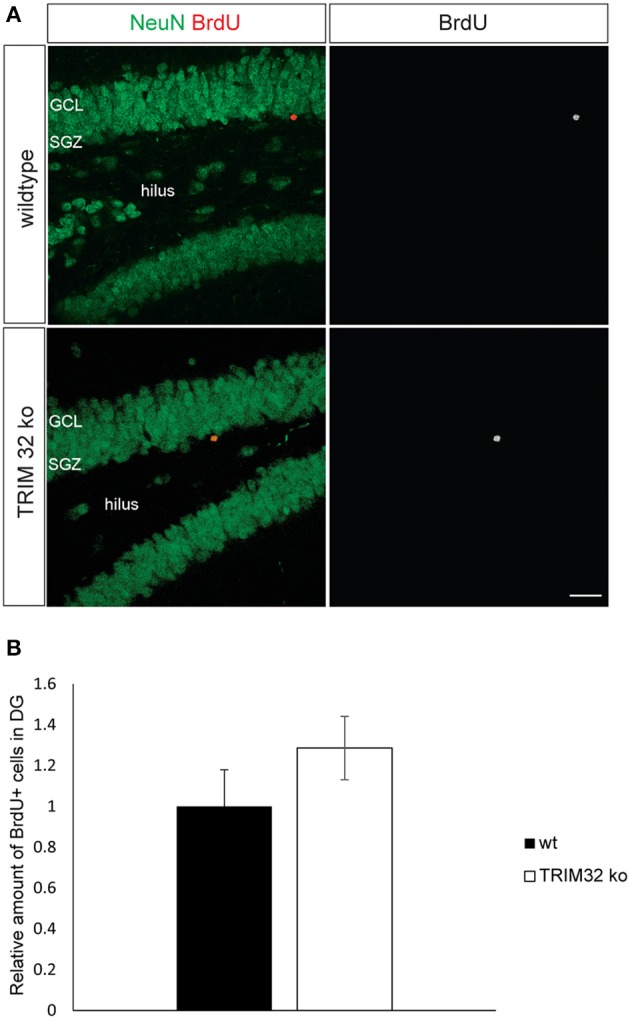
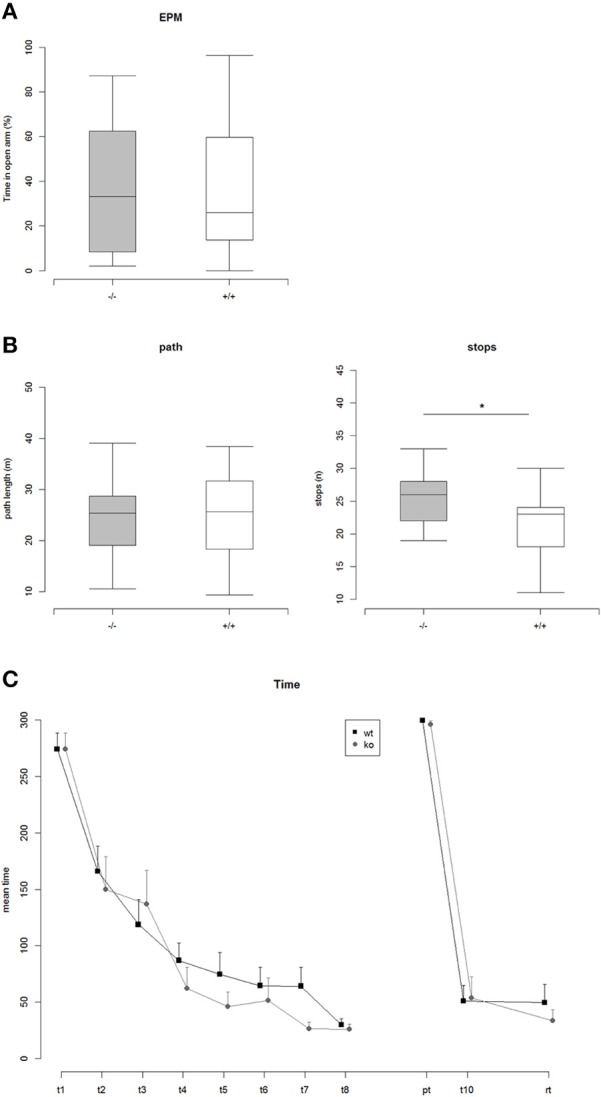
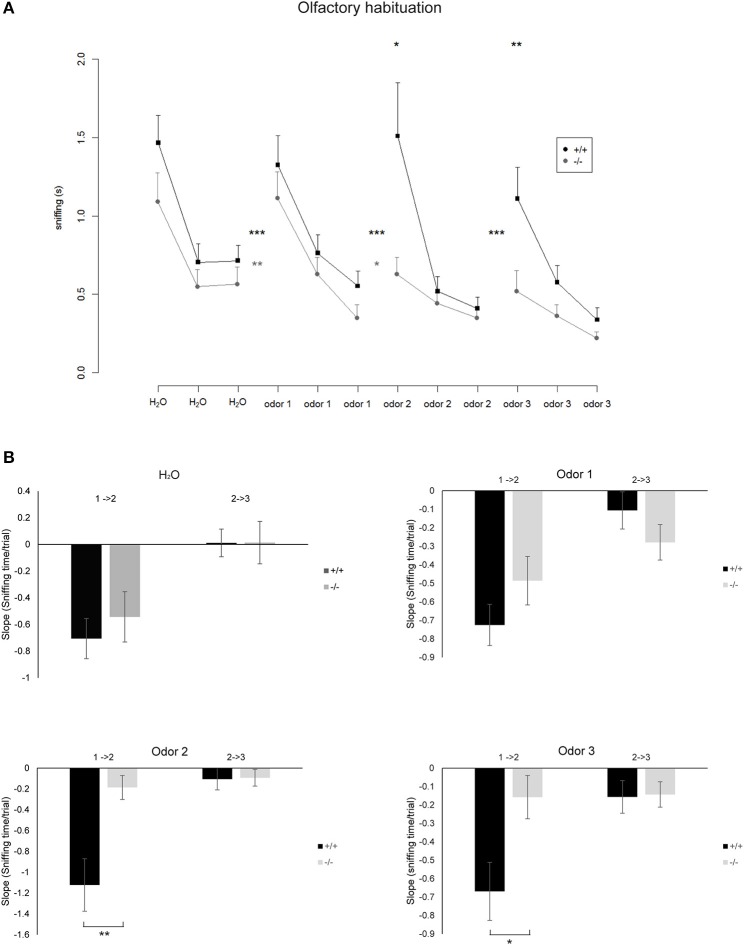
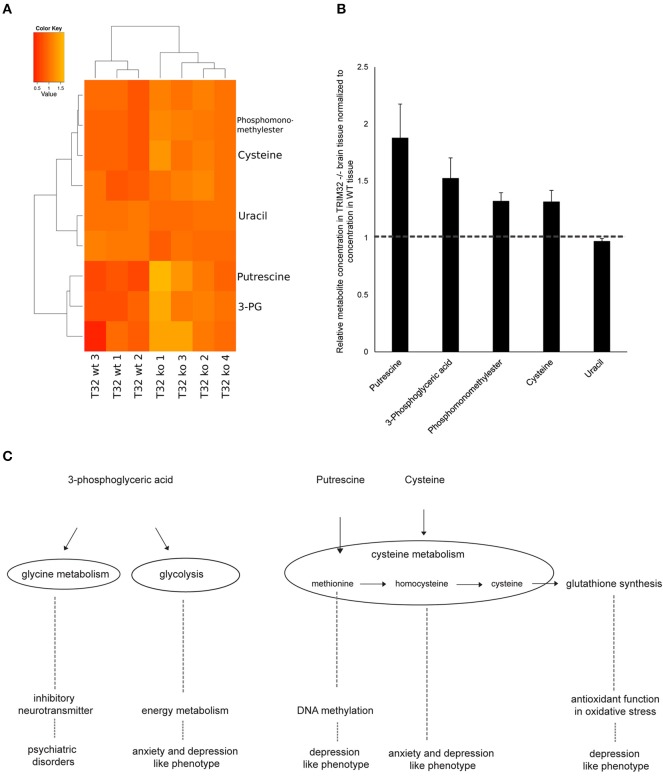
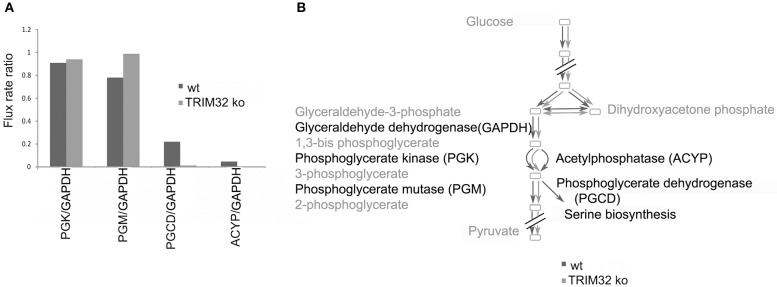
In mammals, new neurons are generated throughout the entire lifespan in two restricted areas of the brain, the dentate gyrus (DG) of the hippocampus and the subventricular zone (SVZ)-olfactory bulb (OB) system. In both regions newborn neurons display unique properties that clearly distinguish them from mature neurons. Enhanced excitability and increased synaptic plasticity enables them to add specific properties to information processing by modulating the existing local circuitry of already established mature neurons. Hippocampal neurogenesis has been suggested to play a role in spatial-navigation learning, spatial memory, and spatial pattern separation. Cumulative evidences implicate that adult-born OB neurons contribute to learning processes and odor memory. We recently demonstrated that the cell fate determinant TRIM32 is upregulated in differentiating neuroblasts of the SVZ-OB system in the adult mouse brain. The absence of TRIM32 leads to increased progenitor cell proliferation and less cell death. Both effects accumulate in an overproduction of adult-generated OB neurons. Here, we present novel data from behavioral studies showing that such an enhancement of OB neurogenesis not necessarily leads to increased olfactory performance but in contrast even results in impaired olfactory capabilities. In addition, we show at the cellular level that TRIM32 protein levels increase during differentiation of neural stem cells (NSCs). At the molecular level, several metabolic intermediates that are connected to glycolysis, glycine, or cysteine metabolism are deregulated in TRIM32 knockout mice brain tissue. These metabolomics pathways are directly or indirectly linked to anxiety or depression like behavior. In summary, our study provides comprehensive data on how the impairment of neurogenesis caused by the loss of the cell fate determinant TRIM32 causes a decrease of olfactory performance as well as a deregulation of metabolomic pathways that are linked to mood disorders.

Keywords: adult neurogenesis; brain metabolism; cell fate determinant; neural stem cells; olfactory behavior.


Figures

Figure 1
Figure 1
TRIM32 is upregulated upon neuronal differentiation of subventricular zone (SVZ) and dentate gyrus (DG) stem cells. Free floating sections from adult mouse brain stained with the indicated antibodies. (A) Free floating sections from adult Nestin-GFP mice stained with the indicated antibodies. (*) highlights neural stem cells in the DG and SVZ, (>) marks mature neurons. Scale bar = 20 μm. (B) Free floating sections from wt mice stained with the indicated antibodies. Images in the lower panel represent high magnification of the indicated areas labeled in upper image. Scale bar = 30 μm for upper image, 10 μm for lower panel. RMS, rostral migratory stream; GCL, granular cell layer; OB, olfactory bulb.
Figure 2
Figure 2
Loss of TRIM32 is not influencing the rates of adult-born neurons in the dentate gyrus (DG) significantly. (A) Freefloating sections including the DG of wildtype (wt) and TRIM32 ko mice that were injected with BrdU and stained with the indicated antibodies. Scale bar = 20 μm. (B) shows the quantifications of (A). N = 5 mice (p < 0.05). GCL, granular cell layer; SGZ, subgranular zone.
Figure 3
Figure 3
(A) Percent time on open arms in the Elevated Plus Maze (EPM): ko vs. wt: Two Sample t-test, t = 0.17, p = 0.86 (n.s.), Nko = 14, Nwt = 20. (B) Left: Path length traveled in the Open Field Test: ko vs. wt: Two Sample t-test, t = 0.15, p = 0.88 (n.s.), Nko = 14, Nwt = 21. Right: Number of stops while exploring the Open Field arena: ko vs. wt: Two Sample t-test, t = 2.36, p = 0.025 (*), Nko = 14, Nwt = 21. (C) Mean time to find the correct hole on the Barnes maze. Repeated measures ANOVA revealed a highly significant effect of trial, indicating that both genotypes learned the position of the correct hole [F(1, 170) = 392.86, p < 2e-16]. There was no effect of genotype. In addition a comparison of the areas under the learning curves did not reveal any significant differences between ko vs. wt, AUC-Analysis: Two Sample t-test, t = 1.02, p = 0.32.
Figure 4
Figure 4
(A) Mean time spent sniffing on different odors in the Olfactory Habituation Test. Odors were presented three times in a row and subsequently a new odor was presented. Significant differences between the time spent sniffing in the last trial of a known odor compared with the first presentation of a new odor are indicated by asterisks between the lines (paired t-tests, *p < 0.05, **p < 0.01, ***p < 0.001). Differences between the genotypes regarding the time spent sniffing in the first trial of a newly presented odor are indicated by asterisks above the curves (Two sample unpaired t-tests). Nko = 14, Nwt = 18. (B) Bar diagrams representing the slope that indicates the rate at which the sniffing time decreases from the first to the second trial (1 → 2) and second to the third trial (2 → 3) for the indicated odors. Differences in genotypes are indicated by asterisks (*p < 0.05, **p < 0.01) (according to normal distribution of the values t-test for odor 1, Mann–Whitney Rank Sum Test for odor 2 and 3). Nko = 14, Nwt = 18.
Figure 5
Figure 5
(A) Heatmap showing metabolites that differ significantly between wt and TRIM32 ko mice (Student's t-test, p-value < 0.05). Medians of three technical replicates were used as basis for this data analysis. For visualization the individual intensities for each compound were divided by its mean intensity across all replicates. Colors represent metabolite levels in TRIM32 ko and wt brain tissue. Clustering was performed on Euclidean distances using Ward's minimum variance method. Three wt and 4 ko animals were used for analysis. (B) Relative concentration of metabolites that differ significantly in concentration between wt and TRIM32 ko mice. Data were calculated as means with standard error of the mean and values of TRIM32 ko mice were normalized to wt values. (C) Schematic overview depicting metabolomic pathways to which metabolites that were significantly different in concentration are linked to and their involvement in brain disorders and behavioral phenotypes.
Figure 6
Figure 6
Flux distribution estimated by random sampling for the wild type and the mutant models built via the FASTCORMICS workflow. (A) Random sampling results. Ratio of the flux rates for phosphoglycerate kinase (PGK), phosphoglycerate mutase (PGM), and acetylphosphatase (ACYP) over glyceraldehyde dehydrogenase (GADP) represented in blue for the wild type and in red for the mutant. (B) Schematic representation of the qualitative wild type (dark gray) and mutant (light gray) fluxes over the glycolysis pathway.

Similar articles

Cited by

References

    1. Bardy C., Alonso M., Bouthour W., Lledo P. M. (2010). How, when, and where new inhibitory neurons release neurotransmitters in the adult olfactory bulb. J. Neurosci. 30, 17023–17034. 10.1523/JNEUROSCI.4543-10.2010 - DOI - PMC - PubMed
    1. Barnes C. A. (1979). Memory deficits associated with senescence: a neurophysiological and behavioral study in the rat. J. Comp. Physiol. Psychol. 93, 74–104. 10.1037/h0077579 - DOI - PubMed
    1. Becker S. A., Feist A. M., Mo M. L., Hannum G., Palsson B. O., Herrgard M. J. (2007). Quantitative prediction of cellular metabolism with constraint-based models: the COBRA Toolbox. Nat. Protoc. 2, 727–738. 10.1038/nprot.2007.99 - DOI - PubMed
    1. Bello B., Reichert H., Hirth F. (2006). The brain tumor gene negatively regulates neural progenitor cell proliferation in the larval central brain of Drosophila. Development (Cambridge, England) 133, 2639–2648. 10.1242/dev.02429 - DOI - PubMed
    1. Belluzzi O., Benedusi M., Ackman J., LoTurco J. J. (2003). Electrophysiological differentiation of new neurons in the olfactory bulb. J. Neurosci. 23, 10411–10418. Available online at: http://www.jneurosci.org/content/23/32/10411.full - PMC - PubMed

LinkOut - more resources