. 2015 Mar 17:9:26.
doi: 10.3389/fnana.2015.00026. eCollection 2015.

Localization of mutant ubiquitin in the brain of a transgenic mouse line with proteasomal inhibition and its validation at specific sites in Alzheimer's disease

Affiliations

Localization of mutant ubiquitin in the brain of a transgenic mouse line with proteasomal inhibition and its validation at specific sites in Alzheimer's disease

Romina J G Gentier et al. Front Neuroanat. .

Abstract

Loss of protein quality control by the ubiquitin-proteasome system (UPS) during aging is one of the processes putatively contributing to cellular stress and Alzheimer's disease (AD) pathogenesis. Recently, pooled Genome Wide Association Studies (GWAS), pathway analysis and proteomics identified protein ubiquitination as one of the key modulators of AD. Mutations in ubiquitin B mRNA that result in UBB(+1) dose-dependently cause an impaired UPS, subsequent accumulation of UBB(+1) and most probably depositions of other aberrant proteins present in plaques and neurofibrillary tangles. We used specific immunohistochemical probes for a comprehensive topographic mapping of the UBB(+1) distribution in the brains of transgenic mouse line 3413 overexpressing UBB(+1). We also mapped the expression of UBB(+1) in brain areas of AD patients selected based upon the distribution of UBB(+1) in line 3413. Therefore, we focused on the olfactory bulb, basal ganglia, nucleus basalis of Meynert, inferior colliculus and raphe nuclei. UBB(+1) distribution was compared with established probes for pre-tangles and tangles and Aβ plaques. UBB(+1) distribution found in line 3413 is partly mirrored in the AD brain. Specifically, nuclei with substantial accumulations of tangle-bearing neurons, such as the nucleus basalis of Meynert and raphe nuclei also present high densities of UBB(+1) positive tangles. Line 3413 is useful for studying the contribution of proteasomal dysfunction in AD. The findings are consistent with evidence that areas outside the forebrain are also affected in AD. Line 3413 may also be predictive for other conformational diseases, including related tauopathies and polyglutamine diseases, in which UBB(+1) accumulates in their cellular hallmarks.

Keywords: RNA; basal ganglia; frameshift mutation; inferior colliculus; nucleus basalis of Meynert; olfactory bulb; raphe nuclei; ubiquitin B+1.


Figures

Figure 1
Figure 1
Photomicrographs of UBB+1 distribution in the brain of UBB+1 tg mice (line 3413) shown in sagittal and coronal sections. (A) Sagittal overview of UBB+1 staining in a 7-month-old 3413 tg mouse corresponding to sagittal figure 106 in the mouse brain atlas of Franklin and Paxinos (2007) with rectangles showing the locations of higher magnifications in (B–D). (B) OB, (C) Acb and (D) IC. (B) Shows the presence of UBB+1 in neurons of the OB, accessory olfactory bulb (AOB) and the anterior olfactory area (AO) at higher magnification. The insert shows a higher magnification of the AOB. (C) UBB+1 expression in the Acb. Insert shows higher magnification of UBB+1-positive cells. Filled triangle shows a cell in which the UBB+1 staining is cytoplasmic and the nucleus is negative. (D) UBB+1-immunoreactivity in the IC. Insert shows a higher magnification of the immunoreactive cells in the DCIC. (E) Coronal section of a 15-month-old 3413 tg mouse showing the presence of UBB+1 in the dorsal raphe (corresponding to coronal figure 69 in the mouse brain atlas of Franklin and Paxinos, 2007). (F) shows this region at a higher magnification. Insert in (F) shows the UBB+1-immunoreactive cells in the DR. Bars: (A), 1 mm; (B,D,F), 200 μm, (insert in B,C), 100 μm, (E), 500 μm, (insert in C, insert in D), 20 μm, insert in (F), 50 μm. Acb, nucleus accumbens; AOB, accessory olfactory bulb; AO, anterior olfactory area; Cb, cerebellum; CIC, central nucleus of IC; Cx, cerebral cortex; DCIC, dorsal cortex of IC; DR, dorsal raphe; EplA, external plexiform layer of the accessory olfactory bulb, ECIC, external cortex of IC; GlA, glomerular layer of the accessory olfactory bulb; Hip, hippocampus; IC, inferior colliculus; LS, lateral septal nucleus; LV, lateral ventricle; MiA, mitral cell layer of the accessory olfactory bulb; OB, olfactory bulb; PAG, periaqueductal gray; Sol, nucleus of the tractus solitarius; Tu, olfactory tubercle.
Figure 2
Figure 2
Schematic sagittal (A,B) and coronal (C) overviews showing the mean UBB+1 intensity (blue) (A,C left) and density (green) (B,C right) in a wide range of mouse brain nuclei. Regions previously reported to be UBB+1 immunoreactive (cerebral cortex, hippocampus, dentate gyrus, amygdala, striatum, nucleus parabrachialis, and Sol) are shown in brown. The UBB+1 intensity and density in OB, Acb, IC and the raphe nuclei are shown in blue and green, respectively. Different gradations of brown, blue, and green are used indicating the level of staining intensity or density with a light gradation for a low intensity or density, a medium gradation for a moderate intensity or density level, a dark gradation for a high intensity or density level and a very dark gradation for a very high intensity or density. Other sizeable regions with a low to moderate UBB+1-immunoreactivity are shown in purple. However, more regions are positive for UBB+1, for details see Tables 2 and S2. Figures are adapted from the mouse brain atlas of Franklin and Paxinos figure 106 and 73, respectively (Franklin and Paxinos, 2007). BST, bed nucleus of the stria terminalis; Gi, gigantocellular reticular nucleus; HTh, hypothalamus; PAG, periaqueductal gray; PnC, pontine reticular nucleus, caudal part; PnO, pontine reticular nucleus, oral part; S, septal area; SC, superior colliculus; Th, thalamus.
Figure 3
Figure 3
Expression of UBB+1 and AD neuropathology (NFTs, NTs and Aβ) in sections of the human olfactory bulb and tract of patient #10 (Braak 6). (A–D) shows olfactory tissue incubated with antibodies against (A) UBB+1, (B) pre-tangles (MC1), (C) tangles (CP13), and (D) Aβ plaques. Asterisk shows intracellular accumulations, represented by neuronal staining (A) UBB+1 immunoreactivity present in neuronal cells of the OB (asterisk). (B–C) Presence of misfolded tau in pretangles and NFTs (asterisk). NTs are shown by the filled triangles. (C) The insert shows the AON of the tract. (D) Presence of Aβ plaque formation (arrow). Bars: (A–D), 100 μm, insert in (C), 500 μm. AON, anterior olfactory nucleus.
Figure 4
Figure 4
Photomicrographs of UBB+1 and AD neuropathology (NFTs, NTs, and Aβ plaques) in the human piriform (Pir) cortex adjacent to the OB of patient #5 (Braak 5). (A–D) shows the olfactory tissue incubated with antibodies against (A) UBB+1, (B) pre-tangles (MC1), (C) tangles (CP13), and (D) Aβ plaques. Asterisk shows intracellular accumulations, represented by neuronal staining. (A) The presence of UBB+1 in the neuronal cells (asterisk) of the Pir. (B,C) Pir expresses misfolded tau in pretangles and NFTs (asterisk). NTs are shown by filled triangles. (D) Abundant present of Aβ plaque formation (arrow) in the Pir. Bars: (A–D), 100 μm.
Figure 5
Figure 5
UBB+1 and AD neuropathology (NFTs, NTs, and Aβ plaques) in the human basal ganglia. (A) Photomicrograph of a 50 μm-thick coronal section from the Acb of patient #5 (Braak 5). (B) Higher magnification of the boxed region in (A) incubated with the antibody against UBB+1, (C–E) Higher magnifications of boxed area in adjacent sections stained for (C) pre-tangles material (MC1), (D) tangles (CP13) and (E) Aβ plaques. The Acb, together with other nuclei of the basal ganglia (Cd and Pu), presents little UBB+1-immunoreactivity (asterisk). Asterisks show neurons with intracellular accumulations. NTs are shown by filled triangles and Aβ plaques by an arrow. Bars: (A), 1 mm, (B–E), 200 μm. Acb, nucleus accumbens, ec, external capsule; FPu, nucleus accumbens putaminal fundus; ic, internal capsule; LV, lateral ventricle; OlfA, olfactory area.
Figure 6
Figure 6
UBB+1 and AD neuropathology (NFTs, NTs, and Aβ plaques) in the human NBM. (A) Representative photomicrograph of a 50 μm-thick coronal section from the NBM of patient #4 (Braak 3). (B–E) Higher magnifications of the boxed region in (A) incubated with four antibodies against (B) UBB+1, (C) pre-tangles material (MC1), (D) tangles (CP13), and (E) Aβ plaques. The cholinergic cells of the NBM are shown by an arrowhead. The nucleus is significantly affected by both tau pathology [neuronal staining (asterisk) and NTs (filled triangle)] and extracellular Aβ accumulation (arrow). UBB+1 expression (asterisk) is found in cholinergic cells of the NBM. Bars: (A), 1 mm, (B–E), 200 μm. ac, anterior commissure; GPi, globus pallidus internal segment; NBM, nucleus basalis of Meynert.
Figure 7
Figure 7
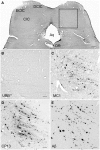
UBB+1 and AD neuropathology (NFTs, NTs, and Aβ plaques) in the human IC. (A) Representative photomicrograph of a 50 μm-thick coronal section from the brainstem of patient #6 (Braak 5). (B–E) Higher magnifications of the boxed region in (A) incubated with four antibodies against (B) UBB+1, (C) pre-tangles material (MC1), (D) tangles (CP13), and (E) Aβ plaques. The IC show selective vulnerability to Aβ accumulation, expressing a high number of both neuritic (star) and non-neuritic (arrow) plaques. Neuronal staining, represented by NFTs and UBB+1-immunoreactive substrates, is not present in this region. Bars: (A), 1 mm, (B–I), 200 μm. Aq, cerebral aqueduct; CIC, central nucleus of IC; DCIC, dorsal cortex of IC; DR, dorsal raphe nucleus; ECIC, external cortex of IC; IC, inferior colliculus.
Figure 8
Figure 8
UBB+1 and AD neuropathology (NFTs, NTs, and Aβ plaques) in the human raphe nuclei. (A) Photomicrograph of a 50 μm-thick section from the brainstem cut perpendicular to the long axis of the spinal cord of patient #8 (Braak 5). (B–E) Higher magnifications of the MnR [lower boxed region in (A)] incubated with four antibodies against (B) UBB+1, (C) pre-tangles material (MC1), (D) tangles (CP13), and (E) Aβ plaques. (F–I) Larger magnifications of the DR [upper boxed region in (a)] incubated with the same four antibodies. (F) Ubi2A; (G) MC1; (H) CP13; (I) 6F3D. The raphe nuclei located in the rostral brainstem (MnR and DR) express selective vulnerability to tau pathology (asterisk, neuronal staining; filled triangle, NTs), being almost devoid of plaques (arrow). Both MnR and DR are strongly stained by antibodies directed against pre-tangle material (MC1) and NFTs (CP13), and present a moderate number of UBB+1-positive substrates (asterisk). Bars: (A), 1 mm, (B–I), 200 μm. Aq, cerebral aqueduct; DR, dorsal raphe nucleus; LC, locus coeruleus; mlf, medal longitudinal fasciculus; MnR, median raphe nucleus, PnO, pontine reticular nucleus oral part.

Similar articles

Cited by

References

    1. Attems J., Walker L., Jellinger K. A. (2014). Olfactory bulb involvement in neurodegenerative diseases. Acta Neuropathol. 127, 459–475. 10.1007/s00401-014-1261-7 - DOI - PubMed
    1. Baloyannis S. J., Mauroudis I., Manolides S. L., Manolides L. S. (2009). Synaptic alterations in the medial geniculate bodies and the inferior colliculi in Alzheimer's disease: a Golgi and electron microscope study. Acta Otolaryngol. 129, 416–418. 10.1080/00016480802579074 - DOI - PubMed
    1. Barnes D. E., Yaffe K. (2011). The projected effect of risk factor reduction on Alzheimer's disease prevalence. Lancet Neurol. 10, 819–828. 10.1016/S1474-4422(11)70072-2 - DOI - PMC - PubMed
    1. Braak H., Del Tredici K., Rub U., De Vos R. A., Jansen Steur E. N., Braak E. (2003). Staging of brain pathology related to sporadic Parkinson's disease. Neurobiol. Aging 24, 197–211. 10.1016/S0197-4580(02)00065-9 - DOI - PubMed
    1. Braak H., Thal D. R., Ghebremedhin E., Del Tredici K. (2011). Stages of the pathologic process in Alzheimer disease: age categories from 1 to 100 years. J. Neuropathol. Exp. Neurol. 70, 960–969. 10.1097/NEN.0b013e318232a379 - DOI - PubMed

LinkOut - more resources