. 2015 Mar 19:9:27.
doi: 10.3389/fnana.2015.00027. eCollection 2015.

A new scenario of hypothalamic organization: rationale of new hypotheses introduced in the updated prosomeric model

Affiliations

A new scenario of hypothalamic organization: rationale of new hypotheses introduced in the updated prosomeric model

Luis Puelles et al. Front Neuroanat. .

Abstract

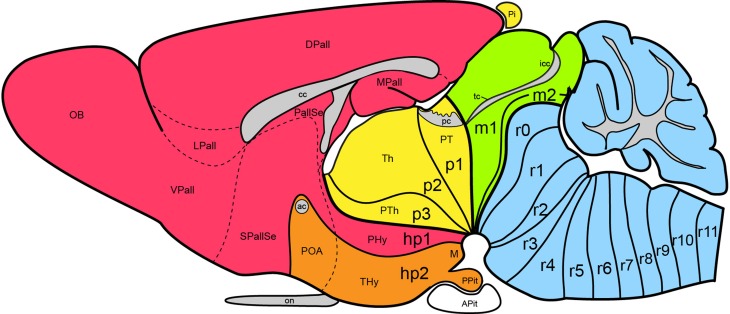
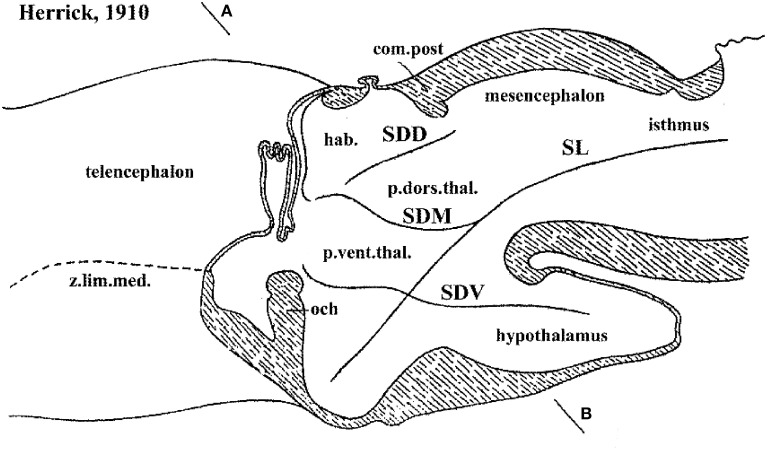
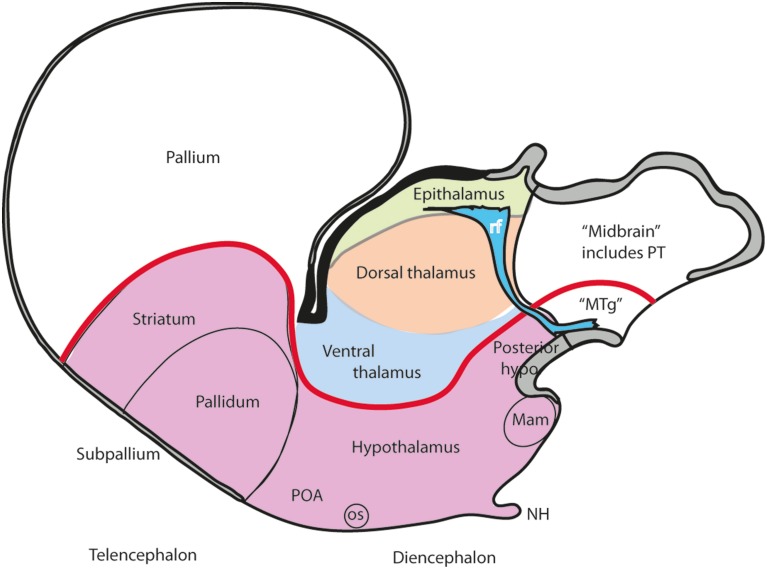
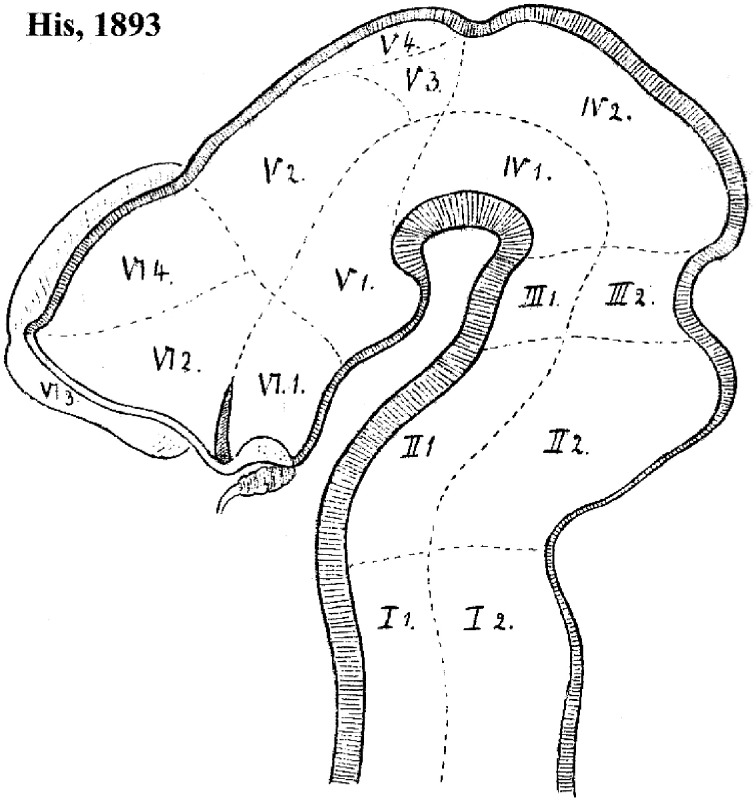
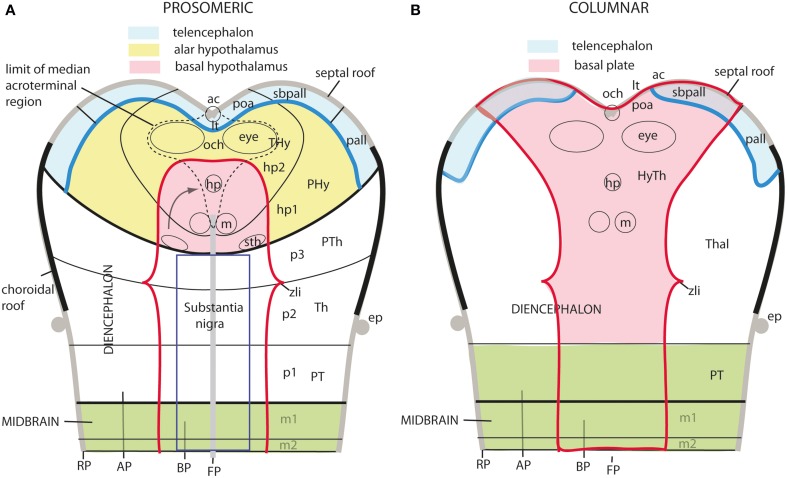
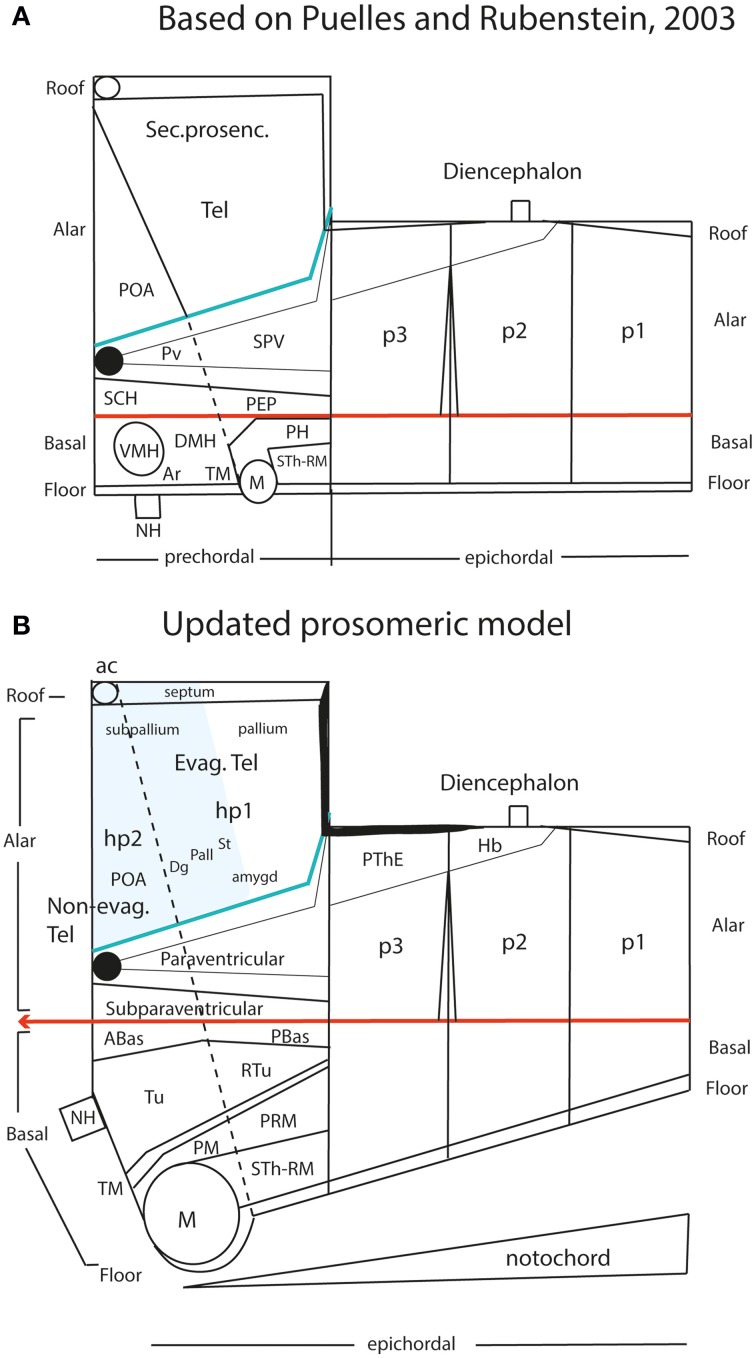
In this essay, we aim to explore in depth the new concept of the hypothalamus that was presented in the updated prosomeric model (Puelles et al., 2012b; Allen Developing Mouse Brain Atlas). Initial sections deal with the antecedents of prosomeric ideas represented by the extensive literature centered on the alternative columnar model of Herrick (1910), Kuhlenbeck (1973) and Swanson (1992, 2003); a detailed critique explores why the columnar model is not helpful in the search for causal developmental explanations. In contrast, the emerging prosomeric scenario visibly includes many possibilities to propose causal explanations of hypothalamic structure relative to both anteroposterior and dorsoventral patterning mechanisms, and insures the possibility to compare hypothalamic histogenesis with that of more caudal parts of the brain. Next the four major changes introduced in the organization of the hypothalamus on occasion of the updated model are presented, and our rationale for these changes is explored in detail. It is hoped that this example of morphological theoretical analysis may be useful for readers interested in brain models, or in understanding why models may need to change in the quest for higher consistency.

Keywords: acroterminal domain; anteroposterior pattern; dorsoventral pattern; genoarchitecture; length axis; peduncular hypothalamus; terminal hypothalamus; tracts.


Figures

Figure 1
Figure 1
Updated prosomeric model as applied to the adult mouse brain. Hindbrain rhombomeres and cryptorhombomeres (r0–r11) are in blue, midbrain mesomeres (m1–m2) in green, diencephalic prosomeres (p1–p3) in yellow, and hypothalamo-telencephalic prosomeres (hp1–hp2) in red and orange, respectively. The roof, alar, basal and floor parts are not differentiated, for simplicity, but exist in every case (note the anterior commissure represents the rostralmost roof domain; the rostralmost floor corresponds to the mamillary area-M). Abbreviations: ac, anterior commissure; cc, corpus callosum; VPall, LPall, DPall, MPall, ventral, lateral, dorsal and medial pallial sectors; PallSe, pallial septum; SPallSe, subpallial septum; OB, olfactory bulb; POA, preoptic area; THy, terminal hypothalamus; PHy, peduncular hypothalamus; PTh, prethalamus; Th, thalamus; PT, pretectum; M, mamillary body; APit, anterior pituitary; PPit, posterior pituitary; pc, posterior commissure; tc, tectal commissure; icc, intercollicular commissure.
Figure 2
Figure 2
Columnar model schema of Herrick (1910), depicting the forebrain of an urodele amphibian, here flipped horizontally and with redrawn lettering. Note Herrick still used in this figure the then standard axial forebrain landmark—the sulcus limitans of His (SL)—, and represented relative to it the dorsal (SDD), middle (SDM) and ventral (SDV) diencephalic sulci. SDM and SDV clearly intersect the SL nearly orthogonally, though described in the text as “longitudinal.” The plane AB was presented as a diencephalic “cross-section.” In ulterior publications of Herrick the SL was no longer represented and the new columnar axis parallel to the SDM/SDV sulci and continuing to a telencephalic end was implicitly established, without ever having been defined by its creator.
Figure 3
Figure 3
Schema illustrating the modern columnar model of Swanson (1992, 2003), in which the essential features of the Herrick schema are conserved, while the hypothalamus is defined explicitly as the diencephalic basal plate (note this requires that the alar ventral thalamus is continuous with the telencephalic pallium, a point negated by fate and gene mappings). In this model all the thalamic zones and the posterior hypothalamus contact the midbrain. This is achieved by arbitrary inclusion of the pretectum in the midbrain and ascription of the diencephalic tegmentum to the posterior hypothalamus (this places a large part of the diencephalic substantia nigra inside the “hypothalamus”).
Figure 4
Figure 4
Forebrain subdivision model of His (1893b). Note the overall course of the sulcus limitans, which in principle represents the alar-basal boundary. The hypothalamus of His is limited to his VI.1 and V.1 regions (optic and mamillary parts of the hypothalamus, respectively). Note the optic part (this is actually the tuberal basal part plus a part of the alar plate, including the suprachiasmatic primordium, as we understand the area now) is continuous dorsally with the telencephalic regions VI.2 (supposed to be subpallium, but including alar hypothalamus) and VI.4 (pallium); VI.3 is the olfactory bulb. On the other hand, the region V.1 (mamillary pouch) is held to relate dorsally with V.2, the thalamus. V.3 and V.4 possibly represent the pretectum and epithalamus, respectively. Note the oblique rostral border of the midbrain, which His (1893b) explained explicitly as an “arbitrary provisional line,” due to the lack of data about its proper placement at that time.
Figure 5
Figure 5
Brain subdivisions in a generalized vertebrate model as conceived by Kappers (1947). Note conservation of the sulcus limitans of His (“sillon limitant”), and the clear concept of the sensory and motor longitudinal brainstem zones plus the floor plate (P.AL; P.BAS; PL.V). These bend uniformly around the cephalic flexure and end at the rostrally placed hypothalamus. The middle and ventral thalamic sulci (S.TH.M; S.TH.VEN) are represented as strictly transversal relative to the longitudinal dimension, which obviously does not end in the telencephalon, but in the hypothalamus. Note the notochordal tip contacting the mamillary pouch.
Figure 6
Figure 6
Diagrams illustrating hypothetic anteroposterior patterning forces (AP, large thick arrows) and antagonistic dorsoventral patterning effects spreading from the roof and floor plates (DV, thinner arrows and gradiental shadowing) in the updated prosomeric model (A) vs. Swanson's columnar model (B). The postulated alar-basal boundary is marked in red in both cases. The postulated hypothalamic and diencephalic neuromeres are held to be patterned and delimited due to AP effects, as shown in (A). In contrast, the columnar model implicitly holds that AP effects guide the division into telencephalon, diencephalon and midbrain (B). The question marks of some arrows in (B) indicate the lack of notochordal and floor plate support for ventralizing effects at these sites (compare with A). The roof plate concept is also different in both models (thick black line).
Figure 7
Figure 7
Diagrams comparing how the domain of expression of Nkx2.2 (in blue) relates to the alar-basal boundary (red line) in the updated prosomeric model (A) and the columnar model (B). The neuromeres are marked for reference in (A), as well as the dorsal/middle/ventral diencephalic limiting sulci (ds, ms, vs) in (B). Note the transverse ZLI spike of the Nkx2.2 domain that separates thalamus and prethalamus is a secondary feature, due to the induction of this gene adjacent to the border of Shh expression, which is ectopically activated at the core of the ZLI. At neural plate and early neural tube stages, the expression band is strictly longitudinal (marked by dashes in A). In the columnar model (B), the correspondence of the boundary with the gene band is disrupted at the arbitrary deviation of the former into the telencephalon. Moreover, note this model cannot explain why the gene band extends into the hypothalamus, cutting it into two halves, which cannot be understood as alar and basal parts of the hypothalamus, as in (A) (question mark in B).
Figure 8
Figure 8
(A) Summary of antagonistic dorsoventral patterning effects spreading from the roof plate, including its rostralmost portion at the anterior commissure, and the floor plate, including its rostral hypothalamic sector. These effects presumably establish the alar-basal boundary (red line), as well as the telencephalo-hypothalamic boundary. The blue boxed area is examined in detail in (B). (B) Map of the known dorsoventral molecular regionalization of the alar and basal hypothalamus, held to result from graded finer interactive effects within the primary dorsoventral pattern. The alar-basal boundary is marked by the thick red line. The alar longitudinal domains are represented by the paraventricular area (subdivided into dorsal, central, and ventral microzones) and the subparaventricular area (this relates to the optic chiasm and the initial course of the optic tract). The basal hypothalamus consists of similarly dorsoventrally related tuberal and mamillary regions (sensu lato). The updated terminology proposes distinguishing tuberal (Tu) from retrotuberal (RTu) areas, as well as perimamillary and mamillary sensu stricto (PM, M) from periretromamillary and retromamillary sensu stricto areas (PRM, RM), respectively belonging to THy and PHy. Note the Tu/RTu complex can also be subdivided dorsoventrally into dorsal, intermediate and ventral microzones (TuD, TuI, TuV; RTuD, RTuI, RTuV).
Figure 9
Figure 9
Schematic comparison of the rostral end of the major longitudinal zones in flat neural plate maps, within the prosomeric model (A) and Swanson's columnar model (B). Structural landmarks which are conserved in both models are included to help fix the positions. In (A) both the basal and alar regions meet at the rostromedian terminal midline, intercalated between the end of the floor plate and the end of the roof plate (at the prospective anterior commissure–ac). The dashed lines delimit the acroterminal domain. Note the whole telencephalon (pallial and subpallial) relates ventrally with the hypothalamus and dorsally with the septal roof. In contrast, in (B) the hypothalamus is held to be continuous rostrally only with the telencephalic subpallium, but reaches itself the neural plate border, which is wrongly held to coincide with the optic chiasm and the lamina terminalis (because the preoptic area is ascribed to the hypothalamus). The telencephalic pallium is oddly depicted as being continuous caudally with the thalamus (the prethalamus, in fact); the comparison with (A) clearly suggests that a large part of the peduncular hypothalamus (PHy) is unwittingly ascribed to the “thalamus.” Another difference is observed in the rostral limit of the midbrain (green area).
Figure 10
Figure 10
Schematic comparison of the earlier prosomeric model version of Puelles and Rubenstein (2003) in (A) with the updated version of Puelles et al. (2012b) in (B). The (A) schema was slightly modified, repositioning more conveniently the anterior commissure, and eliminating for simplicity all unnecessary details in the present context. The (B) schema illustrates changes in the intrahypothalamic boundary, which now extends from the roof plate into the floor plate, distinctly separating the hp1 and hp2 prosomeres and the PHy and THy parts of the hypothalamus. The telencephalic subpallium is identified as a blue field; note its POA, Dg, Pal, and St parallel subdivisions. The alar hypothalamus remains essentially unchanged, apart the introduction of the paraventricular and subparaventricular areal names. The basal hypothalamus is deeply changed, due to our recognizing the mamillary area as occupying an extreme rostral and ventral longitudinal position, consistently with the new floor concept, and the tip of the notochord. This pushes the whole tuberal area, including the median eminence, infundibulum and neurohypophysis (NH), out of the hypothalamic floor (compare A) and into the rostral end of the basal plate. It represents now a fully longitudinal domain. The novel retrotuberal area (RTu) lies caudally to the tuberal area sensu stricto (Tu), and extends back to the prethalamic (p3) tegmentum, dorsally to the periretromamillary area (PRM). Rostral to PRM lies the perimamillary band (PM).
Figure 11
Figure 11
Figure taken from Puelles et al. (2012b), illustrating in (A) the primordial intimate contact of the forebrain floor with the notochord, as well as the hypothalamic terminal plate closing rostrally the tube, from a drawing by His (1894) of a shark embryo. (B,D,E) show the floor plate expression of three mouse genes, Ntn1, Shh, and Lmx1b at E11.5, displaying the same rostral end at the mamillary pouch; (C,F) show Ntn1 and Lmx1b at E13.5, for clearer identification of the mamillary territory.
Figure 12
Figure 12
Prosomeric interpretation of the course of the fornix and peduncular tracts within the updated model. These two tracts are exclusively associated to the peduncular hypothalamus (PHy). The fimbrial fibers originate within the hippocampal complex, represented within the caudomedial pallium, next to the choroidal roof. They first course strictly longitudinally along the roof plate (septal commissural plate), but change course when they reach the hp1/hp2 boundary. Here they turn ventralwards entering a dorsoventral trans-hypothalamic route (via the rostral part of PHy) all the way into their final decussation within the retromamillary floor plate. Shortly before that, the fibers that innervate the mamillary body separate at right angles, and enter rostrally the basal hp2. The telencephalic peduncle (gray-colored) is first transverse while it courses dorsoventrally through the caudal part of the peduncular hypothalamus (next to the hypothalamo-diencephalic border); once it reaches the basal plate it bends backwards (knee around the subthalamic nucleus) and enters its descending longitudinal course through the diencephalic, midbrain and brainstem tegmentum. The upper root of the peduncle that carries thalamo-cortical and cortico-thalamic fibers through the alar prethalamus (reticular nucleus) is represented as well.
Figure 13
Figure 13
Frontal schematic representation of the structures presently ascribed to the acroterminal domain (ATD); the latter is delimited right and left by a thick black line. The alar-basal boundary is marked in red. The ATD starts at the preoptic roof, encompassing the anterior commissure bed and the median preoptic nucleus (MnPO); further down there is the terminal lamina, and probably also some other neighboring preoptic derivatives, ending with the organum vasculosum laminae terminalis (OVLT), a circumventricular specialization. The alar hypothalamic part of the ATD also includes the optic elements (eyes, stalks and chiasm) plus the postoptic decussations, and the suprachiasmatic nuclei (SCH) bilaterally. The basal ATD region includes the precociously differentiating median anterobasal area (ABasM), the median eminence, infundibulum, neurohypophysis (NH) and arcuate nuclei, plus the median tuberomamillary area (TM), finishing with the median mamillary area (MnM).
Figure 14
Figure 14
Schema illustrating the apparent sources of patterning diffusible morphogens that may have effects on the hypothalamus. The anterior neural ridge (ANR; yellow), which releases FGF8 is in fact a part of the roof plate (dorsalizing influence), rather than a source of AP effects; in contrast, the retromamillary and mamillary floor plate (dark blue associated to RM and M) releases SHH (ventralizing influence; note Shh secondarily also is expressed throughout the basal plate, and is later downregulated at the Tu area). We can speak of the acroterminal midline as a source of AP patterning effects. Recent observations (Ferran et al., 2015) show Fgf18 expression within the postulated alar acroterminal organizer (fuchsia-labeled) and Fgf8 and Fgf10 expression within the postulated basal acroterminal organizer (green-labeled). There also are bilateral spots of Fgf8 expression at the optic stalks (not shown).

Similar articles

Cited by

References

    1. Alonso A., Merchán P., Sandoval J. E., Sánchez-Arrones L., Garcia-Cazorla A., Artuch R., et al. . (2012). Development of the serotonergic cells in murine raphe nuclei and their relations with rhombomeric domains. Brain Struct. Funct. 218, 1229–1277. 10.1007/s00429-012-0456-8 - DOI - PMC - PubMed
    1. Alvarez-Bolado G., Swanson L. W. (1996). Developmental Brain Maps: Structure of the Embryonic Rat Brain. Elsevier: Amsterdam.
    1. Altman J., Bayer S. A. (1986). The development of the rat hypothalamus. Adv. Anat. Embryol. Cell Biol. 100, 1–178. 10.1007/978-3-642-71301-9 - DOI - PubMed
    1. Altman J., Bayer S. A. (1988). Development of the rat thalamus: I. Mosaic organization of the thalamic neuroepithelium. J. Comp. Neurol. 275, 346–377. 10.1002/cne.902750304 - DOI - PubMed
    1. Altman J., Bayer S. A. (1995). Atlas of Prenatal Rat Brain Development. Boca Raton, FL: CRC Press.

LinkOut - more resources