. 2015 Mar 20:6:78.
doi: 10.3389/fphys.2015.00078. eCollection 2015.

Abnormal calcium homeostasis in heart failure with preserved ejection fraction is related to both reduced contractile function and incomplete relaxation: an electromechanically detailed biophysical modeling study

Affiliations

Abnormal calcium homeostasis in heart failure with preserved ejection fraction is related to both reduced contractile function and incomplete relaxation: an electromechanically detailed biophysical modeling study

Ismail Adeniran et al. Front Physiol. .

Abstract

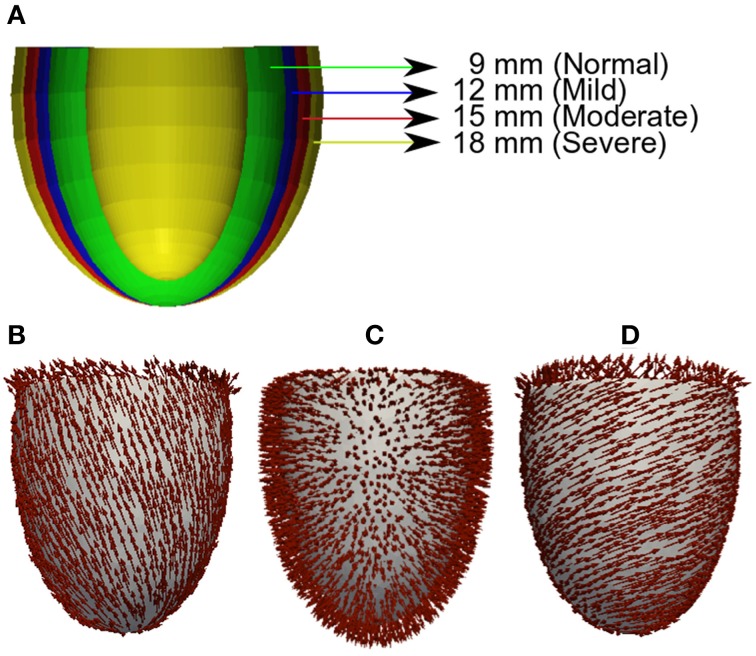
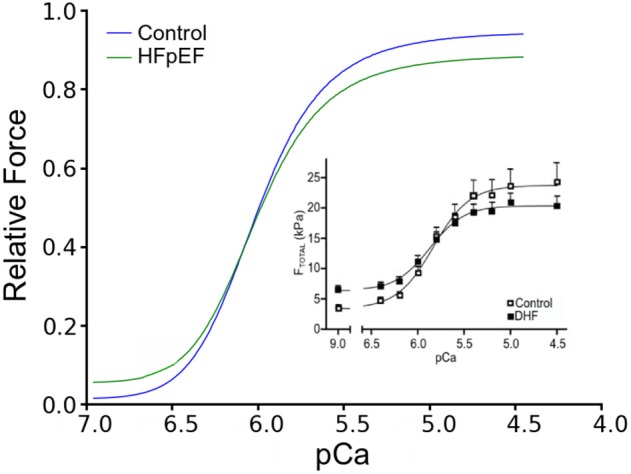
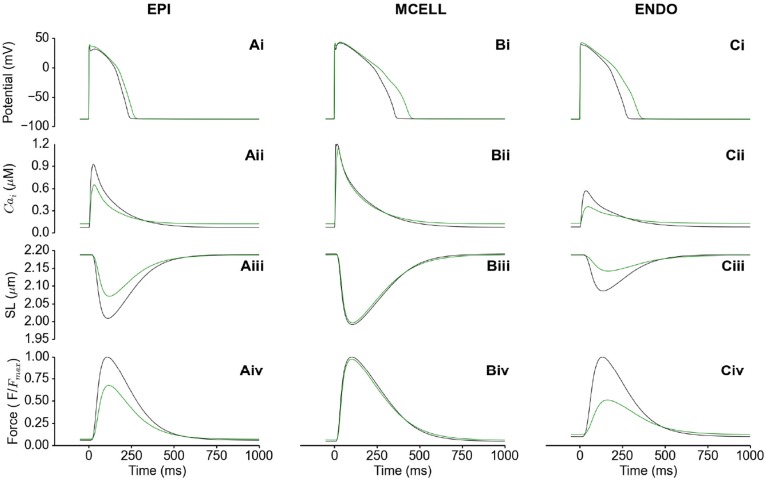
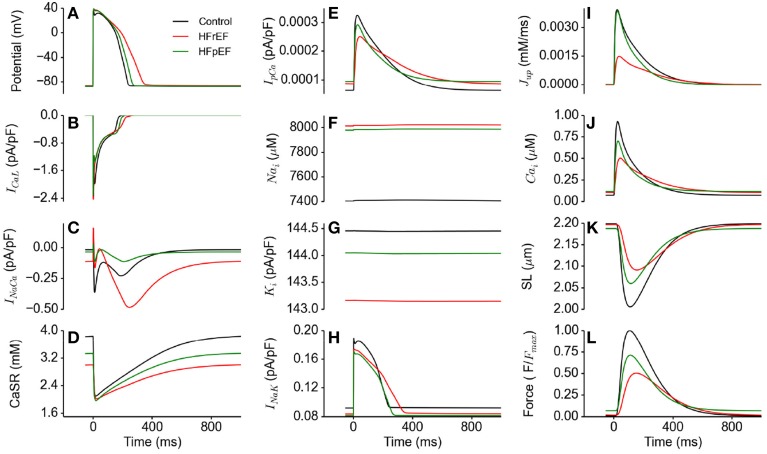
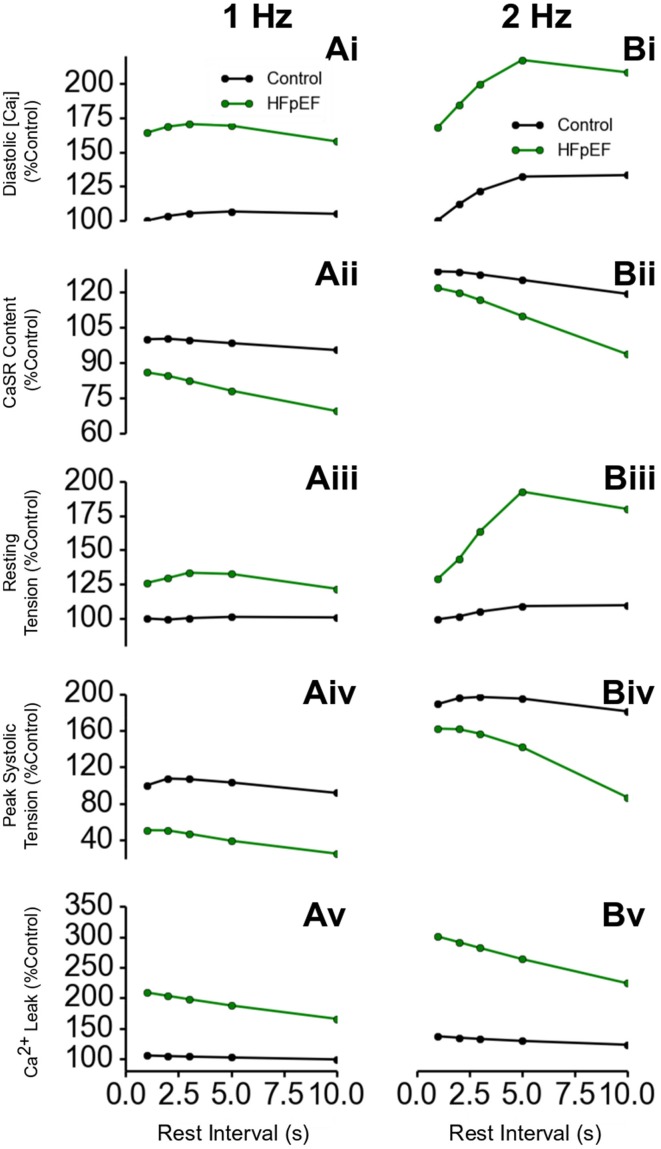
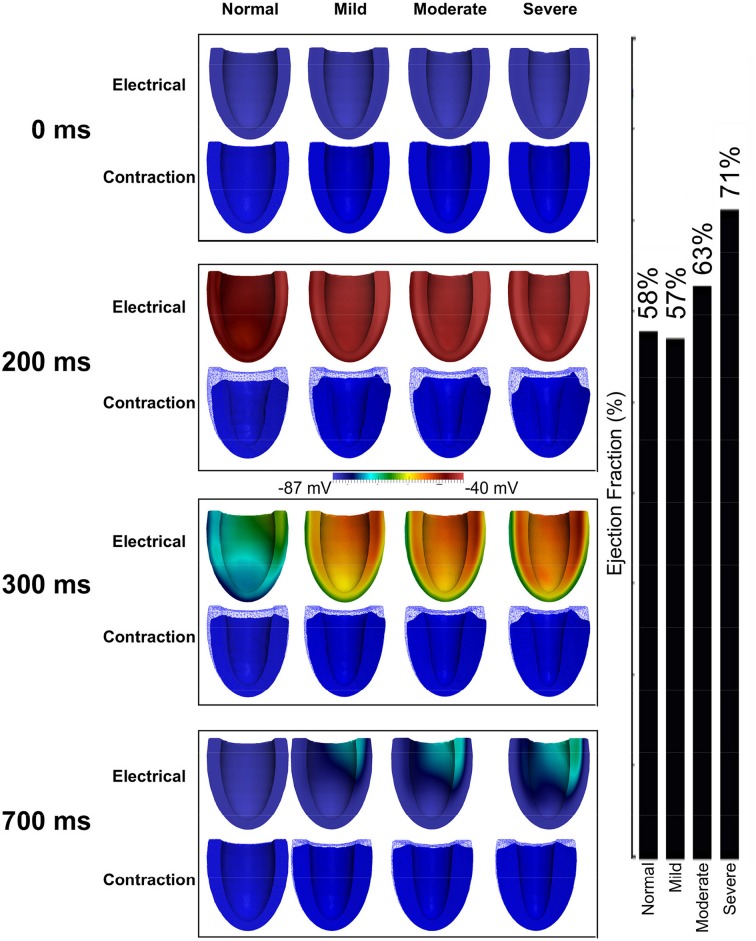
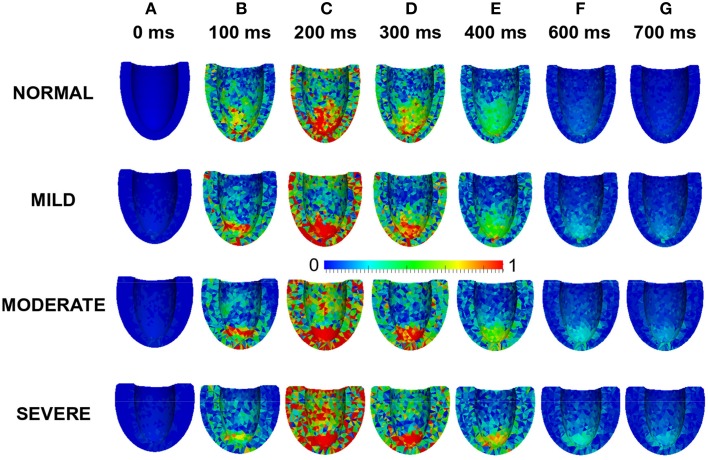
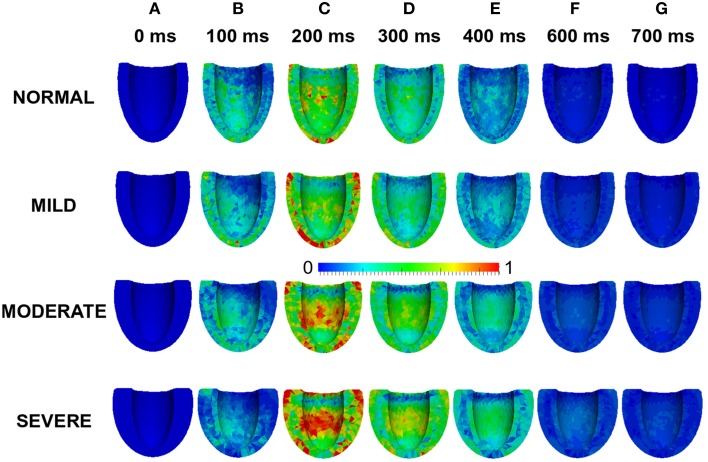
Heart failure with preserved ejection fraction (HFpEF) accounts for about 50% of heart failure cases. It has features of incomplete relaxation and increased stiffness of the left ventricle. Studies from clinical electrophysiology and animal experiments have found that HFpEF is associated with impaired calcium homeostasis, ion channel remodeling and concentric left ventricle hypertrophy (LVH). However, it is still unclear how the abnormal calcium homeostasis, ion channel and structural remodeling affect the electro-mechanical dynamics of the ventricles. In this study we have developed multiscale models of the human left ventricle from single cells to the 3D organ, which take into consideration HFpEF-induced changes in calcium handling, ion channel remodeling and concentric LVH. Our simulation results suggest that at the cellular level, HFpEF reduces the systolic calcium level resulting in a reduced systolic contractile force, but elevates the diastolic calcium level resulting in an abnormal residual diastolic force. In our simulations, these abnormal electro-mechanical features of the ventricular cells became more pronounced with the increase of the heart rate. However, at the 3D organ level, the ejection fraction of the left ventricle was maintained due to the concentric LVH. The simulation results of this study mirror clinically observed features of HFpEF and provide new insights toward the understanding of the cellular bases of impaired cardiac electromechanical functions in heart failure.

Keywords: 3D model; calcium; heart failure; ventricle.


Figures

Figure 1
Figure 1
Geometry and fiber directions in 3D left ventricle with varied wall thickness. (A) Control and HFpEF concentric hypertrophic geometries—NORMAL (green, 9 mm), MILD (red, 12 mm), MODERATE (blue, 15 mm) and SEVERE (yellow, 18 mm). (B) Fiber direction. (C) Sheet direction. (D) Sheet-normal or cross-sheet direction.
Figure 2
Figure 2
Force-pCa relationship. Simulated Force-pCa relation of control and HFpEF. Relative force is normalized to maximum value in control. Inset: Experimental force-pCa relation from human patients adopted from Borbély et al. (2005).
Figure 3
Figure 3
Single cell simulations of HFpEF. (Ai–Ci) Control (black) and HFpEF (green) action potentials in the EPI (Ai), MCELL (Bi), and ENDO (Ci) cell models. (Aii–Cii) Control (black) and HFpEF (green) cytosolic Ca2+ concentration in the EPI (Aii), MCELL (Bii), and ENDO (Cii) cell models. (Aiii–Ciii) Control (black) and HFpEF (green) sarcomere length (SL) in the EPI (Aiii), MCELL (Biii), and ENDO (Ciii) cell models. (Aiv–Civ) Control (black) and HFpEF (green) active force in the EPI (Aiv), MCELL (Biv), and ENDO (Civ) cell models. Values are normalized to Control maximum active force for each cell type.
Figure 4
Figure 4
Effects of HFpEF and HFrEF on underlying ion channel currents, concentrations and force generation. (A) Control (black), HFpEF (green), and HFrEF (red) action potentials. (B) ICaL current profile in control (black), HFpEF (green), and HFrEF (red). (C) INaCa current profile in control (black), HFpEF (green), and HFrEF (red). (D) SR Ca2+ content profile in control (black), HFpEF (green), and HFrEF (red). (E) IpCa current profile in control (black), HFpEF (green), and HFrEF (red). (F) [Na]i time course in control (black), HFpEF (green), and HFrEF (red). (G) [K]i time course in control (black), HFpEF (green), and HFrEF (red). (H) INaK current profile in control (black) HFpEF (green), and HFrEF (red). (I) Jup (Ca2+ uptake via SERCA pump) profile in control (black), HFpEF (green), and HFrEF (red). (J) Ca2+ concentration in Control (black) HFpEF (green), and HFrEF (red) cytosolic. (K) Sarcomere length (SL) in control (black), HFpEF (green), and HFrEF (red). (L) Active force in control (black), HFpEF (green), and HFrEF (red). Values are normalized to Control maximum active force.
Figure 5
Figure 5
Ca2+ handling and post-rest properties in HFpEF. (Ai,Bi) Diastolic Ca2+ level in HFpEF relative to control at 1 Hz (Ai) and 2 Hz (Bi) pacing rates. (Aii,Bii) SR Ca2+ content level in HFpEF relative to control at 1 Hz (Aii) and 2 Hz (Bii) pacing rates. (Aiii,Biii) Resting tension in HFpEF relative to control at 1 Hz (Aiii) and 2 Hz (Biii) pacing rates. (Aiv,Biv) Peak systolic tension in HFpEF relative to control at 1 Hz (Aiv) and 2 Hz (Biv) pacing rates. (Av,Bv) SR Ca2+ Ca leak in HFpEF relative to control at 1 Hz (Av) and 2 Hz (Bv) pacing rates.
Figure 6
Figure 6
HFpEF Model sensitivity to increasing NCX activity and its influence on incomplete relaxation in the cellular model. Simulation results were compared between control (in absence of ionic current remodeling) and HFpEF condition. HFpEF simulations were performed with parameters as listed in Table 1, but with NCX activity changing from 70% (HFpEF condition) to 100, 150, and 175% (HFrEF condition) of the control value. (A) Action potential (B) INaCa current profile. (C) Ca2+ concentration. (D) Active force. Values are normalized to maximum active force in control. (Inset: magnified diastolic phase).
Figure 7
Figure 7
Effects of HFpEF on 3D electro-mechanics. Electrical wave propagation and mechanical contraction at 0, 200, 300, and 700 ms in NORMAL, MILD, MODERATE, and SEVERE HFpEF hypertrophic cases. (Far right) Ejection fraction in NORMAL, MILD, MODERATE, and SEVERE HFpEF hypertrophic cases.
Figure 8
Figure 8
Effects of HFpEF on stress magnitude distribution. Stress magnitude distribution at 0 ms (A), 100 ms (B), 200 ms (C), 300 ms (D), 400 ms (E) 600 ms (F), and 700 ms (G) in NORMAL, MILD, MODERATE, and SEVERE hypertrophic HFpEF cases.
Figure 9
Figure 9
Effects of HFpEF on strain magnitude distribution. Strain magnitude distribution at 0 ms (A), 100 ms (B), 200 ms (C), 300 ms (D), 400 ms (E) 600 ms (F), and 700 ms (G) in NORMAL, MILD, MODERATE, and SEVERE hypertrophic HFpEF cases.

References

    1. Adeniran I., Hancox J. C., Zhang H. (2013a). Effect of cardiac ventricular mechanical contraction on the characteristics of the ECG: a simulation study. J. Biomed. Sci. Eng. 6, 47–60 10.4236/jbise.2013.612A007 - DOI
    1. Adeniran I., Hancox J., Zhang H. (2013b). In silico investigation of the short QT syndrome, using human ventricle models incorporating electromechanical coupling. Front. Physiol. 4:166 10.3389/fphys.2013.00166 - DOI - PMC - PubMed
    1. Alan C., Hindmarsh P. N. B. (2005). SUNDIALS: suite of nonlinear and differential/algebraic equation solvers. ACM Trans. Math. Softw. 31, 363–396 10.1145/1089014.1089020 - DOI
    1. Ambrosi D., Arioli G., Nobile F., Quarteroni A. (2011). Electromechanical coupling in cardiac dynamics: the active strain approach. SIAM J. Appl. Math. 71, 605–621 10.1137/100788379 - DOI
    1. Asrar Ul Haq M., Mutha V., Rudd N., Hare D. L., Wong C. (2014). Heart failure with preserved ejection fraction—unwinding the diagnosis mystique. Am. J. Cardiovasc. Dis. 4, 100–113. - PMC - PubMed

LinkOut - more resources