Microbial abundance in surface ice on the Greenland Ice Sheet
- PMID: 25852678
- PMCID: PMC4371753
- DOI: 10.3389/fmicb.2015.00225
Microbial abundance in surface ice on the Greenland Ice Sheet
Abstract
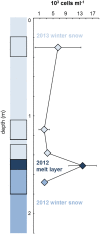
Measuring microbial abundance in glacier ice and identifying its controls is essential for a better understanding and quantification of biogeochemical processes in glacial ecosystems. However, cell enumeration of glacier ice samples is challenging due to typically low cell numbers and the presence of interfering mineral particles. We quantified for the first time the abundance of microbial cells in surface ice from geographically distinct sites on the Greenland Ice Sheet (GrIS), using three enumeration methods: epifluorescence microscopy (EFM), flow cytometry (FCM), and quantitative polymerase chain reaction (qPCR). In addition, we reviewed published data on microbial abundance in glacier ice and tested the three methods on artificial ice samples of realistic cell (10(2)-10(7) cells ml(-1)) and mineral particle (0.1-100 mg ml(-1)) concentrations, simulating a range of glacial ice types, from clean subsurface ice to surface ice to sediment-laden basal ice. We then used multivariate statistical analysis to identify factors responsible for the variation in microbial abundance on the ice sheet. EFM gave the most accurate and reproducible results of the tested methodologies, and was therefore selected as the most suitable technique for cell enumeration of ice containing dust. Cell numbers in surface ice samples, determined by EFM, ranged from ~ 2 × 10(3) to ~ 2 × 10(6) cells ml(-1) while dust concentrations ranged from 0.01 to 2 mg ml(-1). The lowest abundances were found in ice sampled from the accumulation area of the ice sheet and in samples affected by fresh snow; these samples may be considered as a reference point of the cell abundance of precipitants that are deposited on the ice sheet surface. Dust content was the most significant variable to explain the variation in the abundance data, which suggests a direct association between deposited dust particles and cells and/or by their provision of limited nutrients to microbial communities on the GrIS.
Keywords: Greenland Ice Sheet; epifluorescence microscopy; flow cytometry; glacier ice; microbial abundance; multivariate analysis; quantitative PCR.
Figures


References
-
- Albers C. N., Bælum J., Jensen A., Jacobsen C. S. (2013). Inhibition of DNA polymerases used in Q-PCR by structurally different soil-derived humic substances. Geomicrobiol. J. 30, 675–681 10.1080/01490451.2012.758193 - DOI
-
- An L. Z., Chen Y., Xiang S.-R., Shang T.-C., Tian L.-D. (2010). Differences in community composition of bacteria in four glaciers in western China. Biogeosciences 7, 1937–1952 10.5194/bg-7-1937-2010 - DOI
LinkOut - more resources
Full Text Sources
Other Literature Sources

