Review
. 2015 Feb 4;5(1):1-18.
doi: 10.1159/000369576. eCollection 2015 Jan-Apr.

Effects of Tumor Necrosis Factor-α on Podocyte Expression of Monocyte Chemoattractant Protein-1 and in Diabetic Nephropathy

Affiliations
Review

Effects of Tumor Necrosis Factor-α on Podocyte Expression of Monocyte Chemoattractant Protein-1 and in Diabetic Nephropathy

Choon Hee Chung et al. Nephron Extra. .

Abstract

Background/aims: Tumor necrosis factor (TNF)-α is believed to play a role in diabetic kidney disease. This study explores the specific effects of TNF-α with regard to nephropathy-relevant parameters in the podocyte.

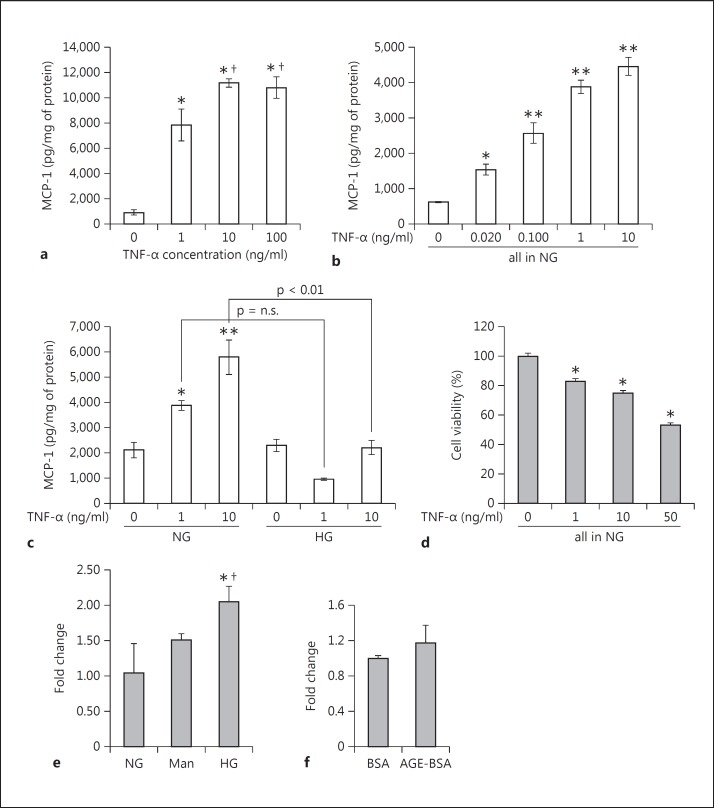
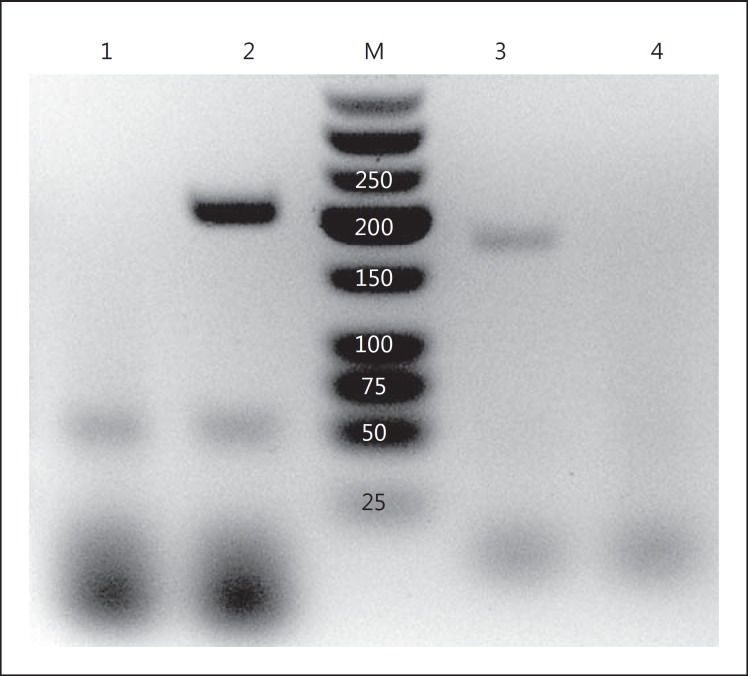
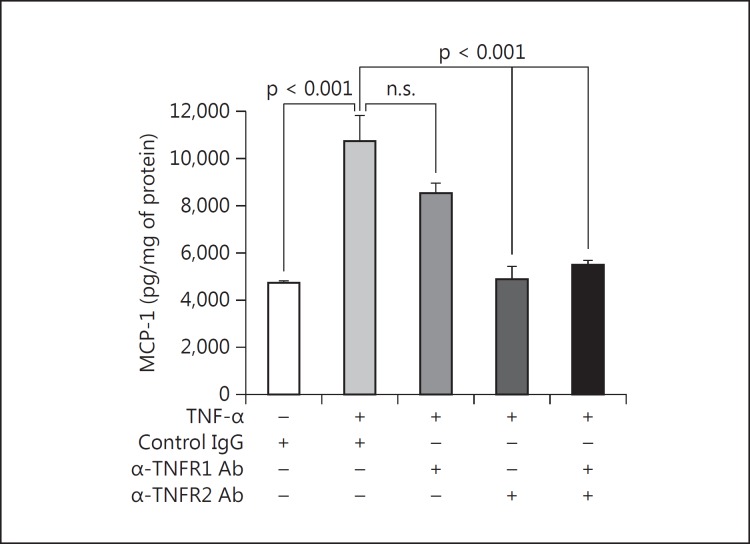
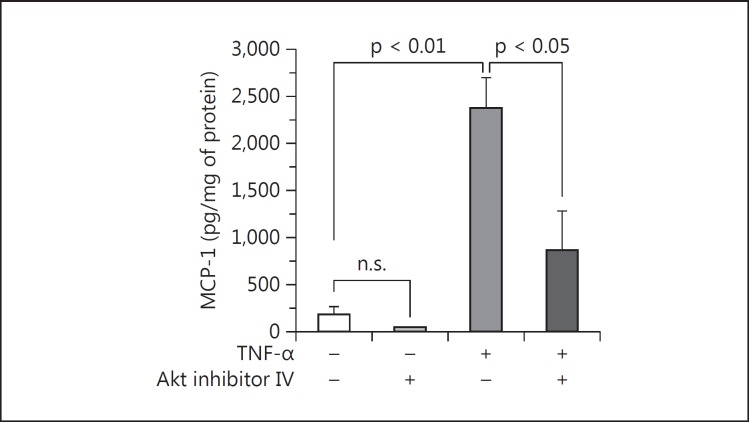
Methods: Cultured mouse podocytes were treated with recombinant TNF-α and assayed for production of monocyte chemoattractant protein-1 (MCP-1) by enzyme-linked immunosorbent assay (ELISA). TNF-α signaling of MCP-1 was elucidated by antibodies against TNF receptor (TNFR) 1 or TNFR2 or inhibitors of nuclear factor-kappaB (NF-κB), phosphatidylinositol 3-kinase (PI3K) or Akt. In vivo studies were done on male db/m and type 2 diabetic db/db mice. Levels of TNF-α and MCP-1 were measured by RT-qPCR and ELISA in the urine, kidney and plasma of the two cohorts and correlated with albuminuria.

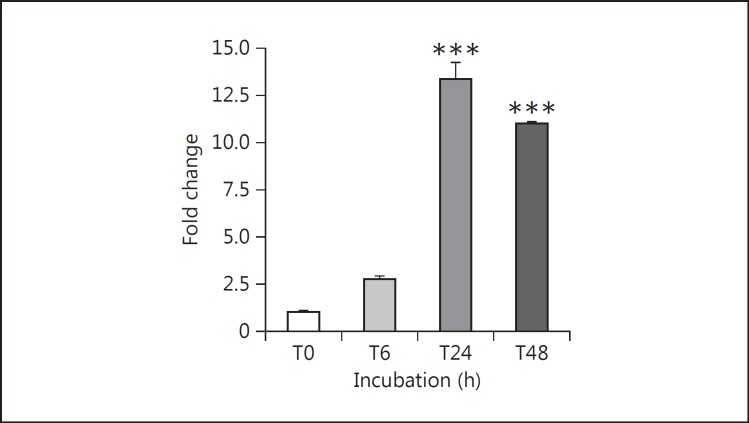
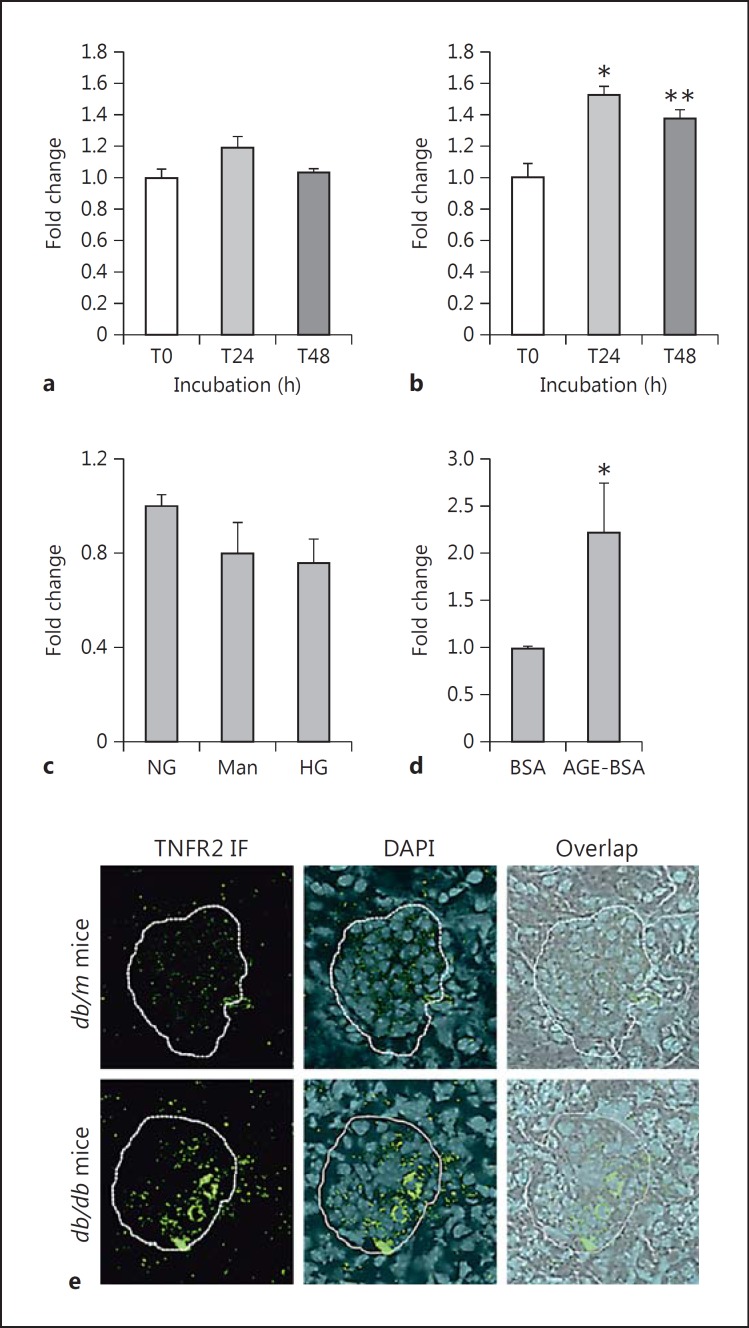
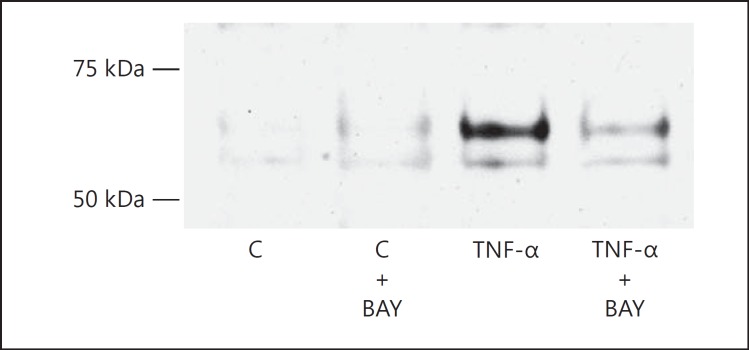
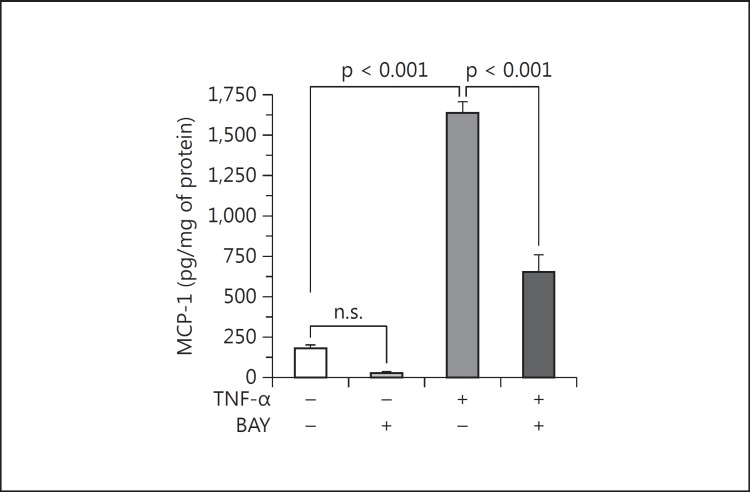
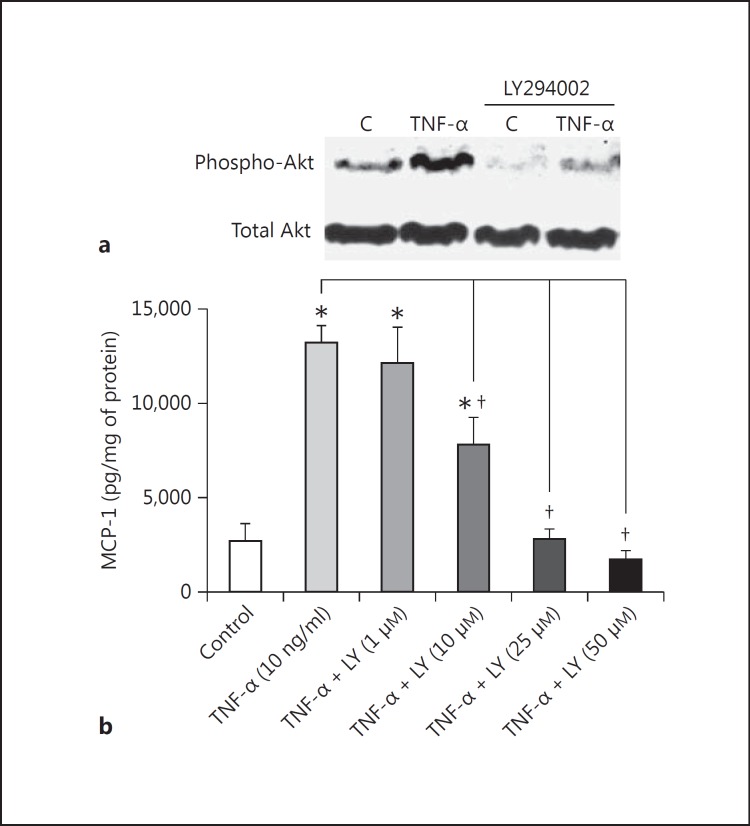
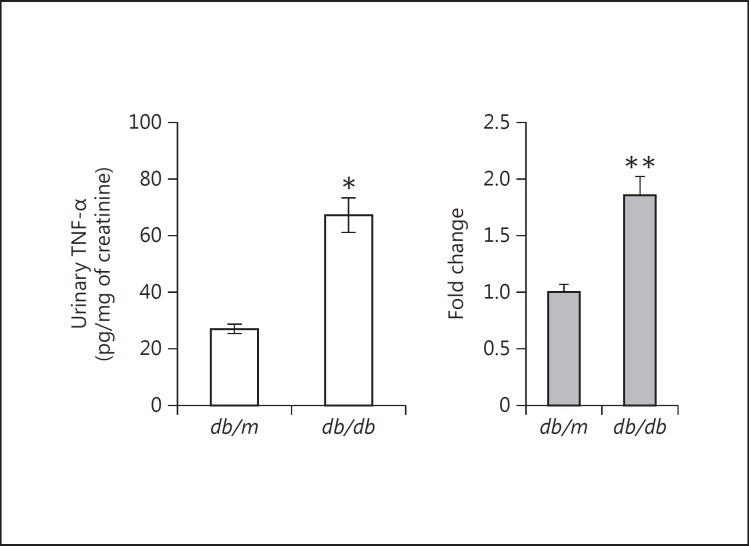
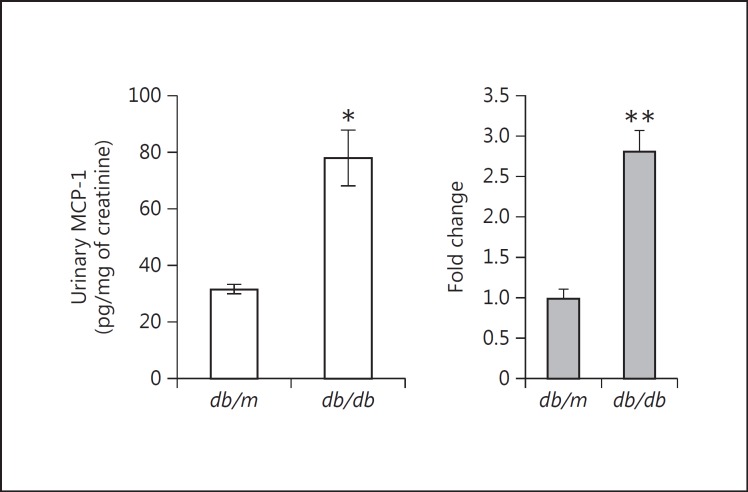
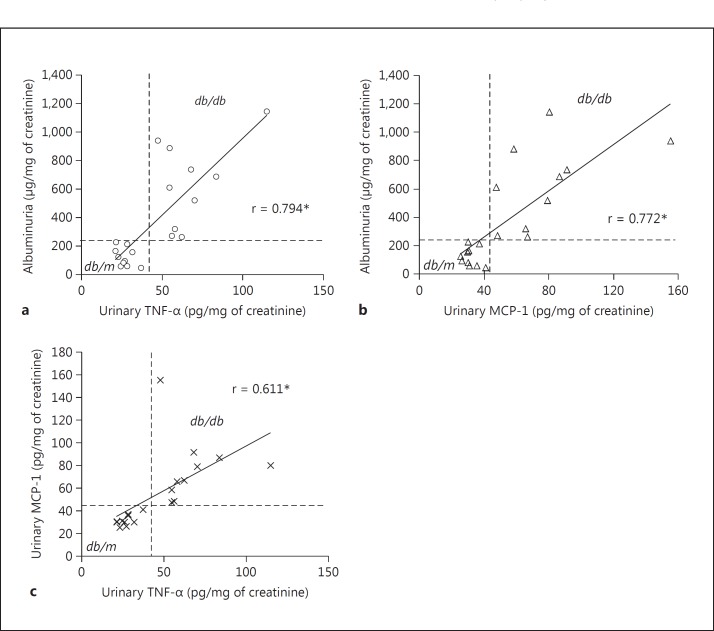
Results: Podocytes treated with TNF-α showed a robust increase (∼900%) in the secretion of MCP-1, induced in a dose- and time-dependent manner. Signaling of MCP-1 expression occurred through TNFR2, which was inducible by TNF-α ligand, but did not depend on TNFR1. TNF-α then proceeded via the NF-κB and the PI3K/Akt systems, based on the effectiveness of the inhibitors of those pathways. For in vivo relevance to diabetic kidney disease, TNF-α and MCP-1 levels were found to be elevated in the urine of db/db mice but not in the plasma.

Conclusion: TNF-α potently stimulates podocytes to produce MCP-1, utilizing the TNFR2 receptor and the NF-κB and PI3K/Akt pathways. Both TNF-α and MCP-1 levels were increased in the urine of diabetic db/db mice, correlating with the severity of diabetic albuminuria.

Keywords: Akt or protein kinase B; Albuminuria; Diabetic rodent model; Nuclear factor-kappaB; Phosphatidylinositol 3-kinase; TNF receptor 2.


Figures

Fig. 1
Fig. 1
TNF-α stimulates MCP-1 production and secretion in cultured podocytes. Differentiated mouse podocytes were treated with incremental doses of recombinant mouse TNF-α for 24 h. a Compared with control, TNF-α markedly increased MCP-1 concentrations, measured by ELISA, in the conditioned media (n = 4). * p < 0.005 vs. control, p < 0.05 vs. 1 ng/ml TNF-α. b More physiological concentrations of circulating TNF-α that are found in diabetes were also tested. At 20 and 100 pg/ml, the podocyte production of MCP-1 was significantly increased, in a graded dose-response manner with 1 and 10 ng/ml TNF-α (n = 3). * p < 0.05 and ** p < 0.01 vs. control (0 ng/ml TNF-α). c The effect of high glucose (HG) medium for 24 h was tested. Dextrose at 450 mg/dl seemed to inhibit the ability of TNF-α to induce podocyte MCP-1, especially at the 10 ng/ml dose, with a p < 0.01 for the comparison between normal glucose (NG) and HG (n = 3). * p < 0.05 and ** p < 0.01 vs. 0 ng/ml TNF-α in NG. d Testing cytotoxicity, an MTT assay showed that escalating doses of TNF-α from 0 (control) to 50 ng/ml progressively decreased podocyte viability (n = 6). * p < 0.01 vs. 0 ng/ml TNF-α in NG. e Dextrose at 540 mg/dl for 24 h stimulated TNF gene expression by about 2-fold compared with control (100 mg/dl dextrose) and osmotic control (30 mM mannitol) (n = 2). * p < 0.05 vs. NG. p < 0.05 vs. mannitol. f AGE-BSA at 50 μg/ml did not significantly affect TNF-α mRNA expression compared to control BSA (n = 2).
Fig. 2
Fig. 2
Time course of TNF-α stimulation of MCP-1 mRNA expression in cultured podocytes. Differentiated mouse podocytes were treated with 10 ng/ml recombinant mouse TNF-α for the indicated periods of time up to 48 h. TNF-α potently increased MCP-1 gene expression, assayed by RT-qPCR, in treated podocytes at 24 h (13.3-fold) and 48 h (11-fold). *** p < 0.005 vs. control (n = 3).
Fig. 3
Fig. 3
RT-PCR demonstrating gene expression of the TNFRs in podocytes. Total mRNA in the podocyte was DNase I-treated and then reverse-transcribed using oligo-dT. PCR was performed using exon-junction spanning primer pairs that are specific for the murine TNFR1 and TNFR2. On the agarose gel, PCR product bands are positive for both TNFR1 and TNFR2, with predicted amplicon sizes of 197 and 171 bp, respectively. As a negative control, the RT reaction was omitted, and the PCR bands no longer appear. 1 = TNFR1, DNase I-treated, not reverse-transcribed; 2 = TNFR1 primers; 3 = TNFR2 primers; 4 = TNFR2, DNase I-treated, not reverse-transcribed; M = marker in bp.
Fig. 4
Fig. 4
TNFR2 mediates TNF-α-induced MCP-1 in podocytes. Compared to a species-matched control antibody, a neutralizing anti-TNFR1 antibody had no significant effect on the induction of MCP-1 by 10 ng/ml TNF-α for 6 h. In contrast, a neutralizing anti-TNFR2 antibody completely prevented the stimulation of MCP-1 protein production. Combination therapy with both neutralizing antibodies had no further effect versus anti-TNFR2 alone. p values are as shown for the relevant comparisons (n = 3).
Fig. 5
Fig. 5
TNFR2, but not TNFR1, gene expression is induced by TNF-α. a Podocytes treated with 10 ng/ml TNF-α showed no change in TNFR1 mRNA levels by real-time RT-qPCR at either 24 or 48 h of treatment. b However, there was a significant increase in TNFR2 mRNA levels at both 24 and 48 h of treatment with TNF-α. * p < 0.01 and ** p < 0.05 vs. control at T0 (n = 3). c, d Further investigating TNFR2, we found that high glucose (540 mg/dl; HG) for 24 h did not change the expression but that AGE-BSA (50 μg/ml) for 48 h did increase TNFR2 mRNA expression by more than 2-fold (n = 2). * p < 0.05 vs. BSA. e By immunohistological fluorescence (IF), the amount of TNFR2 protein localized in the glomerulus was increased in the db/db vs. db/m mice. A representative photomicrograph is shown (×600 magnification).
Fig. 6
Fig. 6
TNF-α-induced increase in the nuclear localization of the p65 subunit of NF-κB (RelA) is inhibited by BAY 11-7082 (BAY). The representative Western blot performed on podocyte nuclear extracts shows that the p65 band, positioned between the 50- and 75-kDa molecular weight markers, only became prominent when treatment with 10 ng/ml TNF-α occurred. When the podocytes were pretreated with BAY 11-7082 to inhibit NF-κB signaling, TNF-α was markedly hampered from increasing the translocation of p65 into the nucleus, seen in the diminished Western band intensity of TNF-α + BAY vs. TNF-α alone. C = Control.
Fig. 7
Fig. 7
BAY 11-7082 (BAY) inhibits TNF-α from stimulating podocyte MCP-1 production. By blocking the activation of the NF-κB pathway, BAY 11-7082 significantly attenuated the stimulation of MCP-1 production by the podocyte in response to 10 ng/ml TNF-α for 12 h. BAY 11-7082 also seemed to attenuate podocyte MCP-1 production at baseline (in the absence of TNF-α), but BAY 11-7082 alone vs. control was not statistically significant. p values are as shown (n = 4).
Fig. 8
Fig. 8
The PI3K pathway is involved in TNF-α stimulation of MCP-1. a Representative Western blots of Phospho-Akt (pAkt) and Total Akt show that LY294002 was effective at inhibiting PI3K in cultured mouse podocytes. TNF-α at 10 ng/ml for 24 h increased the ratio of pAkt (Serine 473) to Akt, a measure of PI3K activation, by roughly 2-fold. This was wholly prevented by concurrent treatment with 25 μM LY294002, which also lowered the baseline pAkt/Akt ratio. b TNF-α at 10 ng/ml for 48 h increased the podocyte production of MCP-1, as expected, but the effect was steadily attenuated by escalating doses of LY294002 (LY), with the inhibition of TNF-α-induced MCP-1 becoming significant at 10 μM LY294002. Inhibition was complete at LY294002 doses of 25 μM and higher. * p < 0.05 vs. control. p < 0.05 vs. TNF-α (n = 4).
Fig. 9
Fig. 9
Beyond PI3K, Akt is involved in TNF-α stimulation of MCP-1 in podocytes. The marked increase in MCP-1 production due to 10 ng/ml TNF-α for 6 h was significantly blunted by pretreatment with 750 nM Akt inhibitor IV. In the absence of TNF-α, Akt inhibitor IV also seemed to reduce the expression of MCP-1 at baseline, but Akt inhibitor IV vs. control was not statistically significant. p values are as shown (n = 3).
Fig. 10
Fig. 10
TNF-α levels in the urine, kidney and plasma of db/db diabetic mice. Urinary TNF-α was significantly increased in db/db mice after 8 weeks of type 2 diabetes vs. control nondiabetic db/m mice. * p < 0.001 vs. db/m mice. However, there were no significant differences between db/m and db/db mice in the concentrations of TNF-α protein in the kidneys or plasma (data not shown). At the mRNA level, though, TNF-α was significantly increased in the kidneys of db/db versus db/m mice. ** p < 0.05 vs. db/m kidneys (n = 10 in both groups).
Fig. 11
Fig. 11
MCP-1 levels in the urine, kidney and plasma of db/db diabetic mice. Urinary MCP-1 was significantly increased in db/db mice that were diabetic for ∼8 weeks vs. db/m mice that remained nondiabetic. * p < 0.001 vs. db/m mice. However, there were no significant differences between db/m and db/db mice in the concentrations of MCP-1 protein in the kidneys or plasma (data not shown). At the mRNA level, though, MCP-1 was significantly increased in the kidneys of db/db vs. db/m mice. ** p < 0.05 vs. db/m kidneys (n = 10 in both groups).
Fig. 12
Fig. 12
Correlations between urinary TNF-α, urinary MCP-1 and albuminuria in db/m and db/db mice. a Urinary TNF-α was significantly correlated with albuminuria (r = 0.794). b Urinary MCP-1 was also well correlated with albuminuria (r = 0.772). c In turn, both urinary TNF-α and urinary MCP-1 were correlated with each other (r = 0.611). In each graph, the db/m and db/db datapoints cleanly segregate into opposite quadrants as drawn. * p < 0.001 for all comparisons (n = 10 in both groups).

References

    1. Nakamura T, Fukui M, Ebihara I, Osada S, Nagaoka I, Tomino Y, Koide H. mRNA expression of growth factors in glomeruli from diabetic rats. Diabetes. 1993;42:450–450. - PubMed
    1. Sugimoto H, Shikata K, Wada J, Horiuchi S, Makino H. Advanced glycation end products-cytokine-nitric oxide sequence pathway in the development of diabetic nephropathy: aminoguanidine ameliorates the overexpression of tumour necrosis factor-alpha and inducible nitric oxide synthase in diabetic rat glomeruli. Diabetologia. 1999;42:878–878. - PubMed
    1. Mensah-Brown EP, Obineche EN, Galadari S, Chandranath E, Shahin A, Ahmed I, Patel SM, Adem A. Streptozotocin-induced diabetic nephropathy in rats: the role of inflammatory cytokines. Cytokine. 2005;31:180–180. - PubMed
    1. Navarro JF, Mora C, Muros M, Garcia J. Urinary tumour necrosis factor-alpha excretion independently correlates with clinical markers of glomerular and tubulointerstitial injury in type 2 diabetic patients. Nephrol Dial Transplant. 2006;21:3428–3428. - PubMed
    1. Moriwaki Y, Inokuchi T, Yamamoto A, Ka T, Tsutsumi Z, Takahashi S, Yamamoto T. Effect of TNF-alpha inhibition on urinary albumin excretion in experimental diabetic rats. Acta Diabetol. 2007;44:215–215. - PubMed