. 2015:2015:509241.
doi: 10.1155/2015/509241. Epub 2015 Mar 17.

Intracellular oxidant activity, antioxidant enzyme defense system, and cell senescence in fibroblasts with trisomy 21

Affiliations

Intracellular oxidant activity, antioxidant enzyme defense system, and cell senescence in fibroblasts with trisomy 21

Víctor Rodríguez-Sureda et al. Oxid Med Cell Longev. 2015.

Abstract

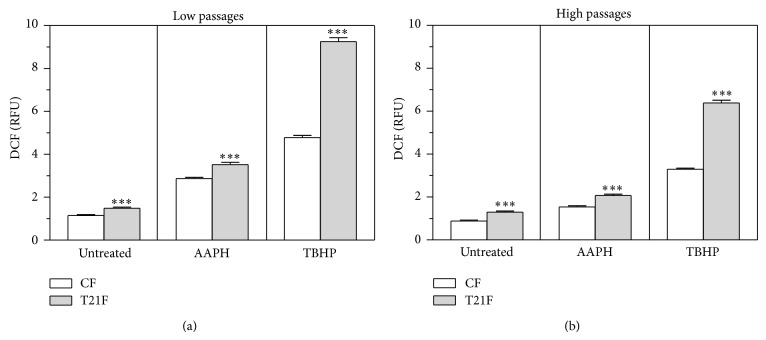
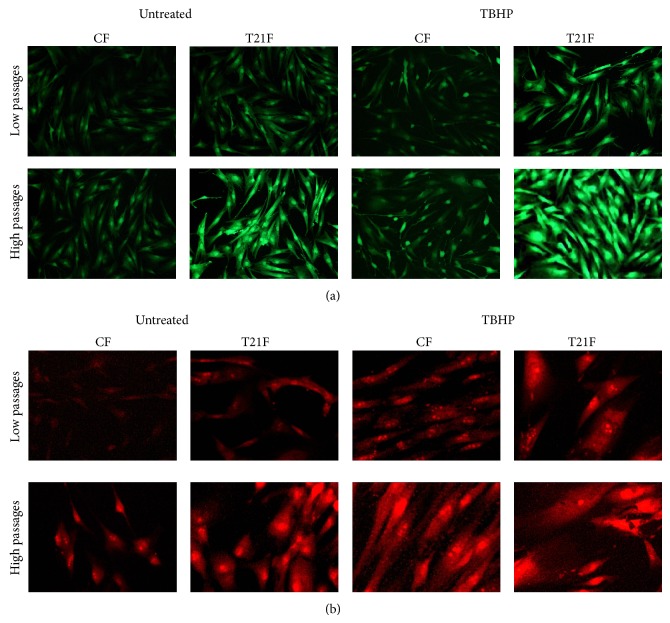
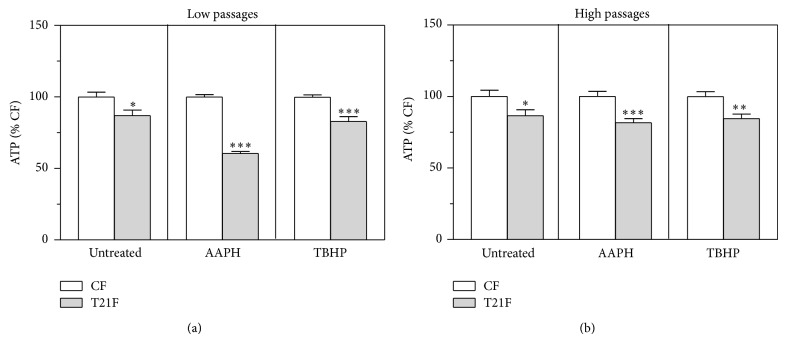
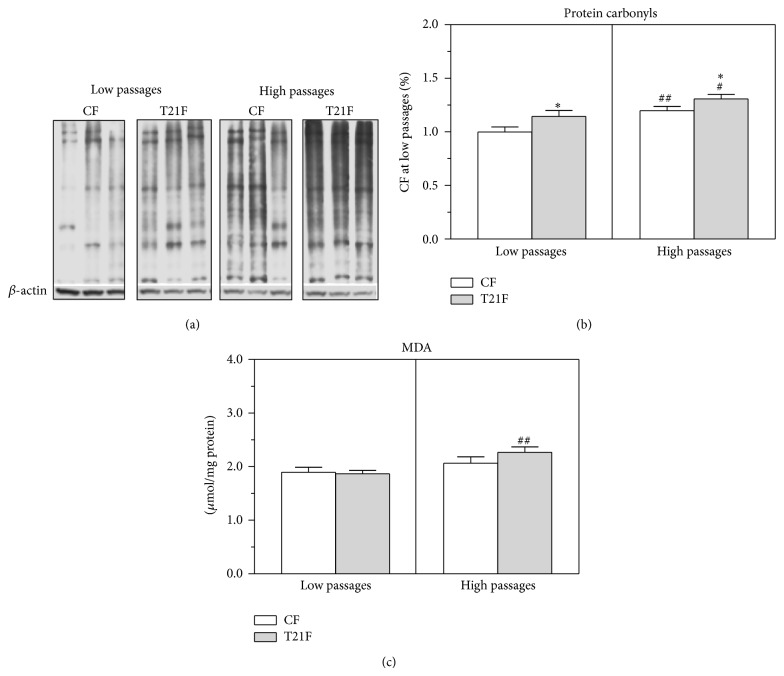
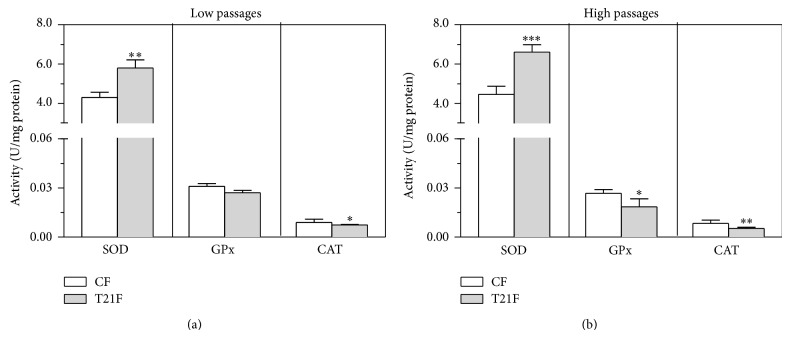
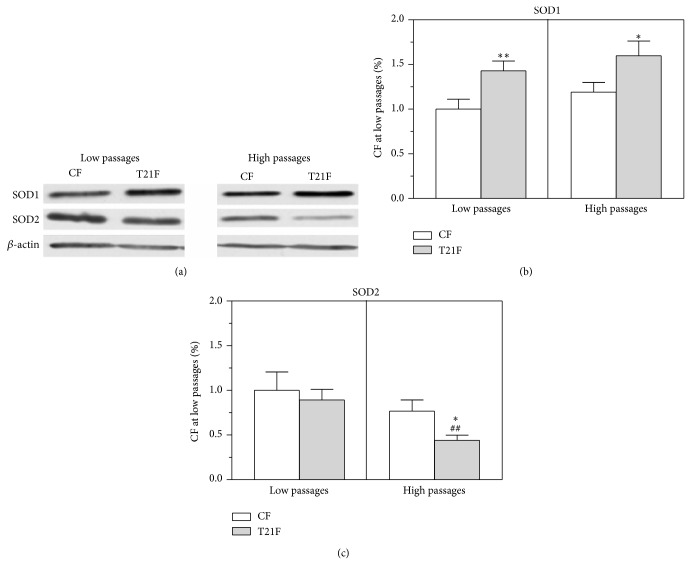
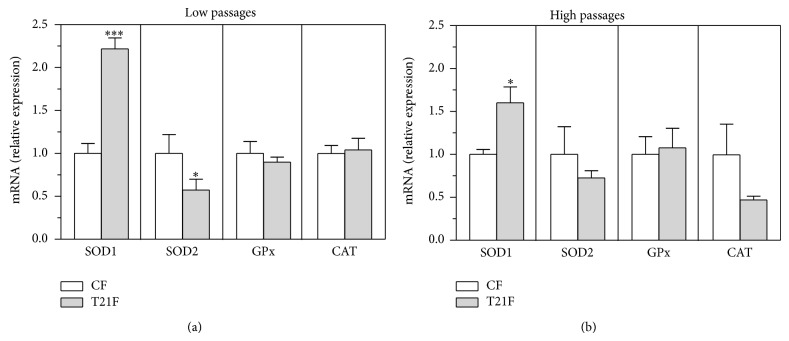
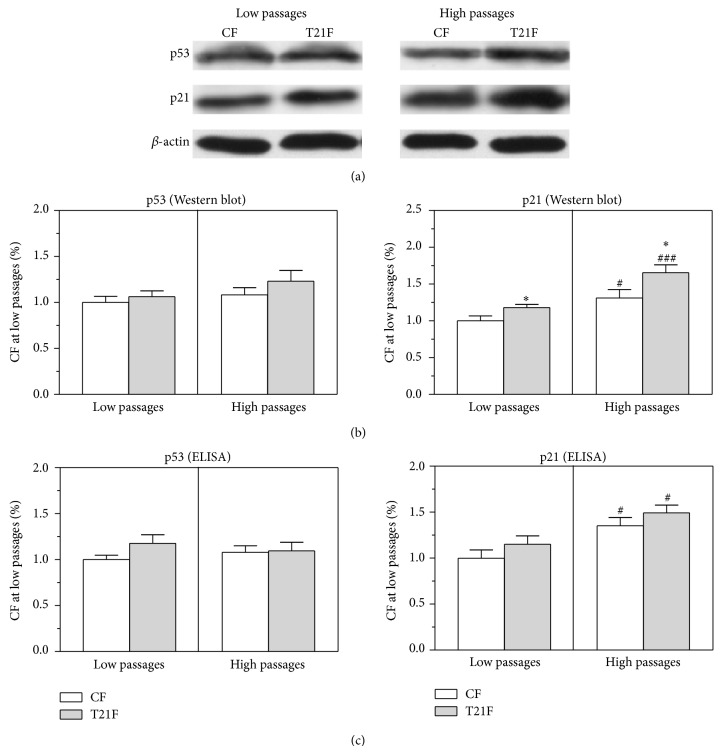
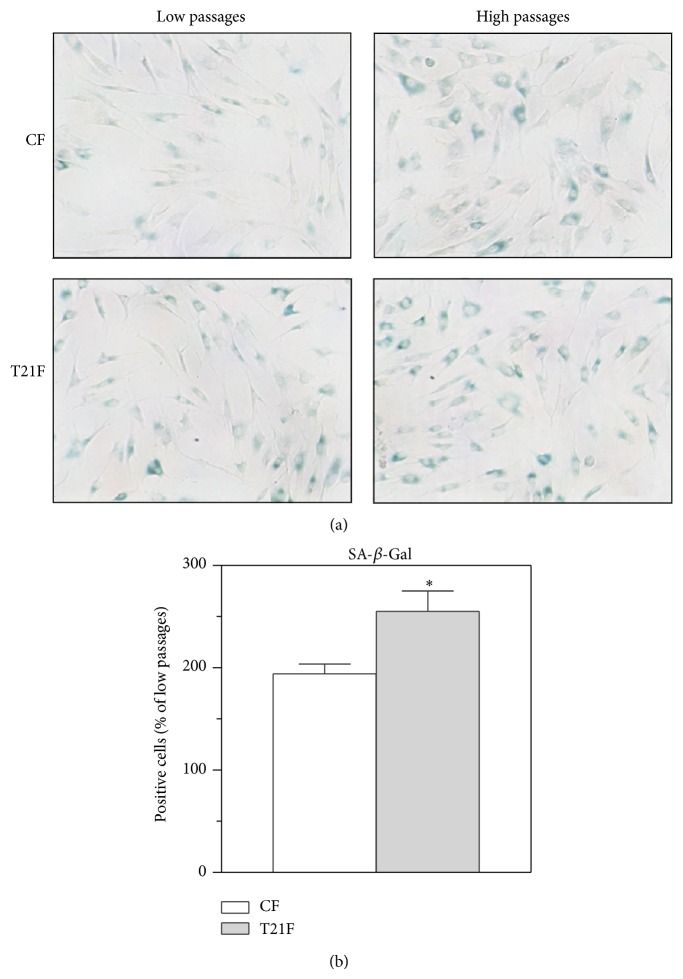
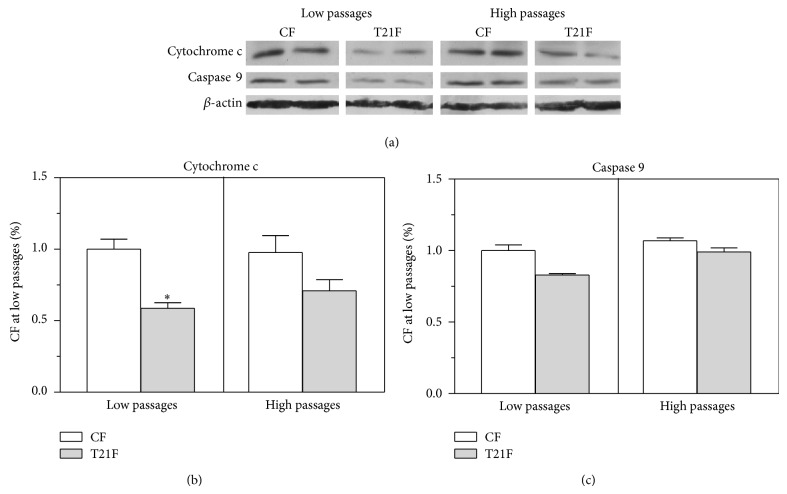
Down's syndrome (DS) is characterized by a complex phenotype associated with chronic oxidative stress and mitochondrial dysfunction. Overexpression of genes on chromosome-21 is thought to underlie the pathogenesis of the major phenotypic features of DS, such as premature aging. Using cultured fibroblasts with trisomy 21 (T21F), this study aimed to ascertain whether an imbalance exists in activities, mRNA, and protein expression of the antioxidant enzymes SOD1, SOD2, glutathione-peroxidase, and catalase during the cell replication process in vitro. T21F had high SOD1 expression and activity which led to an interenzymatic imbalance in the antioxidant defense system, accentuated with replicative senescence. Intracellular ROS production and oxidized protein levels were significantly higher in T21F compared with control cells; furthermore, a significant decline in intracellular ATP content was detected in T21F. Cell senescence was found to appear prematurely in DS cells as shown by SA-β-Gal assay and p21 assessment, though not apoptosis, as neither p53 nor the proapoptotic proteins cytochrome c and caspase 9 were altered in T21F. These novel findings would point to a deleterious role of oxidatively modified molecules in early cell senescence of T21F, thereby linking replicative and stress-induced senescence in cultured cells to premature aging in DS.


Figures

Figure 1
Figure 1
ROS production determined by dichlorofluorescein oxidative stress assay in fibroblasts with trisomy 21 (T21F) (n = 5) and controls (CF) (n = 5). Fibroblasts were grown in 96-well microplates and incubated for one hour with Hank's buffered salt solution (untreated) or supplemented with 10 mM AAPH or 100 µM TBHP. ROS production was evaluated at low (a) and high (b) passages with H2DCFA-DA. Values are expressed as mean ± SEM of six separate experiments performed in quadruplicate. Statistical differences between CF and T21F were analyzed by Student's t-test; *** P < 0.001.
Figure 2
Figure 2
ROS and mitochondrial superoxide anion detection by fluorescence microscopy in fibroblasts with trisomy 21 (T21F) (n = 5) and controls (CF) (n = 5). Fibroblasts were grown in 96-well microplates and incubated for one hour with Hank's buffered salt solution (untreated) or supplemented with 100 µM TBHP. The observed green fluorescent signal corresponds to the oxidation of the CM-H2DCFDA probe in response to intracellular ROS production in (a). The red fluorescent signal corresponds to the oxidation of the MitoSOX probe in response to superoxide radical production in the mitochondria (b). Images were taken with a fluorescence microscope at a total magnification of 200x.
Figure 3
Figure 3
Intracellular ATP levels in fibroblasts with trisomy 21 (T21F) (n = 5) and controls (CF) (n = 5). Fibroblasts were grown in 96-well microplates and incubated for one hour with Hank's buffered salt solution (untreated) or supplemented with 10 mM AAPH or 100 µM TBHP. Intracellular ATP content at low (a) and high (b) passages was expressed as a percentage of mean values obtained in the control group for each treatment. Results are expressed as mean ± SEM of six separate experiments performed in quadruplicate. Statistical differences between CF and T21F were analyzed by Student's t-test: * P < 0.05; ** P < 0.01; *** P < 0.001.
Figure 4
Figure 4
Protein carbonyls and malondialdehyde in fibroblasts with trisomy 21 (T21F) (n = 5) and controls (CF) (n = 5). (a) Representative protein carbonyl Western blot of DNPH-derivatized cell lysates in MPER. (b) Protein carbonyls were calculated from optical densities of the bands measured by an imaging technique. Results were normalized to the band intensities measured in untreated fibroblasts at low passages and expressed as mean ± SEM. (c) MDA was determined in cell lysates by HPLC. Values were corrected by the protein of the lysate and expressed as mean ± SEM. Statistical differences were analyzed by Student's t-test: high versus low passages (# P < 0.05; ## P < 0.01); T21F versus CF (* P < 0.05).
Figure 5
Figure 5
Antioxidant enzyme activities in fibroblasts with trisomy 21 (T21F) (n = 5) and controls (CF) (n = 5). Enzymatic activities in cell lysates were determined as described in Methods section. Results at low (a) and high (b) passages are expressed as mean ± SEM of 12 separate experiments performed in triplicate. Statistical differences between T21F and CF were analyzed by Student's t-test; * P < 0.05; ** P < 0.01; *** P < 0.001.
Figure 6
Figure 6
Effect of cell passages on SOD1 and SOD2 expression in fibroblasts with trisomy 21 (T21F) (n = 5) and controls (CF) (n = 5). SOD1 and SOD2 expression were analyzed by Western blot (a) and the bands were quantified by an imaging technique and normalized by β-actin (b and c). Results are normalized to the band intensities measured in untreated fibroblasts at low passages and expressed as mean ± SEM. Statistical differences were analyzed by Student's t-test: T21F versus CF (* P < 0.05; ** P < 0.01); high versus low passages (## P < 0.01).
Figure 7
Figure 7
Effect of cell passages on relative mRNA expression of SOD1, SOD2, GPx, and catalase (CAT) in fibroblasts with trisomy 21 (T21F) (n = 5) and controls (CF) (n = 5). mRNA expression was analyzed by quantitative real-time PCR in fibroblasts at low and high passages. Expression data were normalized by the means of the double delta Ct method. Results at low (a) and high passages (b) are expressed as mean ± SEM. Statistical differences were analyzed by Student's t-test: * P < 0.05; *** P < 0.001.
Figure 8
Figure 8
Effect of cell passages on p53 and p21 expression in fibroblasts with trisomy 21 (T21F) (n = 5) and controls (CF) (n = 5). (a) Representative Western blot of p53 and p21 in cell lysates in M-PER. (b) p53 and p21 expression was calculated from optical densities of the bands, measured by an imaging technique and normalized by β-actin. Results were normalized to the band intensities measured in untreated fibroblasts at low passages and expressed as mean ± SEM. (c) p53 and p21 were also quantified by ELISA in cell lysates of T21F and CF. Results were normalized to the optical densities measured in untreated fibroblasts at low passages and expressed as mean ± SEM. Statistical differences were analyzed by Student's t-test: T21F versus CF (* P < 0.05) and high versus low passages (# P < 0.05; ### P < 0.001).
Figure 9
Figure 9
Effect of in vitro replicative aging on SA-β-Gal expression in fibroblasts with trisomy 21 (T21F) (n = 5) and controls (CF) (n = 5). (a) Representative microphotographs of X-Gal staining in T21F and CF at low and high passages. (b) Fold increase in positive cell counts for X-Gal from low to high passages in T21F and CF. Cells were seeded in 12-well plates, stained with X-Gal. A minimum of 5 random fields were photographed ×100 with phase contrast for X-Gal-positive cell count. Results are expressed as mean ± SEM. Statistical differences between the two passage groups were analyzed by Student's t-test: * P < 0.05.
Figure 10
Figure 10
Effect of cell passages on cytochrome c and caspase 9 expression in fibroblasts with trisomy 21 (T21F) (n = 5) and controls (CF) (n = 5). (a) Representative Western blot of cytochrome c and caspase 9 at low and high passages. (b and c) Protein expression was calculated from optical densities of the bands, measured by an imaging technique and normalized by β-actin. Results were normalized to the band intensities measured in untreated fibroblasts at low passages and expressed as mean ± SEM. Statistical differences were analyzed by Student's t-test: * P < 0.05.

Similar articles

Cited by

References

    1. Mégarbané A., Ravel A., Mircher C., et al. The 50th anniversary of the discovery of trisomy 21: the past, present, and future of research and treatment of Down syndrome. Genetics in Medicine. 2009;11(9):611–616. doi: 10.1097/gim.0b013e3181b2e34c. - DOI - PubMed
    1. Nelson D. L., Gibbs R. A. The critical region in trisomy 21. Science. 2004;306(5696):619–621. doi: 10.1126/science.1105226. - DOI - PubMed
    1. Lockstone H. E., Harris L. W., Swatton J. E., Wayland M. T., Holland A. J., Bahn S. Gene expression profiling in the adult Down syndrome brain. Genomics. 2007;90(6):647–660. doi: 10.1016/j.ygeno.2007.08.005. - DOI - PubMed
    1. Cheon M. S., Dierssen M., Kim S. H., Lubec G. Protein expression of BACE1, BACE2 and APP in down syndrome brains. Amino Acids. 2008;35(2):339–343. doi: 10.1007/s00726-007-0618-9. - DOI - PubMed
    1. Coppus A. M. W., Fekkes D., Verhoeven W. M. A., Tuinier S., van Duijn C. M. Plasma levels of nitric oxide related amino acids in demented subjects with Down syndrome are related to neopterin concentrations. Amino Acids. 2010;38(3):923–928. doi: 10.1007/s00726-009-0300-5. - DOI - PMC - PubMed

Publication types

MeSH terms