

Learning to Classify Organic and Conventional Wheat - A Machine Learning Driven Approach Using the MeltDB 2.0 Metabolomics Analysis Platform
- PMID: 25853128
- PMCID: PMC4371749
- DOI: 10.3389/fbioe.2015.00035
Learning to Classify Organic and Conventional Wheat - A Machine Learning Driven Approach Using the MeltDB 2.0 Metabolomics Analysis Platform
Abstract
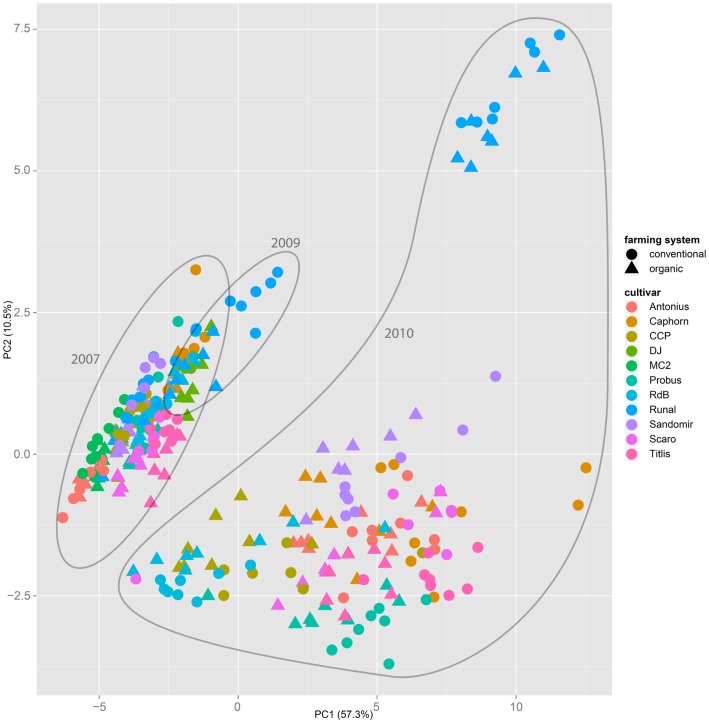
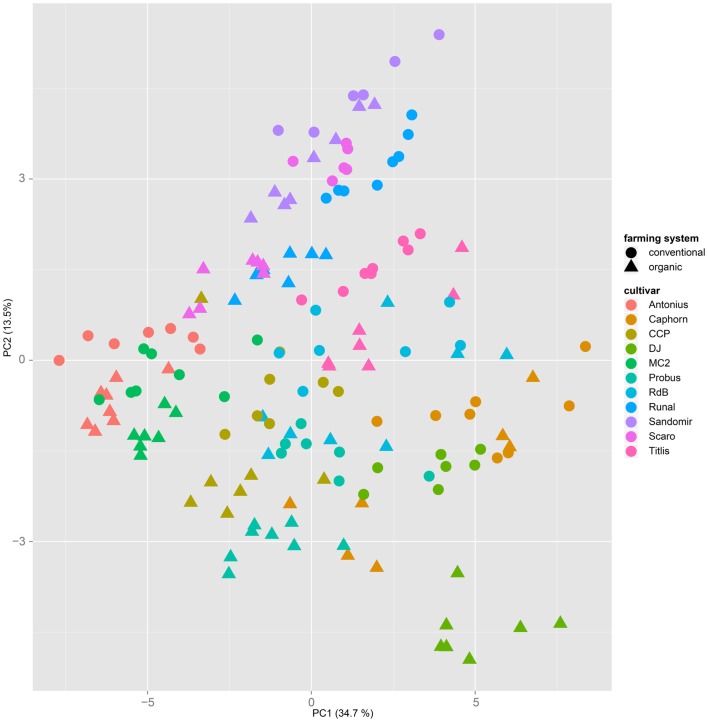
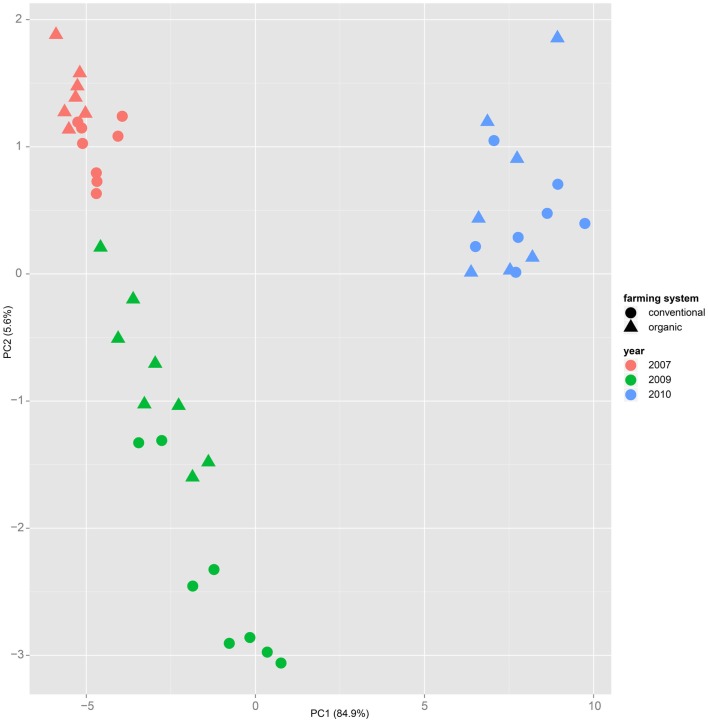
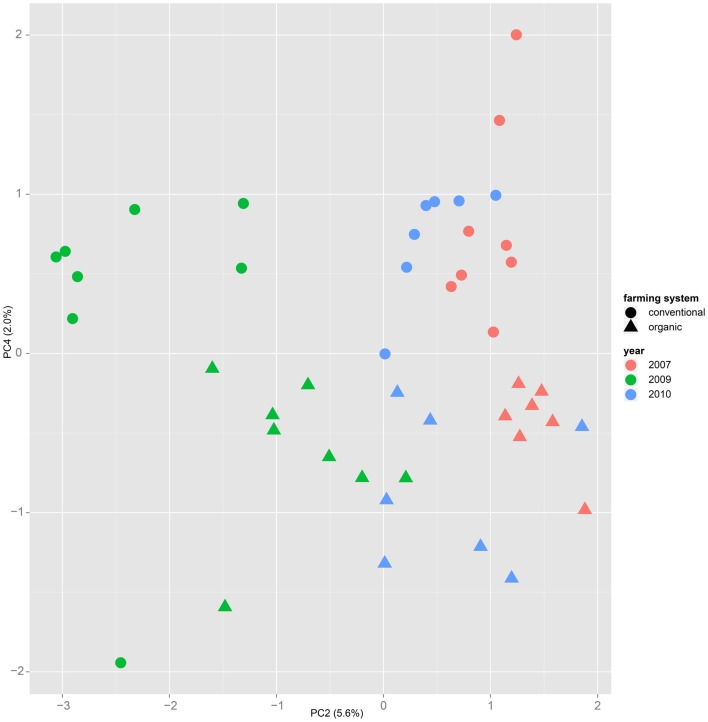
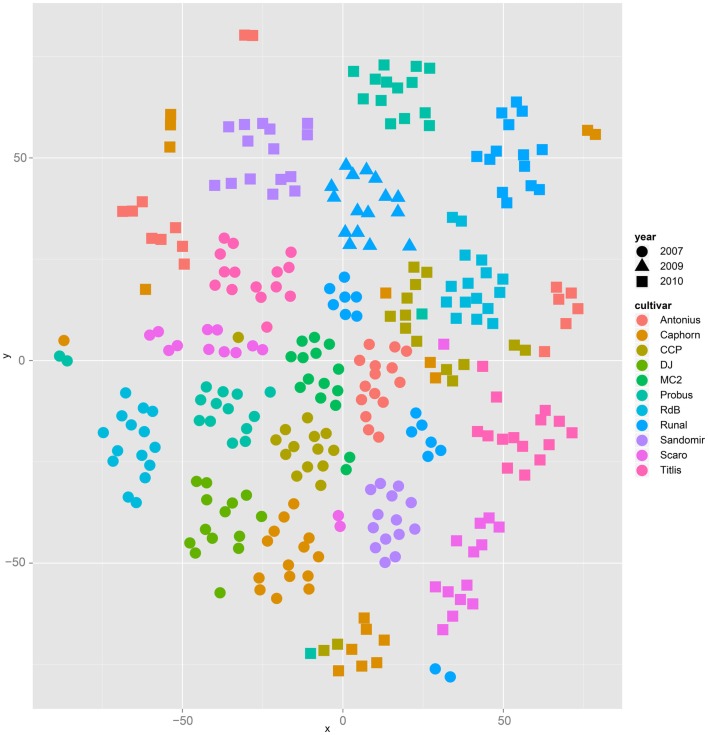
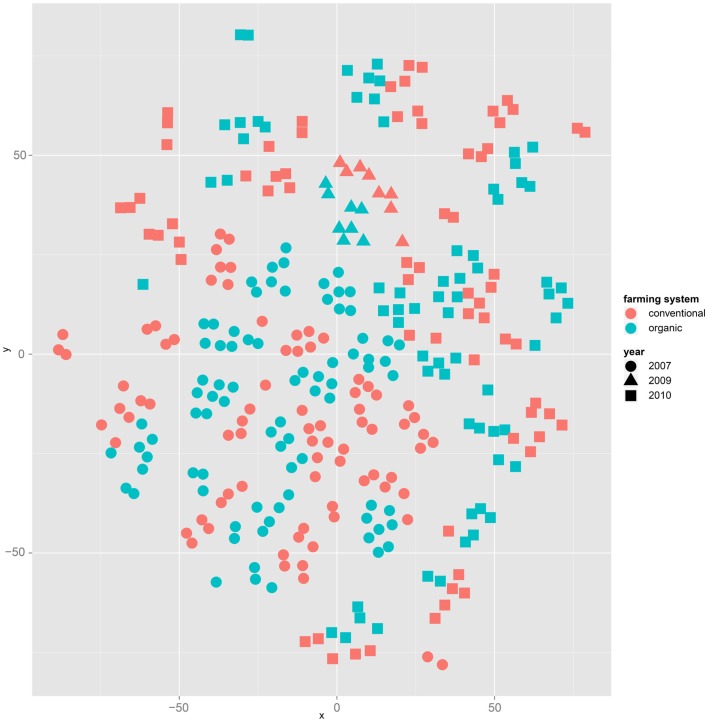
We present results of our machine learning approach to the problem of classifying GC-MS data originating from wheat grains of different farming systems. The aim is to investigate the potential of learning algorithms to classify GC-MS data to be either from conventionally grown or from organically grown samples and considering different cultivars. The motivation of our work is rather obvious nowadays: increased demand for organic food in post-industrialized societies and the necessity to prove organic food authenticity. The background of our data set is given by up to 11 wheat cultivars that have been cultivated in both farming systems, organic and conventional, throughout 3 years. More than 300 GC-MS measurements were recorded and subsequently processed and analyzed in the MeltDB 2.0 metabolomics analysis platform, being briefly outlined in this paper. We further describe how unsupervised (t-SNE, PCA) and supervised (SVM) methods can be applied for sample visualization and classification. Our results clearly show that years have most and wheat cultivars have second-most influence on the metabolic composition of a sample. We can also show that for a given year and cultivar, organic and conventional cultivation can be distinguished by machine-learning algorithms.
Keywords: computational metabolomics; food authentication; machine learning; metabolome informatics; metabolomics; organic farming; statistics.
Figures
Similar articles
-
Metabolite profiling on wheat grain to enable a distinction of samples from organic and conventional farming systems.J Sci Food Agric. 2014 Oct;94(13):2605-12. doi: 10.1002/jsfa.6566. Epub 2014 Feb 13. J Sci Food Agric. 2014. PMID: 24425170
-
MeltDB: a software platform for the analysis and integration of metabolomics experiment data.Bioinformatics. 2008 Dec 1;24(23):2726-32. doi: 10.1093/bioinformatics/btn452. Epub 2008 Sep 2. Bioinformatics. 2008. PMID: 18765459
-
Metabolite profiling of wheat grains (Triticum aestivum L.) from organic and conventional agriculture.J Agric Food Chem. 2006 Oct 18;54(21):8301-6. doi: 10.1021/jf0615451. J Agric Food Chem. 2006. PMID: 17032043
-
How organic farming of wheat may affect the sourdough and the nutritional and technological features of leavened baked goods.Int J Food Microbiol. 2016 Dec 19;239:44-53. doi: 10.1016/j.ijfoodmicro.2016.07.013. Epub 2016 Jul 12. Int J Food Microbiol. 2016. PMID: 27460169 Review.
-
Machine Learning Applications for Mass Spectrometry-Based Metabolomics.Metabolites. 2020 Jun 13;10(6):243. doi: 10.3390/metabo10060243. Metabolites. 2020. PMID: 32545768 Free PMC article. Review.
Cited by
-
Employing and Interpreting a Machine Learning Target-Cognizant Technique for Analysis of Unknown Signals in Multiple Reaction Monitoring.IEEE Access. 2021;9:24727-24737. doi: 10.1109/access.2021.3056955. Epub 2021 Feb 10. IEEE Access. 2021. PMID: 33796430 Free PMC article.
-
Metabolomics for organic food authentication: Results from a long-term field study in carrots.Food Chem. 2018 Jan 15;239:760-770. doi: 10.1016/j.foodchem.2017.06.161. Epub 2017 Jul 1. Food Chem. 2018. PMID: 28873633 Free PMC article.
-
Machine Learning Methods for Analysis of Metabolic Data and Metabolic Pathway Modeling.Metabolites. 2018 Jan 11;8(1):4. doi: 10.3390/metabo8010004. Metabolites. 2018. PMID: 29324649 Free PMC article. Review.
References
-
- Breiman L. (2001). Random forests. Mach. Learn. 45, 5–3210.1023/A:1017934522171 - DOI
LinkOut - more resources
Full Text Sources
Other Literature Sources
Miscellaneous