. 2015 Mar 17:2:14.
doi: 10.3389/fmed.2015.00014. eCollection 2015.

Neuroinflammation induced by intracerebroventricular injection of microbial neuraminidase

Affiliations

Neuroinflammation induced by intracerebroventricular injection of microbial neuraminidase

Pablo Granados-Durán et al. Front Med (Lausanne). .

Abstract

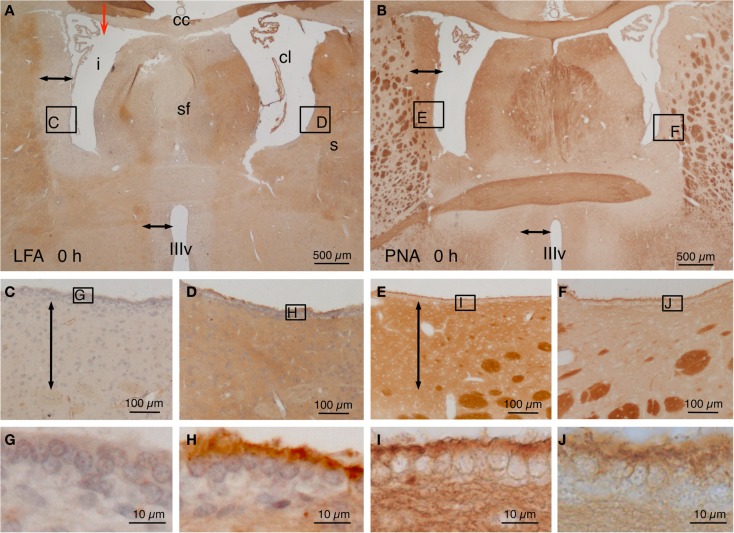
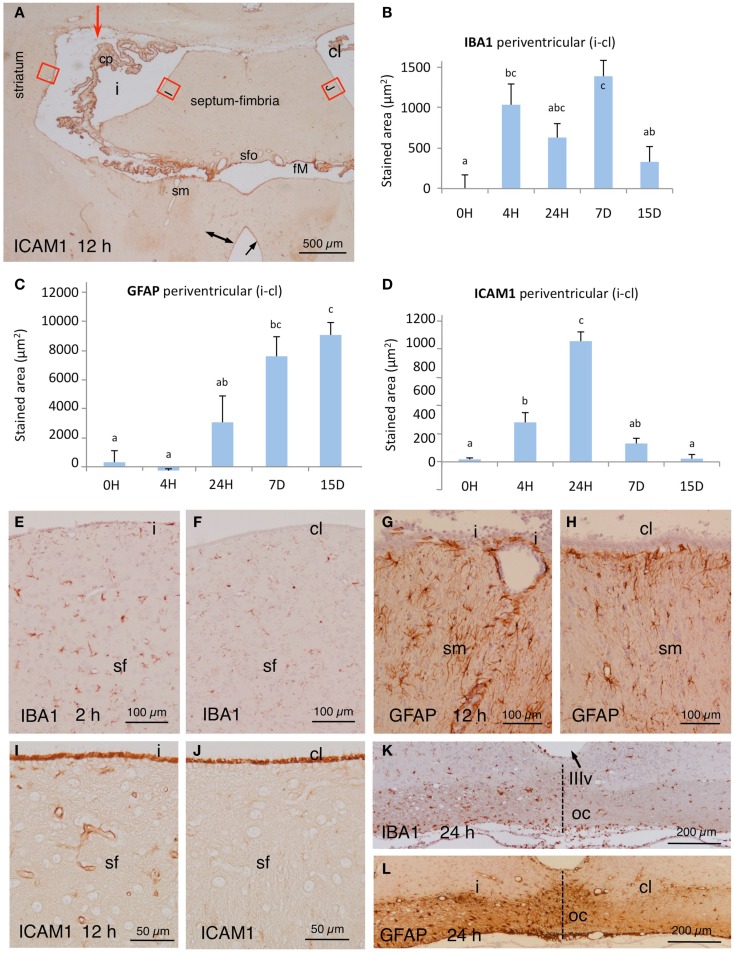
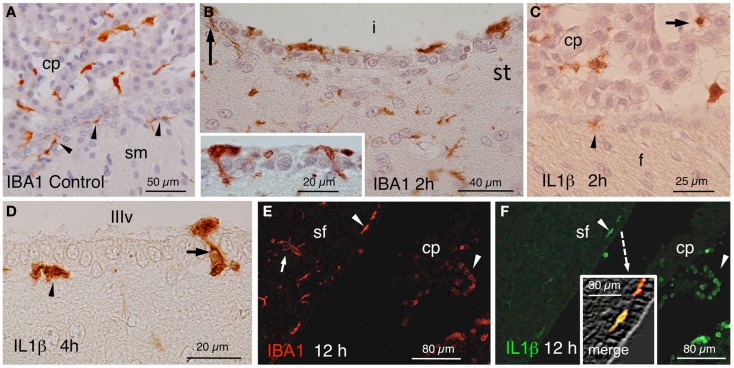
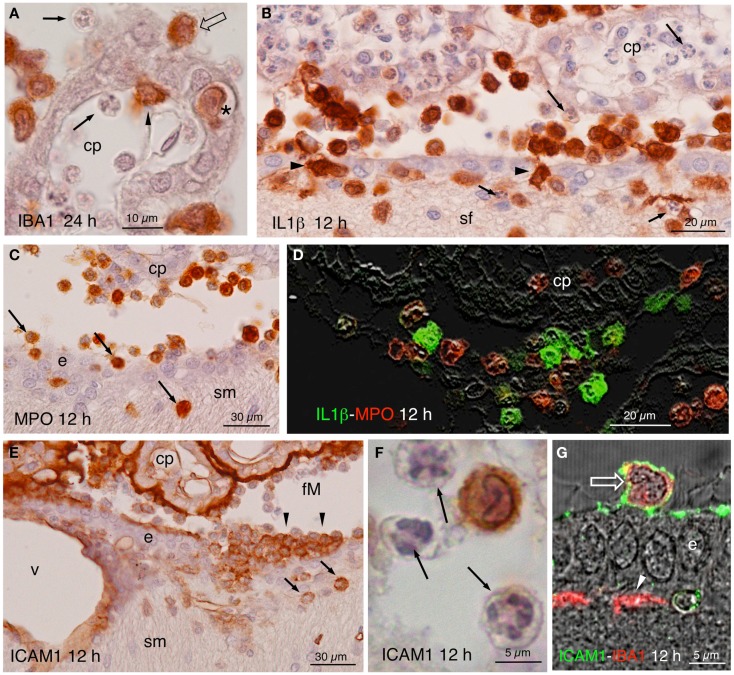
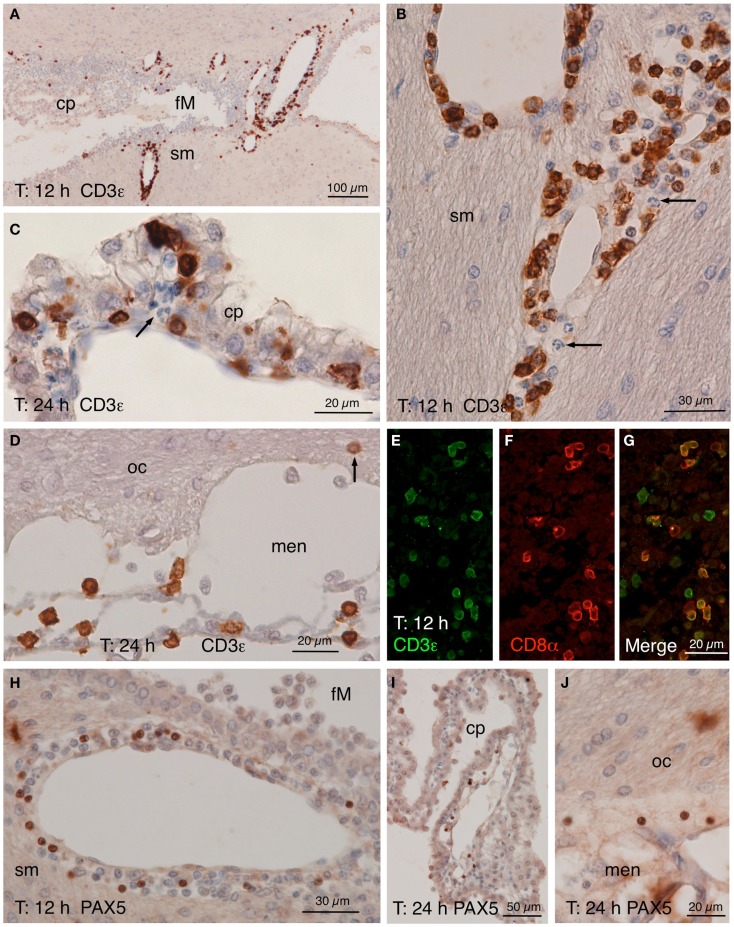
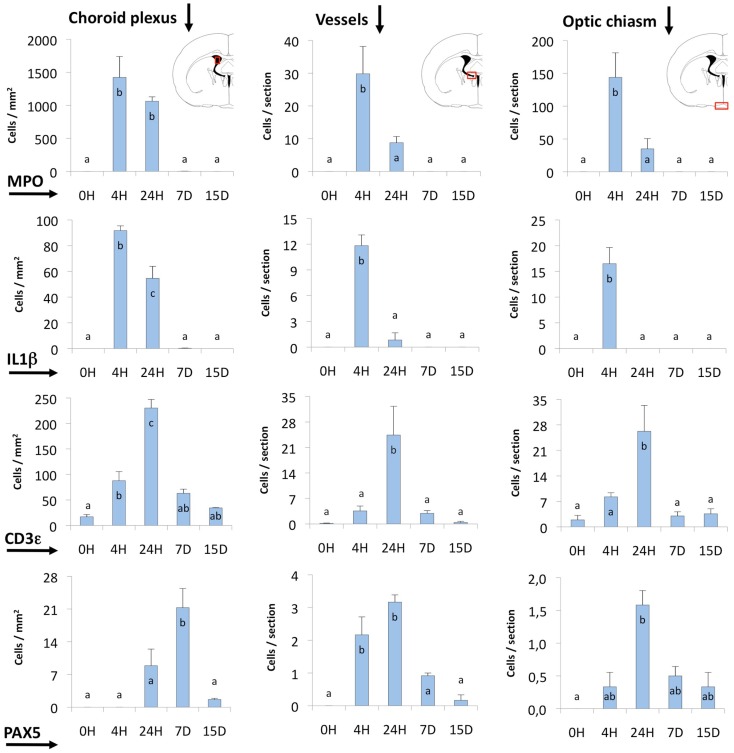
In the present paper, we describe the facts that took place in the rat brain after a single injection of the enzyme neuraminidase from Clostridium perfringens into the right lateral ventricle. After injection, it diffused through the cerebrospinal fluid of the ipsilateral ventricle and the third ventricle, and about 400 μm into the periventricular brain parenchyma. The expression of ICAM1 in the endothelial cells of the periventricular vessels, IBA1 in microglia, and GFAP in astrocytes notably increased in the regions reached by the injected neuraminidase. The subependymal microglia and the ventricular macrophages begun to express IL1β and some appeared to cross the ependymal layer. After about 4 h of the injection, leukocytes migrated from large venules of the affected choroid plexus, the meninges and the local subependyma, and infiltrated the brain. The invading cells arrived orderly: first neutrophils, then macrophage-monocytes, and last CD8α-positive T-lymphocytes and B-lymphocytes. Leukocytes in the ventricles and the perivascular zones penetrated the brain parenchyma passing through the ependyma and the glia limitans. Thus, it is likely that a great part of the damage produced by microorganism invading the brain may be due to their neuraminidase content.

Keywords: brain; ependyma; inflammation; neuraminidase; ventricle.


Figures

Figure 1
Figure 1
Lectin histochemistry in NA-injected rat brains immediately after the injection. (A,B) The site of injection is indicated with a red arrow in (A). Note a LFA-negative and PNA-positive halo around the injected lateral ventricle (i) and the third ventricle (IIIv) (double-headed arrow) but not the contralateral ventricle (cl). (C–F) Details of the zones squared in (A,B) showing the negative or positive halo (double-headed arrows). The squared areas are shown in detail in the following pictures. (G–J) The surface of the ependymal cells was LFA-negative (G) and PNA-positive (I) in the injected ventricle, whereas it was LFA-positive (H) and almost PNA-negative (J) in the contralateral ventricle. cc, corpus callosum; cl, contralateral ventricle; i, injected lateral ventricle; s, striatum; sf, septum-fimbria; IIIv, third ventricle. Sections in (A,C,D,G,H) were counterstained with hematoxilin–eosin.
Figure 2
Figure 2
(A) Panoramic view at the level of the foramen of Monro (fM) of the brain of an animal sacrificed 12 h after NA injection (red arrow points injection site). The tissue was immunostained with ICAM1. Note an increase in the immunoreactivity in the vessels of the affected periventricular zones (double-headed arrow) and the strong reactivity of the choroid plexus (cp) and the surface of the ependymal cells (arrow). The red squares correspond roughly to the zones used for quantification; some are detailed in (I,J). (B–D) Quantification of the expression of IBA1, GFAP, and ICAM1 in the periventricular area at selected times post-injection. Red squares in (A) point approximately the areas where micrographs were taken in the striatum and the septum. The values represented are the difference of stained area between the injected lateral ventricle (i) minus de contralateral ventricle (cl). The bars are the mean ± SEM of five animals analyzed. Letters (a–c) on bars indicate the absence (same letter) or presence (different letter) of a significant difference between groups (α = 0.05). (E,F) Immunoreactivity to IBA1 in the periventricular region at the level of the septum-fimbria (sf) in the injected (i) and the contralateral (cl) ventricles, 2 h after NA injection. (G,H) Details of GFAP staining in the stria medullaris (sm) in the injected (i) and the contralateral (cl) sides 12 h after the administration of NA. (I,J) Details [red squares in (A)] of the immunoreactivity to ICAM1 in the septum-fimbria (sf) subependymal parenchyma of the injected (i) and the contralateral (cl) sides 12 h after the injection of NA. Note the strong immunoreactivity of the ependymal surface in both ventriculi. (K,L) Twenty-four hours after NA injection, the optic chiasm (oc) beneath the third ventricle (IIIv) showed a higher IBA1 and GFAP staining in the injected (i) than in the contralateral side (cl). cl, contralateral ventricle; cp, choroid plexus; fM, foramen of Monro; i, injected lateralventricle; sfo, subfornical organ; sm, stria medularis; sf, septum-fimbria; oc, optic chiasm; IIIv, third ventricle.
Figure 3
Figure 3
(A) IBA1-positive epiplexus and subependymal cells (arrowheads) in a vehicle-injected specimen sacrificed immediately after the injection. (B) Detail of the striatal (st) side of the injected lateral ventricle (i) near the inferior sulcus of the lateral ventricle 2 h after the injection. Note IBA1-positive cells over, beneath and among the ependymal cells (arrow and inset). (C) Two hours after the injection of NA, scattered IL1β-positive cells occurred inside (arrow) and outside the choroid plexus (cp) as well as in the subependyma (arrowhead) of the injected ventricle. (D) Detail of IL1β-stained cells in the subependyma (arrowhead) and crossing the ependymal wall (arrow) of the third ventricle (IIIv) 4 h after the injection of NA. (E,F) Double immunofluorescence with anti-IBA1 (red) and anti-IL1β (green). Double-stained cells appear in the ventricle and the subependyma (arrowheads, and merge detailed in the inset of (F) showing a double-stained subependymal cell). Many IBA1-positive cells in the brain parenchyma were not immunoreactive to IL1β [arrow in (E)]. cp, choroid plexus; sf, septum-fimbria; sm, stria medullaris; (i), injected lateral ventricle; st, striatal wall of the lateral ventricle; f, fornix; IIIv, third ventricle.
Figure 4
Figure 4
(A) Infiltrating IBA1-positive cells in the choroid plexus (cp) of the injected ventricle at 24 h post-injection. Polymorphonucleated cells inside and outside the choroid plexus were never stained (arrows); positive cells occurred inside (arrowhead) outside (open arrow), and in transit (asterisk). (B) Twelve hours after NA injection, abundant IL1β-positive cells were seen in the ventricle, penetrating the ependyma (arrowheads) and in the brain parenchyma, in the septum-fimbria (sf) area. Polymorphonuclear negative cells, present inside and outside choroid plexus (cp), the ventricle and the parenchyma (arrows), were also numerous. (C) MPO immunostaining in the region of the foramen of Monro, where positive cells were found near the choroid plexus (cp), the ependyma (e), and penetrating the brain parenchyma (arrows) in the region of the stria medullaris (sm). (D) IL1β (green) and MPO (red) double immunofluorescence in the region of the choroid plexus (cp) of the injected ventricle 12 h after NA administration. No double-stained cells were detected. (E) Detail of a zone of the foramen of Monro (fM) comprising a part of the stria medullaris (sm) 12 h after the injection of NA, immunostained with anti-NCAM1. The surface of the ependymal cells (e) and of the choroid plexus (cp) and the wall of the local vessels (v) was strongly stained. Some infiltrating cells in the ventricle (arrowheads) and in the brain parenchyma (arrows) were also positive. (F) Detail of an immunoreactive cell with lobed nucleus in the ventricle. The polymorphonucleated leukocytes (arrows) were never immunoreactive to ICAM1. (G) Some cells present in the ventricle were double-stained with ICAM1 and IBA1 (open arrow). The ICAM1-positive surface of the ependymal cells (e) can be observed, as well as some IBA1-positive subependymal cells (arrowhead). cp, choroid plexus; sf, septum-fimbria; e, ependyma; sm, stria medullaris; fM, foramen of Monro; v, vessels.
Figure 5
Figure 5
CD3ε, CD8α, and PAX5 immunostainings. (A–D) CD3ε staining in the zone of the foramen of Monro (fM) of the injected ventricle comprising a part of the stria medullaris [sm, (A)]. Many positive cells occurred in the perivascular spaces of the local large venules 12 h after NA injection. A detailed view (B) of the vessels in the stria medullaris (sm) shows that many positive cells have smooth nuclei while polymorphonucleated cells (arrow) are negative. (C) Twenty-four hours after the injection, some positive cells seemed to cross the ependyma of the choroid plexus (cp). (D) Positive cells were also present in the meninges (men) next to the optic chiasm (oc), and few appeared to penetrate the brain parenchyma (arrow). (E–G) Double immunofluorescence of lymphocytes in a 12 h post-injection brain section. Most CD3ε-positive cells [(E), green] found in the perivascular spaces of the large vessels were also positive for CD8α [(F), red]. (H–J) PAX5 immunostaining showing positive cells in the wall of the large vessels around the foramen of Monro [fM; (H)], although they were not as abundant as CD3ε-positive cells. Few PAX5-positive nuclei were also found in the choroid plexus (cp) of the injected lateral ventricle (I) as well as in the meninges (men) close to the optic chiasm [oc; (J)]. cp, choroid plexus; fM, foramen of Monro; men, meninges; oc, optic chiasm; sm, stria medullaris.
Figure 6
Figure 6
Quantification of MPO, IL1β, CD3ε, and PAX5 immunostained cells. The quantification was done in three different locations (indicated by red squares in the coronal section diagrams): (i) the choroid plexus of the injected lateral ventricle, (ii) the area comprising large vessels close to the foramen of Monro and near the subfornical organ (Vessels), and (iii) the zone of the meninges and the optic chiasm. Most of the cells stained and counted were infiltrating cells. MPO- and IL1β-positive cells (neutrophils and macrophagic cells, respectively) reached a maximum before 24 h. The peak of CD3ε and PAX5-positive cells (probably T- and B-lymphocytes) occurred later, and these cells remained longer (even up to 15 days) in some locations. The bars represent the mean ± SEM of five animals. Letters (a–c) on bars indicate the absence (same letter) or presence (different letter) of a significant difference between groups (α = 0.05). Time 0 post-injection of NA (0 h) is considered the baseline population of positive cells.

Similar articles

Cited by

References

    1. Graeber MB, Li W, Rodriguez ML. Role of microglia in CNS inflammation. FEBS Lett (2011) 585:3798–805.10.1016/j.febslet.2011.08.033 - DOI - PubMed
    1. Jang H, Boltz D, Sturm-Ramirez K, Shepherd KR, Jiao Y, Webster R, et al. Highly pathogenic H5N1 influenza virus can enter the central nervous system and induce neuroinflammation and neurodegeneration. Proc Natl Acad Sci U S A (2009) 106:14063–8.10.1073/pnas.0900096106 - DOI - PMC - PubMed
    1. Gerber J, Nau R. Mechanisms of injury in bacterial meningitis. Curr Opin Neurol (2010) 23:312–8.10.1097/WCO.0b013e32833950dd - DOI - PubMed
    1. Majde JA. Neuroinflammation resulting from covert brain invasion by common viruses – a potential role in local and global neurodegeneration. Med Hypotheses (2010) 75:204–13.10.1016/j.mehy.2010.02.023 - DOI - PMC - PubMed
    1. Rock KL, Latz E, Ontiveros F, Kono H. The sterile inflammatory response. Annu Rev Immunol (2010) 28:321–4210.1146/annurev-immunol-030409-101311 - DOI - PMC - PubMed

LinkOut - more resources