. 2015 Apr 8:5:9604.
doi: 10.1038/srep09604.

mTORC1 maintains the tumorigenicity of SSEA-4(+) high-grade osteosarcoma

Affiliations

mTORC1 maintains the tumorigenicity of SSEA-4(+) high-grade osteosarcoma

Wu Zhang et al. Sci Rep. .

Erratum in

Abstract

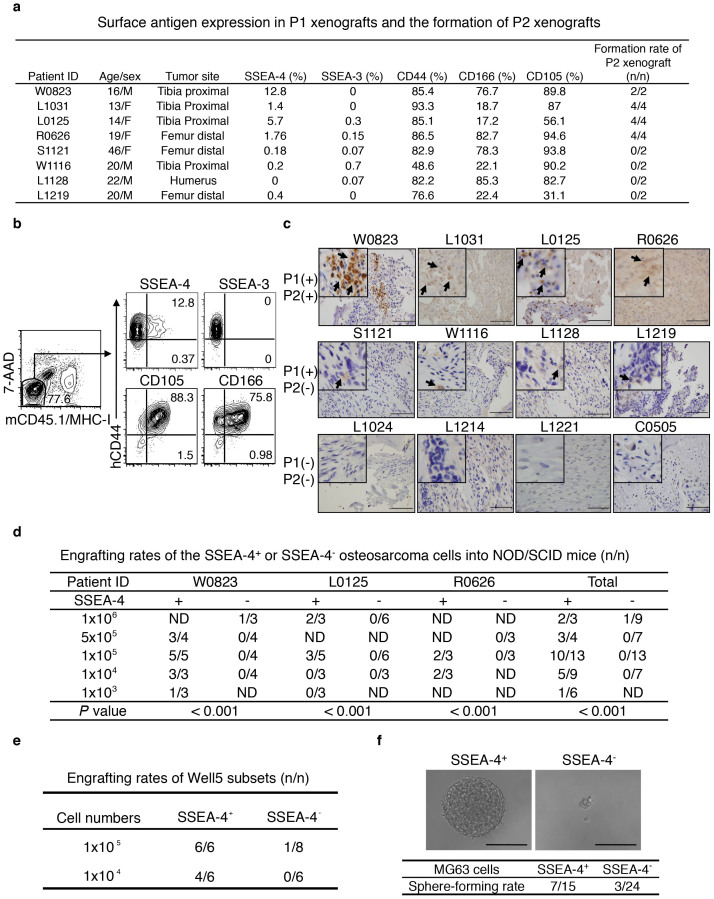
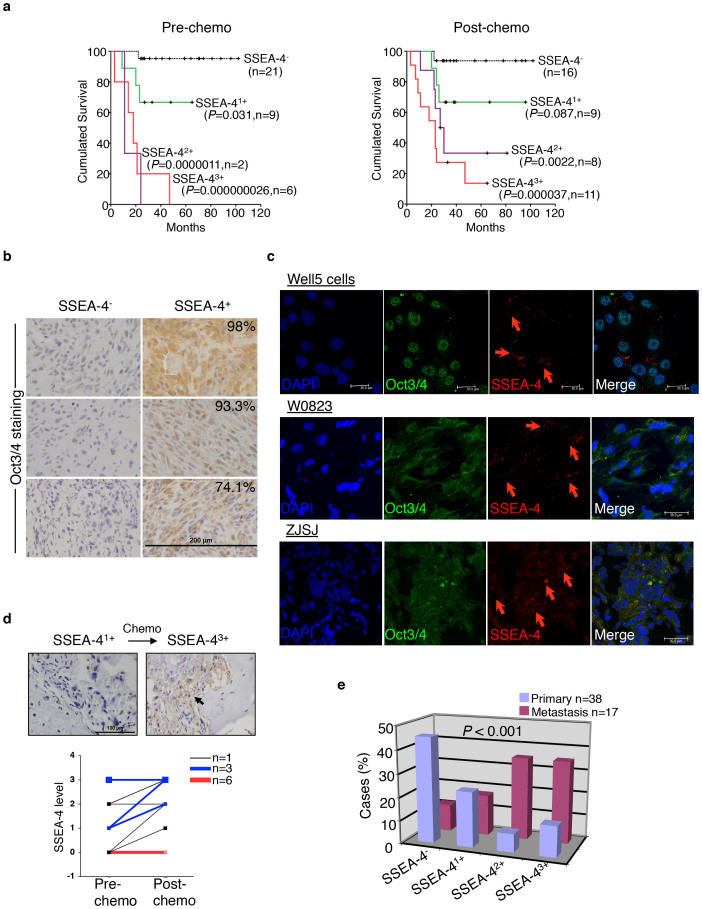
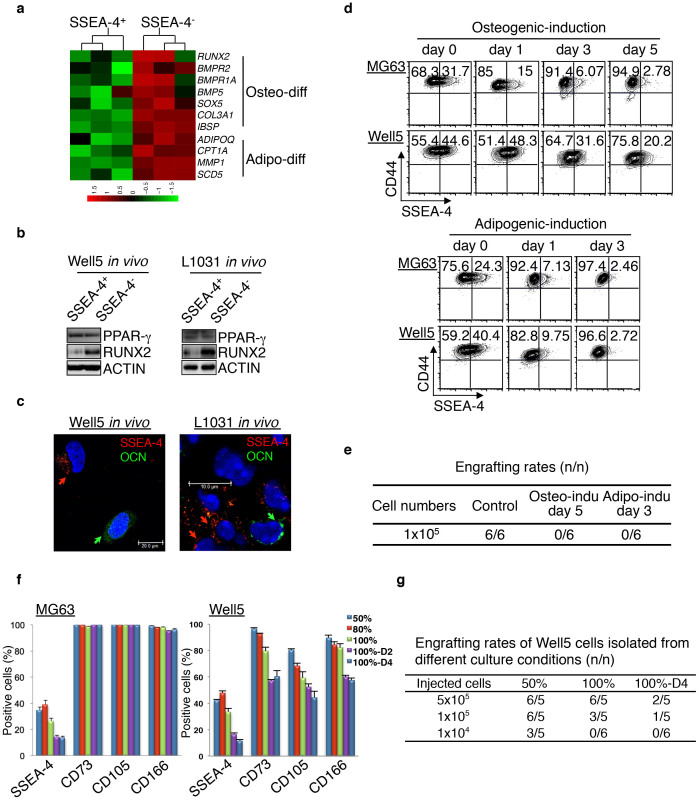
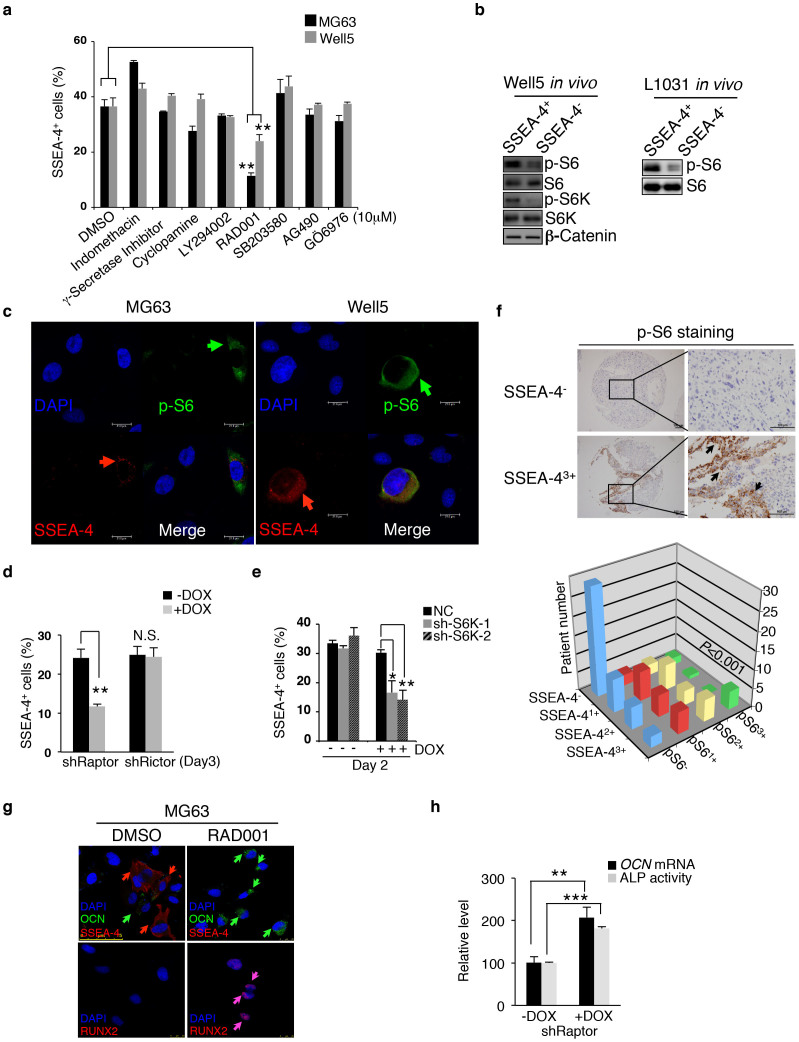
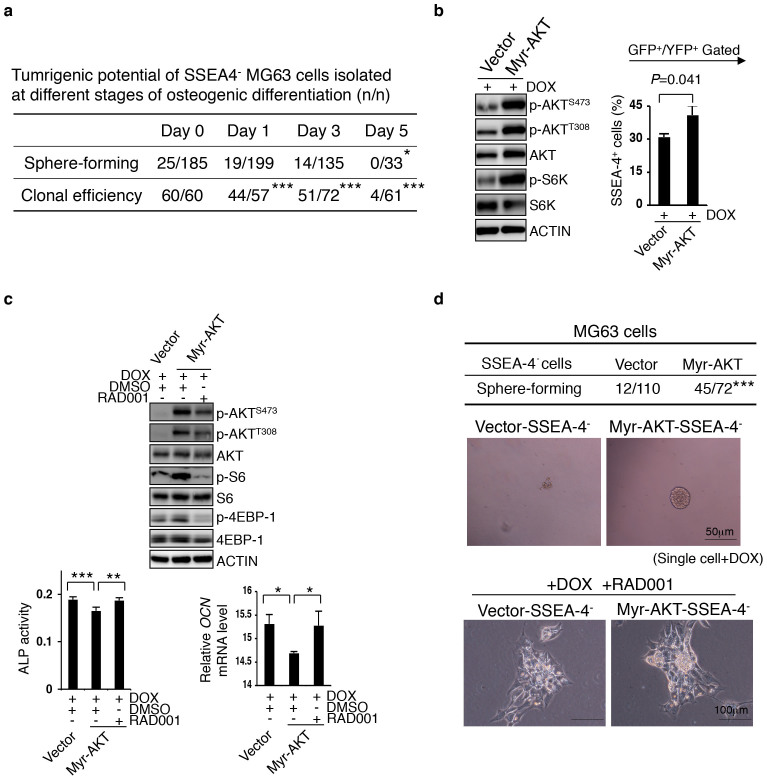
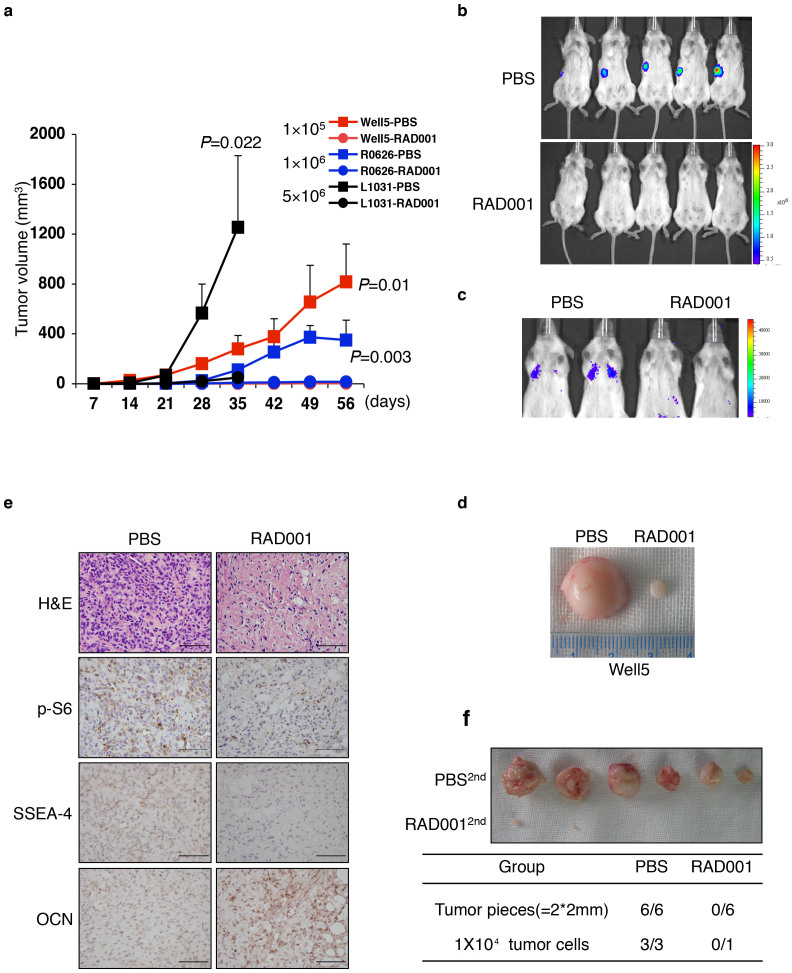
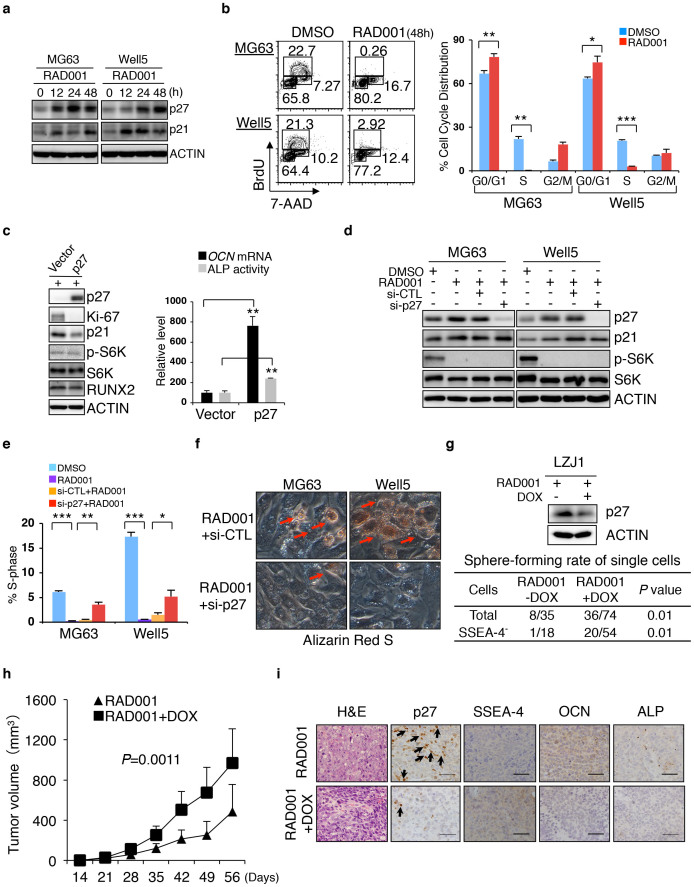
Inactivation of p53 and/or Rb pathways restrains osteoblasts from cell-cycle exit and terminal differentiation, which underpins osteosarcoma formation coupled with dedifferentiation. Recently, the level of p-S6K was shown to independently predict the prognosis for osteosarcomas, while the reason behind this is not understood. Here we show that in certain high-grade osteosarcomas, immature SSEA-4(+) tumor cells represent a subset of tumor-initiating cells (TICs) whose pool size is maintained by mTORC1 activity. mTORC1 supports not only SSEA-4(+) cell self-renewal through S6K but also the regeneration of SSEA-4(+) TICs by SSEA-4(-) osteosarcoma cell dedifferentiation. Mechanistically, active mTORC1 is required to prevent a likely upregulation of the cell-cycle inhibitor p27 independently of p53 or Rb activation, which otherwise effectively drives the terminal differentiation of SSEA-4(-) osteosarcoma cells at the expense of dedifferentiation. Thus, mTORC1 is shown to critically regulate the retention of tumorigenicity versus differentiation in discrete differentiation phases in SSEA-4(+) TICs and their progeny.


Figures

Figure 1
Figure 1. SSEA-4 Labels Xenografting-TICs Present in a Minority of Human Osteosarcoma Cases.
(a) The frequency of SSEA-4+ cells in P1 xenografts correlates with xenograft-formation potential in secondary recipients. (b) Live 7-AAD and murine CD45+/MHC-I+-excluded osteosarcoma xenograft cells were analyzed for expression of the indicated antigens by flow cytometry. (c) Primary osteosarcoma samples that generate both P1 and P2 xenografts show higher SSEA-4-staining intensity than those that produced only P1 xenografts. Primary specimens that produced no P1 xenografts stained negatively for SSEA-4. Immunohistochemical staining signals for SSEA-4 are indicated by arrows. Scale bar represents 100 μm. (d) Engrafting efficiencies of SSEA-4+ or SSEA-4 cells freshly isolated from three individual tumorigenic xenografts (P2 to P5). (e) Xenografting efficiency of SSEA-4+ or SSEA-4 osteosarcoma cells isolated from in vitro-cultivated Well5 cells (P < 0.05). (f) Sphere-forming rate of SSEA-4+ or SSEA-4 cells isolated from in vitro cultivated osteosarcoma MG63 cells (P < 0.05). Microscopic inspection of representative tumor-sphere or cellular debris is shown in the upper panel.
Figure 2
Figure 2. SSEA-4+ TICs are Responsible for the Clinical Progression of a Distinct Subtype of High-grade Osteosarcomas.
(a) Overall survival of patients with discrete SSEA-4 staining intensities in osteosarcoma cases, as measured before (left panel) or after (right panel) the first round of chemotherapy. P values: compared with the SSEA-4 subgroup; n: patient number. (b) Oct3/4 expression assayed on primary specimens of osteosarcoma that contained or did not contain SSEA-4+ TICs. Percentages of Oct3/4+ cells are shown in the upper-right corner. Six representative samples are shown. (c) Cryopreserved sections of SSEA-4+ xenografts were co-stained with fluorescent antibodies against Oct3/4 or SSEA-4. Three representative samples are shown. Red arrows indicate SSEA-4+ cells. (d) Upper panel, SSEA-4 staining before and after the first round of chemotherapy in one representative case. Bottom panel, SSEA-4-staining intensities of osteosarcoma samples from 19 patients measured before and after chemotherapy. Samples from the same patient are paired with lines. (e) Relative distribution rates of SSEA-4, SSEA-41+, SSEA-42+, and SSEA-43+ osteosarcoma samples among those obtained from primary or metastatic sites.
Figure 3
Figure 3. SSEA-4+ TICs Undergo Mesenchymal Differentiation to Generate SSEA-4 Cells.
(a) Heatmap showing expression levels of the signature gene sets that indicate the mesenchymal differentiation status of W0823-derived SSEA-4+ TICs or SSEA-4 osteosarcoma cells. (b) Western blotting assays for the levels of PPAR-γ and RUNX2 in sorted SSEA-4+ or SSEA-4 osteosarcoma cells growing in vivo. The cropped blots were run under the same experimental conditions. The full-length blots are included in Supplementary Figure 8. (c) Co-immunofluorescent staining and inspection of cytospun Well5-xenograft cells (left panel) or frozen sectioned (right panel) L1031-derived xenografts. The antibody against SSEA-4 was labeled with Alexa555 (Red) and the antibody against OCN was FITC-labeled (green). (d) SSEA-4+ cell frequency decreased in Well5 or MG63 cells undergoing osteogenic or adipogenic differentiation, as measured by flow cytometry. (e) Tumorigenic xenograft-forming rates of Well5 cells after prior treatment with DMSO or differentiation inducers for 3–5 days as in (d) (P = 0.002 for each induction versus control). (f) SSEA-4+ cell frequency measured for Well5 or MG63 cells under different culture conditions. The percentages indicate cell densities. One hundred %-D2 or 100%-D4 indicates an additional culture for 2 days or 4 days post-confluence. Results are shown as mean ± SD, n = 3. (g) TIC frequency measurement of Well5 cells obtained from different culture conditions as in (f). One hundred %-D4 versus 50%: P < 0.001. 100% versus 50%: P = 0.034.
Figure 4
Figure 4. mTORC1 Activity Maintains SSEA-4+ TIC Frequency.
(a) MG63 or Well5 cells were treated with negative control DMSO, Wnt-β catenin inhibitor indomethacin, Notch inhibitor γ-secretase inhibitor, Hedgehog inhibitor cyclopamine, PI3K-AKT inhibitor LY294002, mTOR inhibitor RAD001, p38 MAPK inhibitor SB203580, JAK-STAT inhibitor AG490, or PKC inhibitor GO6976 for 24 hours and the frequency of SSEA-4+ cells was measured by flow cytometry. Results are expressed as the mean ± SD (**P < 0.01). (b) Western blotting assays for phosphorylated levels of mTORC1 pathway components S6K or/and S6 as well as the β-catenin level in SSEA-4+ or SSEA-4 cells freshly sorted from osteosarcoma xenografts. The cropped blots were run under the same experimental conditions. The full-length blots can be found in Supplementary Figure 8. (c) Immunofluorescent co-staining of SSEA-4 and p-S6 in cytospun MG63 and Well5 cells. (d–e) The effects of Dox-inducible Raptor or Rictor knockdown (d) or S6K knockdown (e) on the frequency of SSEA-4+ cells in MG63 cell culture. Results are expressed as mean ± SD (*P < 0.05, **P < 0.01). NC: control shRNA; shRaptor: shRNA for Raptor; shRictor: shRNA for Rictor; sh-S6K-1 and sh-S6K-2: shRNAs for S6K. (f) p-S6 level is positively correlated with SSEA-4 staining intensity among 98 human osteosarcoma samples (P = 0.000155). Representative immunohistochemical staining of p-S6 in one SSEA-4 and SSEA-43+ sample is shown on the left panel. Scale bars represent 100 μm. (g) MG63 cells were treated with DMSO or RAD001 for 3 days, then stained with the fluorescent antibodies against SSEA-4, OCN and RUNX2, and viewed microscopically. (h) ALP activity and OCN mRNA levels were measured in MG63 cells with or without Raptor knockdown (**P < 0.01, ***P < 0.001).
Figure 5
Figure 5. mTORC1 Supports the De-differentiate Potential of Early SSEA-4 Progeny.
(a) SSEA-4 cells were sorted at different time points during MG63 cells' differentiation to osteocytes and individually inoculated into fresh medium for measuring their clonal efficiency or into special medium for measuring their tumorsphere-forming potential (*P < 0.05, ***P < 0.001). (b) Enforced activation of AKT-mTOR pathway increases SSEA-4+ cell frequency in MG63 cells undergoing mesenchymal differentiation. Transduced cells were plated at 60% confluence and the expression of Myr-AKT was induced by Dox; SSEA-4+ cell frequency was measured 48 hours later. Results are shown as means ± SDs. The cropped blots were run under the same experimental conditions. The full-length blots can be seen in Supplementary Figure 8. (c) mTOR inhibitor relieves the AKT activation-caused differentiation arrest of MG63 cells. Data for ALP activity and OCN mRNA levels are presented as means ± SDs (*P < 0.05, **P < 0.01, ***P < 0.001). The cropped blots were run under the same experimental conditions. The full-length blots can be seen in the Supplementary Figure 8. (d) Tumorsphere-forming rates of single SSEA-4 MG63 cells expressing vector or Myr-AKT (as in b or c) are shown on the upper panel (***P < 0.001). The enhancing effect of Myr-AKT induction on the tumorsphere-forming potential of SSEA-4 cells was abolished by RAD001 (bottom panel).
Figure 6
Figure 6. Terminal Differentiation Induction by mTOR-inactivation Decreases SSEA-4+ TICs in vivo.
(a) SSEA-4+ cells (1–50 × 105) from the different resources as indicated were subcutaneously inoculated into NOD/SCID mice. The oral administration of PBS (filled box) or 5 mg/kg RAD001 (filled circle) commenced 2 days later. Tumor volumes are shown as the means ± SDs, n = 3–5. (b–c) Representative images of whole-body (b) or lung metastasis (c) bioluminescence 4 weeks following subcutaneous (b) or tail vein injection (c) of 1 × 10⁵ PBS- or RAD001-treated SSEA-4+ Well5 cells (as in (a)) into NOD/SCID mice. (d) Two representative tissue samples retrieved from the PBS-treated and RAD001-treated groups, respectively. (e) Immunohistochemical staining of p-S6, SSEA-4, or OCN in xenografts retrieved from the PBS-or RAD001-treated group, as in (a and b). Scale bars represent 100 μm. HE: hematoxylin-eosin. (f) Secondary tumorigenic xenograft formation of tumor tissue or cells after post-PBS or -RAD001 treatment, as in (a and b) (upper panel). Secondary tumorigenic xenografting rates (n/n) are summarized in the bottom table (P < 0.01).
Figure 7
Figure 7. p27-initiated Cell-cycle Exit Contributes to mTOR Inactivation-induced Terminal Osteogenic Differentiation of SSEA-4+ TICs.
(a) Western blotting assays for p27 and p21 in MG63 and Well5 cells treated with DMSO or RAD001 for varying lengths of time. The cropped blots were run under the same experimental conditions. The full-length blots can be viewed in Supplementary Figure 8. (b) Cell cycle status of RAD001-treated MG63 and Well5 cells. Data are presented as means ± SDs (*P < 0.05, **P < 0.01, ***P < 0.001). (c) Inducible expression of exogenous p27 elevates ALP activity and OCN mRNA levels in MG63 cells. Left panel, Western blot assay of p27-overexpressing MG63 cells. Data are presented as the means ± SDs (**P < 0.01). (d) Western blot assay on RAD001-treated MG63 and Well5 cells with or without p27 knockdown. si-CTL: control siRNA; si-p27: p27 siRNA mixture. The cropped blots were run under the same experimental conditions. The full-length blots can be viewed in Supplementary Figure 8. (e–f) S-phase distribution (e) and terminal osteogenic maturation (f) of RAD001-treated MG63 and Well5 cells with or without p27 knockdown were evaluated by flow cytometry and Alizarin Red-S staining, respectively. (g) Dox-induced p27 knockdown enhanced the tumorsphere-forming ability of LZJ1-derived total or SSEA-4 osteosarcoma cells. (h) Monitoring of the in vivo growth of LZJ1-derived osteosarcoma cells which were treated with either RAD001 or RAD001 plus p27 knockdown. (i) Immunohistochemical staining of p27, SSEA-4, OCN or ALP in xenografts recovered from RAD001 or RAD001 plus p27 knockdown groups. Scale bars represent 100 μm. HE: hematoxylin-eosin.

Similar articles

Cited by

References

    1. Li F. P. et al. A cancer family syndrome in twenty-four kindreds. Cancer Res 48, 5358–5362 (1988). - PubMed
    1. Wong F. L. et al. Cancer incidence after retinoblastoma. Radiation dose and sarcoma risk. Jama 278, 1262–1267 (1997). - PubMed
    1. Chen X. et al. Recurrent somatic structural variations contribute to tumorigenesis in pediatric osteosarcoma. Cell reports 7, 104–112, 10.1016/j.celrep.2014.03.003 (2014). - DOI - PMC - PubMed
    1. Guijarro M. V., Ghivizzani S. C. & Gibbs C. P. Animal models in osteosarcoma. Frontiers in oncology 4, 189, 10.3389/fonc.2014.00189 (2014). - DOI - PMC - PubMed
    1. Walkley C. R. et al. Conditional mouse osteosarcoma, dependent on p53 loss and potentiated by loss of Rb, mimics the human disease. Genes Dev 22, 1662–1676, 10.1101/gad.1656808 (2008). - DOI - PMC - PubMed

Publication types

MeSH terms

Substances