. 2015 Apr 1:3:16.
doi: 10.1186/s40478-015-0200-8.

PGC-1α activity in nigral dopamine neurons determines vulnerability to α-synuclein

PGC-1α activity in nigral dopamine neurons determines vulnerability to α-synuclein

Carine Ciron et al. Acta Neuropathol Commun. .

Abstract

Introduction: Mitochondrial dysfunction and oxidative stress are critical factors in the pathogenesis of age-dependent neurodegenerative diseases. PGC-1α, a master regulator of mitochondrial biogenesis and cellular antioxidant defense, has emerged as a possible therapeutic target for Parkinson's disease, with important roles in the function and survival of dopaminergic neurons in the substantia nigra. The objective of this study is to determine if the loss of PGC-1α activity contributes to α-synuclein-induced degeneration.

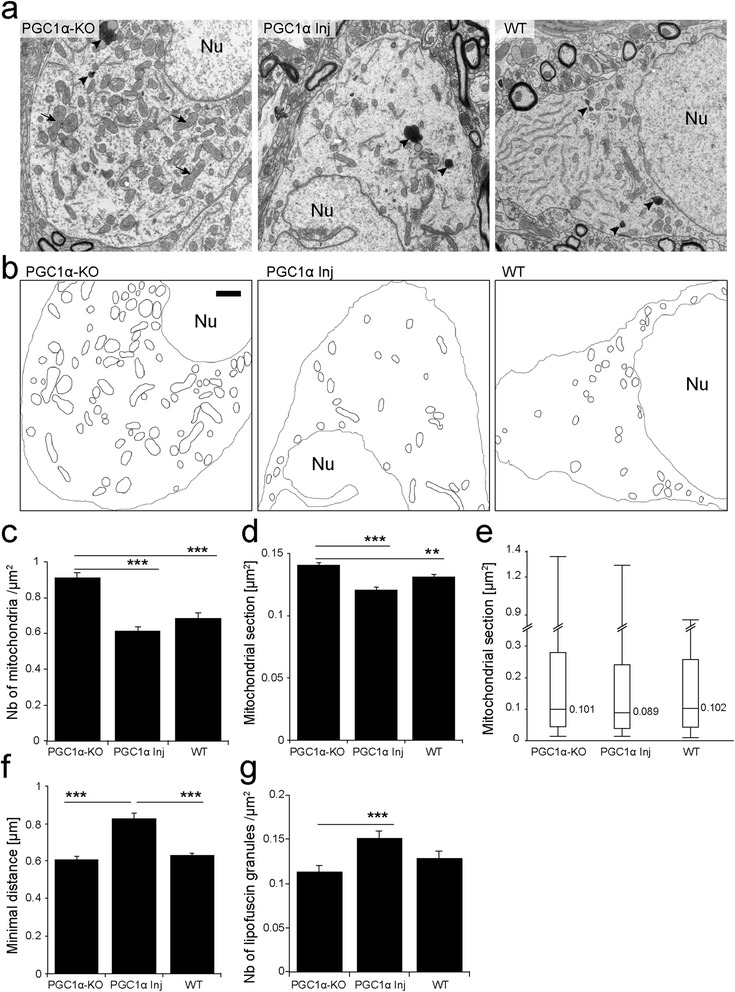
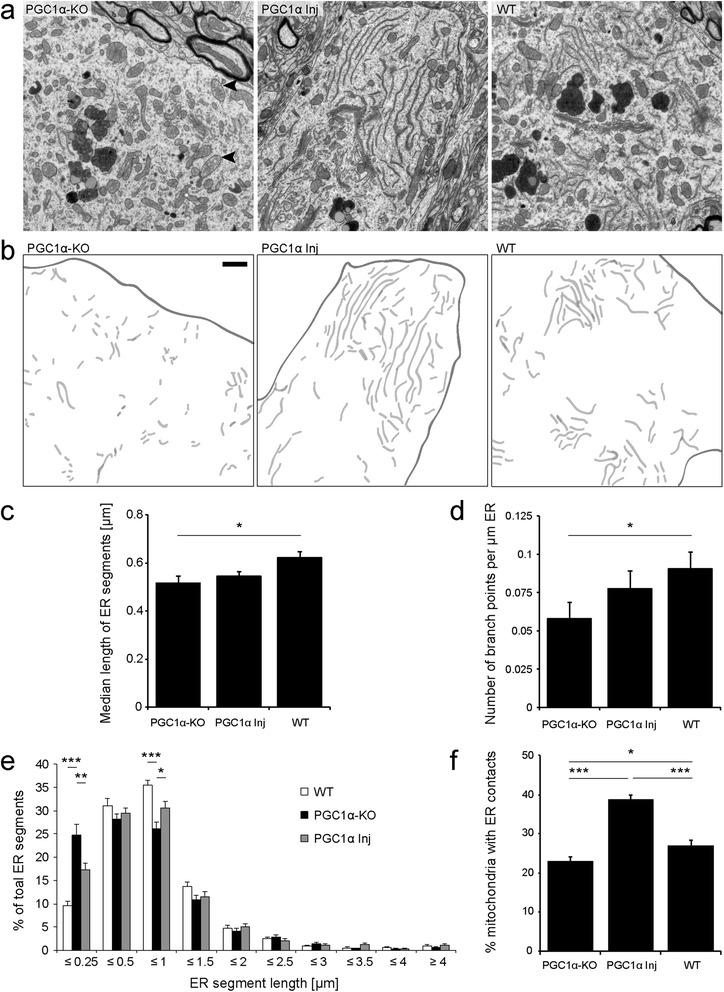
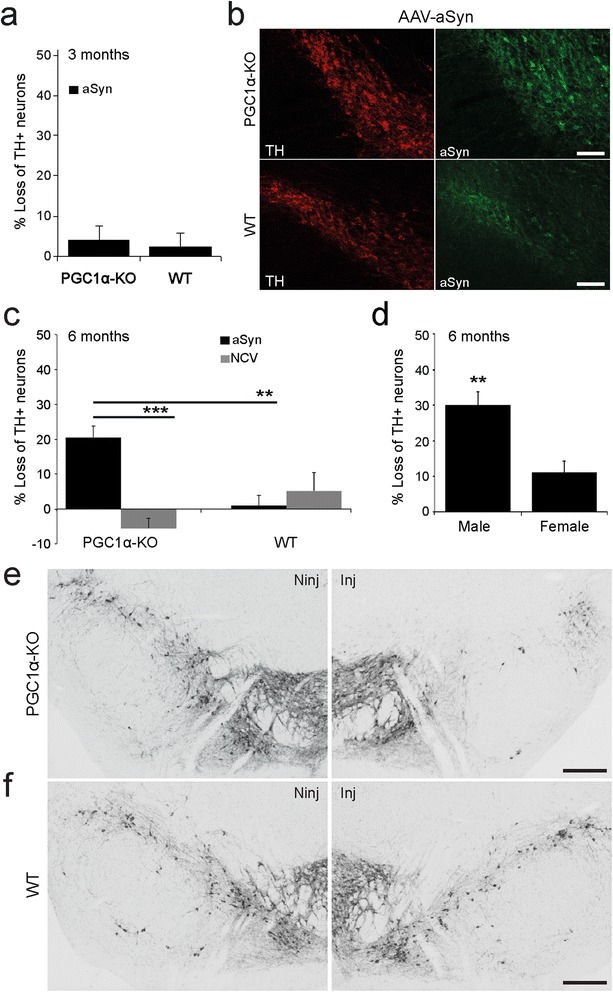
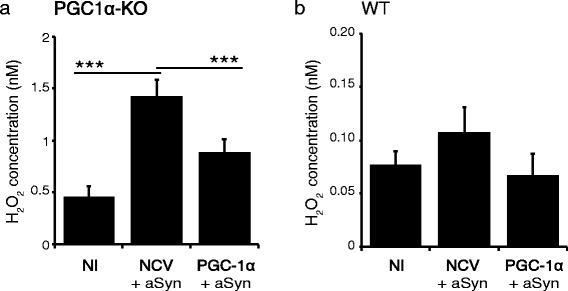
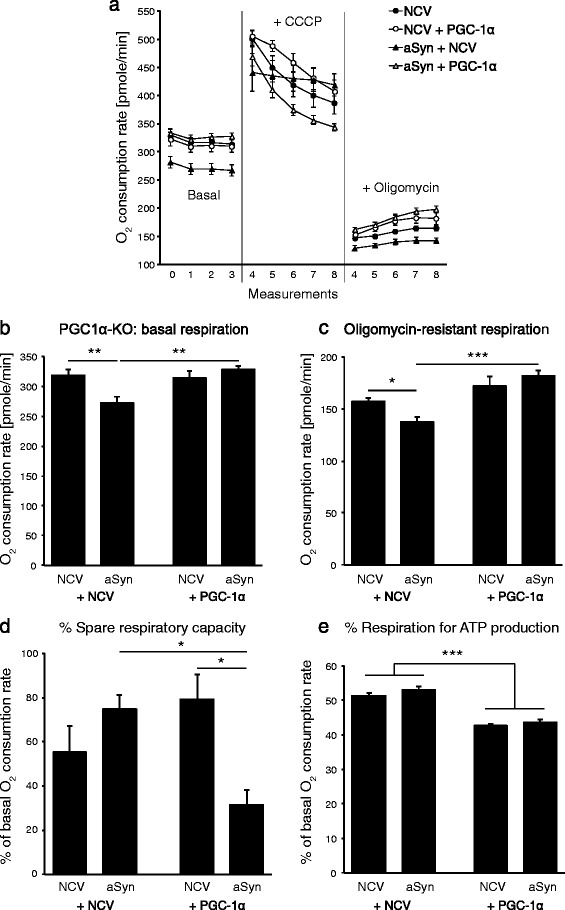
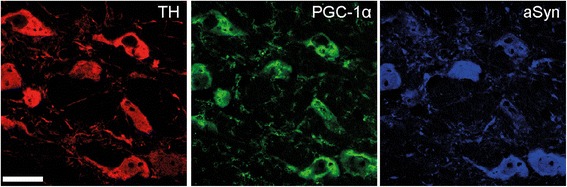
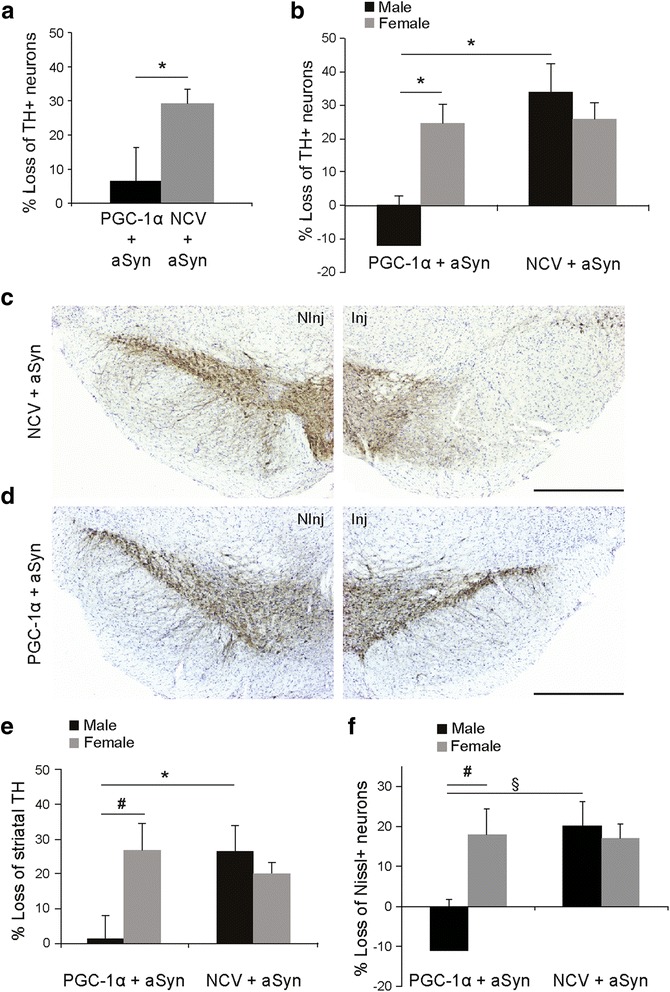
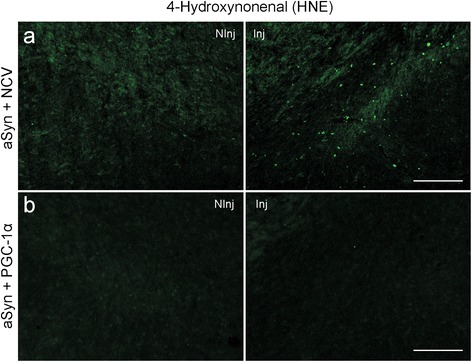
Results: We explore the vulnerability of PGC-1α null mice to the accumulation of human α-synuclein in nigral neurons, and assess the neuroprotective effect of AAV-mediated PGC-1α expression in this experimental model. Using neuronal cultures derived from these mice, mitochondrial respiration and production of reactive oxygen species are assessed in conditions of human α-synuclein overexpression. We find ultrastructural evidence for abnormal mitochondria and fragmented endoplasmic reticulum in the nigral dopaminergic neurons of PGC-1α null mice. Furthermore, PGC-1α null nigral neurons are more prone to degenerate following overexpression of human α-synuclein, an effect more apparent in male mice. PGC-1α overexpression restores mitochondrial morphology, oxidative stress detoxification and basal respiration, which is consistent with the observed neuroprotection against α-synuclein toxicity in male PGC-1α null mice.

Conclusions: Altogether, our results highlight an important role for PGC-1α in controlling the mitochondrial function of nigral neurons accumulating α-synuclein, which may be critical for gender-dependent vulnerability to Parkinson's disease.


Figures

Figure 1
Figure 1
Expression of PGC-1α and PGC-1β in PGC1α-KO mice. (a) Level of PGC-1α mRNA in the SN of WT mice, PGC-1α KO mice (PGC1α-KO) and from PGC1α-KO mice injected with a vector encoding PGC-1α (PGC1α Inj) at 1 month post-injection. Values are expressed in arbitrary units (AU). WT n = 2; PGC1α-KO n = 5; PGC1α Inj n = 3. (b) Level of PGC-1β mRNA in the SN. Values are expressed in arbitrary units (AU). WT n = 3; PGC1α-KO n = 3; PGC1α Inj n = 3. Statistical analysis: one-way ANOVA with Newman-Keuls post-hoc test; *p < 0.05.
Figure 2
Figure 2
PGC-1α reduces the number of mitochondria and rescues the abnormal mitochondrial phenotype observed in the SNpc of PGC1α-KO mice. (a) Electron micrographs of neuronal soma in the SNpc of 10 month-old PGC1α-KO mice, PGC1α-KO mice injected with a vector encoding PGC-1α (PGC1α Inj) and WT mice. Note the presence of lipofuscin granules (black arrowheads) and giant mitochondria with disorganized cristae (black arrows). Nu indicates the neuronal nucleus (Nu). (b) Mitochondria are outlined with black lines. Neuronal nuclei and membranes are outlined with a grey line to indicate the limits of the neuronal cytosol. Note the increase in the density of mitochondrial clusters in PGC1α-KO mice. Scale bar: 1 μm. (c) Quantification of mitochondrial density reveals a significant increase in PGC1α-KO mice compared to the other groups. (d) Average area of mitochondria. Note the increased size in PGC1α-KO mice, compared to PGC1α Inj and WT mice. (e) Box and whisker plots showing the distribution of mitochondrial size in the SNpc of PGC1α-KO, PGC1α Inj and WT mice. The thick line represents the median and the box indicates the 10th and the 90th percentiles. Whiskers show the extreme values for each group. Note the presence of abnormal, enlarged mitochondria in PGC1α-KO mice. (f) Nearest neighbor analysis of mitochondrial distribution in the neuronal cytosol, demonstrating reduced clustering in PGC1α Inj mice. (g) Density of lipofuscin granules, which is significantly increased in the PGC1α Inj group. Statistical analysis: one-way ANOVA with Newman-Keuls post-hoc test; (C,F,G): WT: n = 79 neurons; PGC1α-KO: n = 89 neurons; PGC1α Inj: n = 113 neurons. (D,E): WT: n = 2729 mitochondria; PGC1α-KO: n = 3527; PGC1α Inj: n = 2544; **p < 0.01, ***p < 0.001. Micrographs were obtained from 3 animals in each group.
Figure 3
Figure 3
Expression of PGC-1α rescues ER morphology in PGC1α-KO mice, and increases the number of mitochondrial contacts with ER. (a) Electron micrographs of neuronal soma in the SNpc of PGC1α-KO, PGC1α Inj and WT mice. Black arrowheads indicate the presence of giant mitochondria with disorganized cristae. (b) ER cisternae are colored in light gray. The cell membrane at the border of the neuronal cytosol is outlined. Note that PGC1α-KO mice display a disorganized and fragmented ER. In WT and PGC1α Inj mice, normal ER stacks are observed. Scale bar: 1 μm. (c,d) Quantification of the median length of ER profiles and number of branch points per μm of ER. (e) Relative length distribution of the ER segments in individual neurons from WT, PGC1α-KO and PGC1α Inj mice. Note the overall fragmentation of the ER in neurons from PGC1α-KO mice. Statistical analysis for c-d: one-way ANOVA with Newman-Keuls post-hoc test; WT: n = 51 neurons; PGC1α-KO: n = 51 neurons; PGC1α Inj: n = 60 neurons (f) Percentage of mitochondria having membrane contacts with ER. Note that PGC-1α significant increases the proportion of mitochondria with ER contacts. Statistical analysis: one-way ANOVA with Newman-Keuls post-hoc test; WT: n = 79 neurons; PGC1α-KO: n = 89 neurons; PGC1α Inj: n = 113 neurons; *p < 0.05, **p < 0.001 and ***p < 0.001. Micrographs were obtained from 3 animals in each group.
Figure 4
Figure 4
Expression of human aSyn induces the loss of neurons positive for dopaminergic markers in the SNpc of PGC1α-KO mice. PGC1α-KO mice or WT mice were injected in the SNpc with an AAV2/6 vector encoding aSyn or a non-coding vector (NCV). (a) At 3 months post-injection, there is no significant loss of TH-positive neurons in the SNpc (WT: n = 5 and PGC1α-KO: n = 10). (b) Overexpression of human aSyn is detectable by immunohistochemistry in nigral TH-positive neurons. Scale bar: 100 μm. (c) At 6 months post-injection, a significant loss of TH-positive neurons is observed in the SNpc of PGC1α-KO mice injected with AAV-aSyn. Statistical analysis: two-way ANOVA with Newman-Keuls post-hoc test; PGC1α-KO + aSyn: n = 18; PGC1α-KO + NCV: n = 5; WT + aSyn: n = 14; WT + NCV: n = 8; **p < 0.01, ***p < 0.001. (d) Analysis according to gender reveals that male PGC1α-KO mice are significantly more prone to aSyn-induced loss of TH neurons than female mice. Student’s t test: n = 9 for each gender; **p < 0.01. (e,f) Representative photomicrographs showing the loss of TH neurons in the AAV-aSyn injected hemisphere of PGC1α-KO mice (e), as compared to no loss in WT mice (f). The non-injected side (NInj) is shown for comparison. Scale bar: 100 μm.
Figure 5
Figure 5
PGC-1α protects primary neuronal cultures of PGC1α-KO mice against oxidative stress induced by aSyn. Seven day-old primary neuronal cultures were derived from the cerebral cortex of PGC1α-KO (a) or WT mice (b). Individual cultures were co-infected either with the non-coding and aSyn vectors (NCV + aSyn), or with the PGC-1α and aSyn vectors (PGC1α + aSyn). H2O2 concentrations were measured in cell culture media at 7 days post-infection. Note the significant increase in H2O2 production in PGC1α-KO neurons expressing aSyn, which is prevented by PGC-1α expression. In contrast, aSyn does not cause any significant increase in H2O2 production in neurons derived from WT mice. Statistical analysis: one-way ANOVA with Newman-Keuls post-hoc test; NI: n = 14; NCV + aSyn: n = 12; PGC1α + aSyn: n = 14; ***p < 0.001. Note that raw values of H2O2 production were obtained from separate experiments for neurons derived from PGC1α-KO and WT mice and are therefore not comparable.
Figure 6
Figure 6
Alpha-synuclein impairs basal mitochondrial respiration in PGC1α-KO neurons. Primary neuronal cultures were derived from the cerebral cortex of PGC1α-KO mice and co-transduced with either a non-coding AAV vector (NCV), an AAV vector encoding human aSyn, or with an AAV vector encoding PGC-1α (PGC1α). (a,b) Basal oxygen consumption was measured from individual cultures in the conditions NCV alone (n = 15), NCV + aSyn (n = 20), NCV + PGC1α (n = 19) and aSyn + PGC1α (n = 15). (a,d) Some of the individual cultures were treated with CCCP, in order to determine the percentage of spare respiratory capacity (d): NCV alone (n = 6), NCV + aSyn (n = 10), NCV + PGC1α (n = 4) and aSyn + PGC1α (n = 5). Other individual cultures were treated with oligomycin to determine (c) the oligomycin-resistant residual respiration and (e) the percentage of oxygen consumption used for ATP production: NCV alone (n = 9), NCV + aSyn (n = 10), NCV + PGC1α (n = 10) and aSyn + PGC1α (n = 10). Statistical analysis: two-way ANOVA with Newman-Keuls post-hoc test. (b-d): significant interaction between the aSyn and PGC1α effects, *p < 0.05; **p < 0.01; ***p < 0.001; (e): significant group effect of PGC1α, ***p < 0.001.
Figure 7
Figure 7
Co-injection of AAV-aSyn and AAV-PGC-1α vectors induces expression of PGC-1α and aSyn in nigral neurons. Immunostaining shows the co-expression of PGC-1α and aSyn in TH-positive neurons in the SNpc of PGC1α-KO mice, at 6 months post-AAV injection. Scale bar: 20 μm.
Figure 8
Figure 8
PGC-1α expression protects against aSyn toxicity in the SNpc of male PGC1α-KO mice. PGC1α-KO mice were co-injected with two AAV2/6 vectors encoding for aSyn and PGC-1α (PGC1α + aSyn). The control group is injected with a non-coding vector instead of AAV-PGC-1α (NCV + aSyn). (a) Loss of TH-positive neurons in the SNpc at 6 months post-injection. PGC-1α overexpression induces significant protection against aSyn toxicity. Statistical analysis: Student’s t test; PGC1α + aSyn: n = 10; NCV + aSyn: n = 10; *p < 0.05. (b) Analysis according to gender shows that the protective effect of AAV-PGC-1α is specific to male mice. Statistical analysis: two-way ANOVA with Newman-Keuls post-hoc test; PGC1α + aSyn: n = 4 males and 6 females; NCV + aSyn: n = 5 males and 5 females; *p < 0.05. (c,d) Representative photomicrographs showing the loss of TH-positive neurons in the SNpc of NCV + aSyn mice (c), as compared to PGC1α + aSyn mice (d). The non-injected side (NInj) is shown for comparison. Scale bar: 500 μm. (e) Gender-specific analysis reveals significant protection of striatal TH fibers only in male mice PGC1α-KO mice injected with the AAV-PGC-1α vector. Statistical analysis as in (b); *p < 0.05 and #p = 0.058. (f) Stereological gender-specific analysis of the loss of Nissl-positive neurons in the SNpc. Statistical analysis as in (b): # p = 0.070, § p = 0.059.
Figure 9
Figure 9
PGC-1α prevents oxidative stress induced by aSyn in vivo. (a) Immunostaining for HNE, a marker for oxidative damage, at 6 months after co-injection of PGC1α-KO mice with an AAV2/6 vector encoding aSyn and a control non-coding vector (NCV). Note the presence of the HNE staining in the SNpc of PGC1α-KO mice expressing aSyn. (b) Co-injection with AAV2/6 vectors encoding aSyn and PGC-1α. Note that PGC-1α overexpression suppresses signs of oxidative stress in PGC1α-KO mice expressing aSyn. The non-injected side (NInj) is shown for comparison. Scale bar: 100 μm.

Similar articles

Cited by

References

    1. Ballard PA, Tetrud JW, Langston JW. Permanent human parkinsonism due to 1-methyl-4-phenyl-1,2,3,6-tetrahydropyridine (MPTP): seven cases. Neurology. 1985;35(7):949–956. doi: 10.1212/WNL.35.7.949. - DOI - PubMed
    1. Langston JW, Ballard P, Tetrud JW, Irwin I. Chronic Parkinsonism in humans due to a product of meperidine-analog synthesis. Science. 1983;219(4587):979–980. doi: 10.1126/science.6823561. - DOI - PubMed
    1. Betarbet R, Sherer TB, MacKenzie G, Garcia-Osuna M, Panov AV, Greenamyre JT. Chronic systemic pesticide exposure reproduces features of Parkinson’s disease. Nat Neurosci. 2000;3(12):1301–1306. doi: 10.1038/81834. - DOI - PubMed
    1. Winklhofer KF, Haass C. Mitochondrial dysfunction in Parkinson’s disease. Biochim Biophys Acta. 2010;1802(1):29–44. doi: 10.1016/j.bbadis.2009.08.013. - DOI - PubMed
    1. Bender A, Krishnan KJ, Morris CM, Taylor GA, Reeve AK, Perry RH, Jaros E, Hersheson JS, Betts J, Klopstock T, Taylor RW, Turnbull DM. High levels of mitochondrial DNA deletions in substantia nigra neurons in aging and Parkinson disease. Nat Genet. 2006;38(5):515–517. doi: 10.1038/ng1769. - DOI - PubMed

Publication types

MeSH terms

Substances

LinkOut - more resources