

Deep transcriptome sequencing provides new insights into the structural and functional organization of the wheat genome
- PMID: 25853487
- PMCID: PMC4355351
- DOI: 10.1186/s13059-015-0601-9
Deep transcriptome sequencing provides new insights into the structural and functional organization of the wheat genome
Abstract
Background: Because of its size, allohexaploid nature, and high repeat content, the bread wheat genome is a good model to study the impact of the genome structure on gene organization, function, and regulation. However, because of the lack of a reference genome sequence, such studies have long been hampered and our knowledge of the wheat gene space is still limited. The access to the reference sequence of the wheat chromosome 3B provided us with an opportunity to study the wheat transcriptome and its relationships to genome and gene structure at a level that has never been reached before.
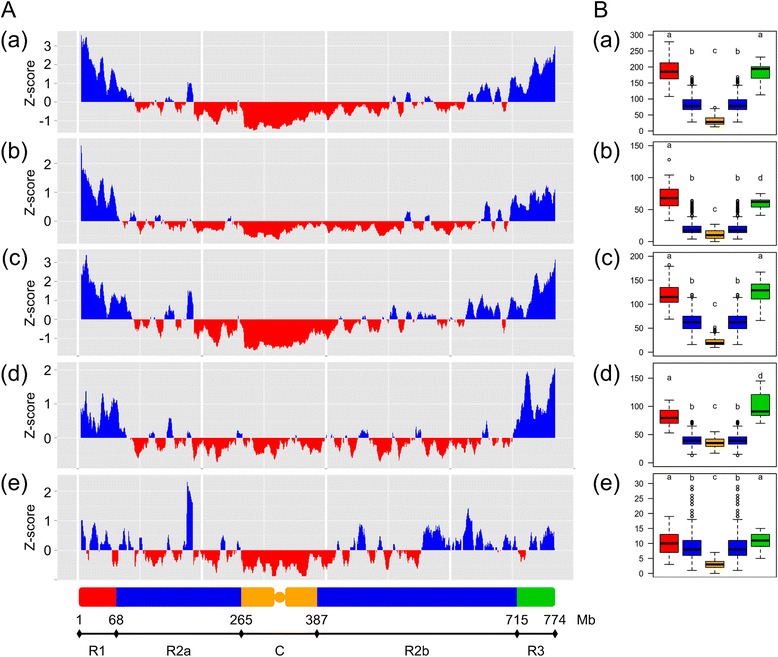
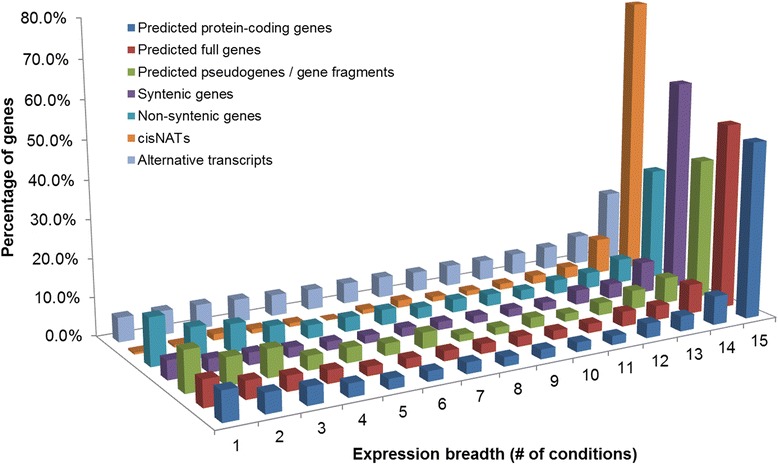
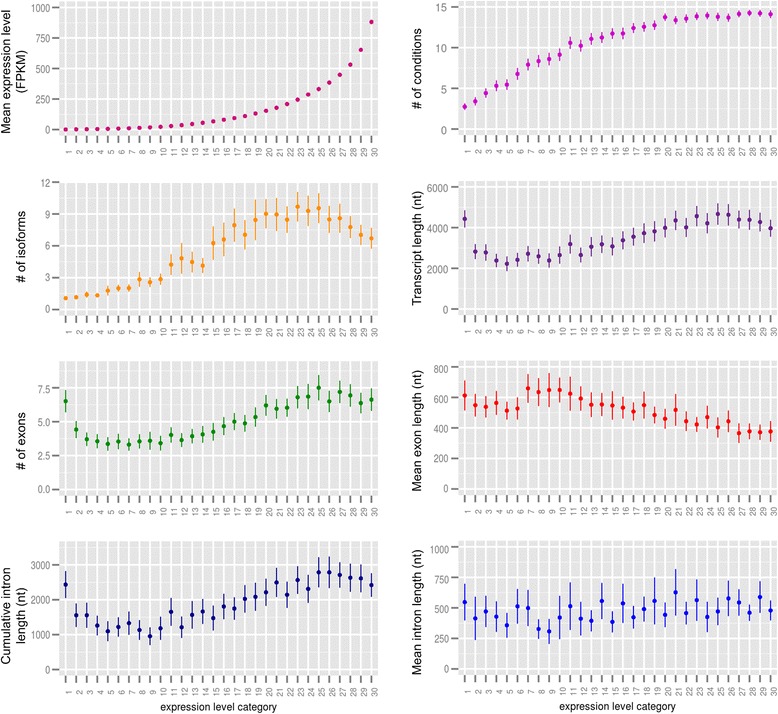
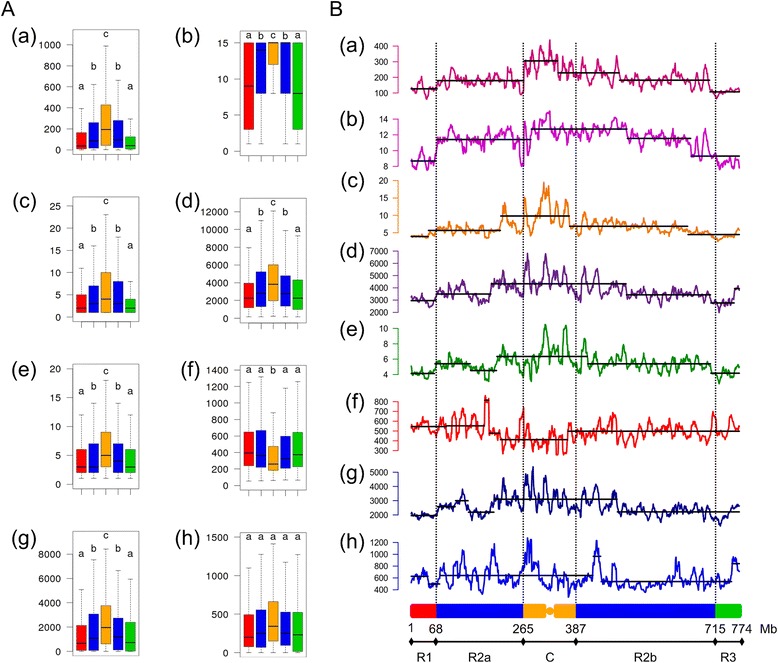
Results: By combining this sequence with RNA-seq data, we construct a fine transcriptome map of the chromosome 3B. More than 8,800 transcription sites are identified, that are distributed throughout the entire chromosome. Expression level, expression breadth, alternative splicing as well as several structural features of genes, including transcript length, number of exons, and cumulative intron length are investigated. Our analysis reveals a non-monotonic relationship between gene expression and structure and leads to the hypothesis that gene structure is determined by its function, whereas gene expression is subject to energetic cost. Moreover, we observe a recombination-based partitioning at the gene structure and function level.
Conclusions: Our analysis provides new insights into the relationships between gene and genome structure and function. It reveals mechanisms conserved with other plant species as well as superimposed evolutionary forces that shaped the wheat gene space, likely participating in wheat adaptation.
Figures
Similar articles
-
A 3,000-loci transcription map of chromosome 3B unravels the structural and functional features of gene islands in hexaploid wheat.Plant Physiol. 2011 Dec;157(4):1596-608. doi: 10.1104/pp.111.183921. Epub 2011 Oct 27. Plant Physiol. 2011. PMID: 22034626 Free PMC article.
-
Chromosome-based survey sequencing reveals the genome organization of wild wheat progenitor Triticum dicoccoides.Plant Biotechnol J. 2018 Dec;16(12):2077-2087. doi: 10.1111/pbi.12940. Epub 2018 Jun 13. Plant Biotechnol J. 2018. PMID: 29729062 Free PMC article.
-
Single-molecule real-time transcript sequencing facilitates common wheat genome annotation and grain transcriptome research.BMC Genomics. 2015 Dec 9;16:1039. doi: 10.1186/s12864-015-2257-y. BMC Genomics. 2015. PMID: 26645802 Free PMC article.
-
Making the Bread: Insights from Newly Synthesized Allohexaploid Wheat.Mol Plant. 2015 Jun;8(6):847-59. doi: 10.1016/j.molp.2015.02.016. Epub 2015 Mar 5. Mol Plant. 2015. PMID: 25747845 Review.
-
RNA Regulations and Functions Decoded by Transcriptome-wide RNA Structure Probing.Genomics Proteomics Bioinformatics. 2017 Oct;15(5):267-278. doi: 10.1016/j.gpb.2017.05.002. Epub 2017 Oct 12. Genomics Proteomics Bioinformatics. 2017. PMID: 29031843 Free PMC article. Review.
Cited by
-
New evidence for grain specific C4 photosynthesis in wheat.Sci Rep. 2016 Aug 17;6:31721. doi: 10.1038/srep31721. Sci Rep. 2016. PMID: 27530078 Free PMC article.
-
Genome-Wide Comparative Analysis of Flowering-Related Genes in Arabidopsis, Wheat, and Barley.Int J Plant Genomics. 2015;2015:874361. doi: 10.1155/2015/874361. Epub 2015 Sep 7. Int J Plant Genomics. 2015. PMID: 26435710 Free PMC article.
-
High-resolution mapping of the pericentromeric region on wheat chromosome arm 5AS harbouring the Fusarium head blight resistance QTL Qfhs.ifa-5A.Plant Biotechnol J. 2018 May;16(5):1046-1056. doi: 10.1111/pbi.12850. Epub 2017 Nov 10. Plant Biotechnol J. 2018. PMID: 29024288 Free PMC article.
-
Exploration of glutathione reductase for abiotic stress response in bread wheat (Triticum aestivum L.).Plant Cell Rep. 2022 Mar;41(3):639-654. doi: 10.1007/s00299-021-02717-1. Epub 2021 May 25. Plant Cell Rep. 2022. PMID: 34032897
-
Virus-Induced Gene Silencing Identifies an Important Role of the TaRSR1 Transcription Factor in Starch Synthesis in Bread Wheat.Int J Mol Sci. 2016 Sep 23;17(10):1557. doi: 10.3390/ijms17101557. Int J Mol Sci. 2016. PMID: 27669224 Free PMC article.
References
-
- CoGePedia. [http://genomevolution.org/wiki/index.php/Main_Page]
Publication types
MeSH terms
LinkOut - more resources
Full Text Sources
Other Literature Sources
Molecular Biology Databases
