Meta-Analysis
. 2015 Mar 31;16(1):64.
doi: 10.1186/s13059-015-0620-6.

Characterization of the immunophenotypes and antigenomes of colorectal cancers reveals distinct tumor escape mechanisms and novel targets for immunotherapy

Meta-Analysis

Characterization of the immunophenotypes and antigenomes of colorectal cancers reveals distinct tumor escape mechanisms and novel targets for immunotherapy

Mihaela Angelova et al. Genome Biol. .

Abstract

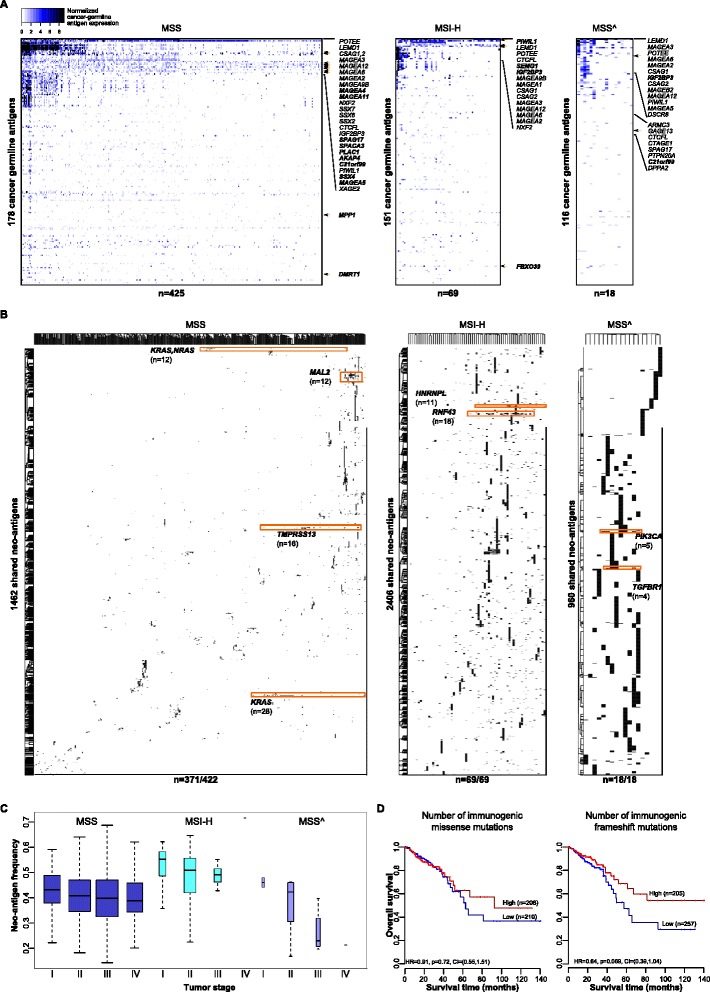
Background: While large-scale cancer genomic projects are comprehensively characterizing the mutational spectrum of various cancers, so far little attention has been devoted to either define the antigenicity of these mutations or to characterize the immune responses they elicit. Here we present a strategy to characterize the immunophenotypes and the antigen-ome of human colorectal cancer.

Results: We apply our strategy to a large colorectal cancer cohort (n = 598) and show that subpopulations of tumor-infiltrating lymphocytes are associated with distinct molecular phenotypes. The characterization of the antigenome shows that a large number of cancer-germline antigens are expressed in all patients. In contrast, neo-antigens are rarely shared between patients, indicating that cancer vaccination requires individualized strategy. Analysis of the genetic basis of the tumors reveals distinct tumor escape mechanisms for the patient subgroups. Hypermutated tumors are depleted of immunosuppressive cells and show upregulation of immunoinhibitory molecules. Non-hypermutated tumors are enriched with immunosuppressive cells, and the expression of immunoinhibitors and MHC molecules is downregulated. Reconstruction of the interaction network of tumor-infiltrating lymphocytes and immunomodulatory molecules followed by a validation with 11 independent cohorts (n = 1,945) identifies BCMA as a novel druggable target. Finally, linear regression modeling identifies major determinants of tumor immunogenicity, which include well-characterized modulators as well as a novel candidate, CCR8, which is then tested in an orthologous immunodeficient mouse model.

Conclusions: The immunophenotypes of the tumors and the cancer antigenome remain widely unexplored, and our findings represent a step toward the development of personalized cancer immunotherapies.


Figures

Figure 1
Figure 1
Molecular phenotypes and immunophenotypes of CRC tumors. (A) Subpopulations of TILs enriched in the tumors and spin chart for the TCGA cohort . The numbers for the subpopulations represent percentages of tumors with enriched immune cell subpopulations. T-cell compartment includes all T-cell subpopulations. Tem, effector memory T cell; Tcm, central memory T cell; Act, activated; aDC, activated dendritic cell; pDC, plasmacytoid dendritic cell; iDC, immature dendritic cell; Mac, macrophages; Eos, eosinophils; Neu, neutrophils; NK, natural killer cells. The spin chart gives an overview of the cohort (n = 460) with each line representing one patient. The molecular phenotypes are shown in the inner circle. The subpopulations of TILs significantly (q-value ≤0.1) enriched in individual patients based on single sample gene set enrichment analysis (ssGSEA) are shown in the outer circles. Within each molecular phenotype, the patients are sorted according to the enriched immune cell types: the immune cell types are ordered by their odds ratio for the corresponding molecular phenotype in a descending order. CIMP-H, CIMP-high; CIMP-L, CIMP-low; CIMP-Neg, CIMP-negative. (B) Heat map of log-transformed odds ratios of the TIL subpopulations for three different molecular phenotypes and different combinations thereof (for example, hypermutated, MSI-H, and CIMP-L). (C) Kaplan-Meier (KM) curves for overall survival for patients using the relative number of immune cells (Tem CD8, Tem CD4, Treg, NK, aDC and MDSC). Shown are groups with high relative numbers of cells (hi, red) versus the low relative number of cells (lo, blue) at the optimum value cutoff. CI, confidence interval; HR, hazards ratio.
Figure 2
Figure 2
CRC antigenome comprising two antigen classes: cancer-germline antigens and neo-antigens. (A) Two-dimensional hierarchical clustering of the expression of cancer-germline antigens calculated from the RNA sequencing data for the three molecular phenotypes (MSS, MSI-H and MSS^). All displayed matrix elements met the threshold as described in Methods. Genes marked in bold were significantly higher expressed in a specific patient group. (B) Two-dimensional hierarchical clustering of neo-antigens, that is, identical peptides shared in more than two patients in the three groups. Highlighted are most frequent neo-antigens in the specific group and the corresponding mutated gene. (C) Neo-antigen frequencies from stage I to stage IV in MSS, MSI-H and MSS^ patients. (D) Survival analysis for the number of immunogenic missense and frameshift mutations in all CRC patients.
Figure 3
Figure 3
Tumor heterogeneity and intratumoral immune landscapes in hypermutated and non-hypermutated tumors. (A) Violin plots (that is, box plots with a rotated probability density plot) of intratumoral heterogeneity represented by the calculated cancer cell fractions in MSI-H and MSS patients. MSS tumors (colored plots) were grouped in four clusters based on their cancer cell fraction distributions. The Kolmogorov-Smirnov D statistic was used as a similarity measure to cluster the tumors into the four groups (Figure S7 in Additional file 1). (B) Number of mutations and neo-antigen frequencies in the hypermutated tumors (MSI-H and MSS^) and in the four clusters of non-hypermutated tumors (MSS) colored as in panel (A). * P > 0.01, ** P < 0.01. Error bars represent standard error of the mean. (C) Survival analysis of the homogeneous (cluster1 and cluster2) and heterogeneous (cluster3 and cluster4) MSS tumors in late stages. (D) Volcano plots for enriched (red) and depleted (blue) TIL subpopulations in the distinct patient groups compared with normal samples (n = 50). (E) Log2 fold change of the expression (RNA sequencing data) of selected genes relative to normal tissue for the MSI-H and MSS patients colored as in (A).
Figure 4
Figure 4
Determinants of tumor immunogenicity in human CRC. (A) Network of TILs and immunomodulatory molecules. Shown are only candidate genes (hexagons) which were significantly associated with survival in the TCGA cohort. The thickness of the edges is proportional to the strength of the pairwise gene correlation. The size of the circles (TILs) is inversely proportional to the log-rank P-value, with large circles representing lower P-values. Significant association with OS is indicated by a blue node border. Bad prognosis is represented by red node color, good prognosis by green node color. (B) Survival analysis for BCMA using RNA sequencing data (TCGA cohort) as well as microarray data from 11 independent cohorts. OS, overall survival; DFS, disease-free survival. A forest plot with the corresponding hazard ratios is shown on the right. Red asterisks mark the cohorts for which the results are significant. CI, confidence interval. (C) Table with the major determinants of tumor immunogenicity identified using linear regression modeling, the corresponding coefficients and the adjusted P-values. Shown are also the results of the survival analysis for the TCGA cohort, including OS hazard ratio and the P-values. (D) Expression of the chemokine CCR8 in patients with and without metastasis in the TCGA cohort calculated from the RNA sequencing data. (E) Kaplan-Meier curves for germline mutations in CCR8 for the TCGA cohort. (F) Survival analysis for CCR8 in the TCGA cohort (RNA sequencing data) and 10 independent cohorts (microarray data). Red asterisks mark the cohorts for which the results are significant. (G) Hematoxylin and eosin staining of tissue sections from an orthotopic mouse model using murine MC38 cell line in wild-type C57Bl/6 and immunodeficient RAG1-/- mice. IF, immune cell infiltration; T, tumor. Black bar: 200 μm. (H,I) Endoscopic scoring (H) and tumor growth (I) after injection of MC38 cells (104) into the submucosa of wild-type C57Bl/6 and RAG1-/- mice. Error bars represent standard error of the mean. (J) Expression of CCR8 and its ligand CCL1 in the orthotopic mouse model of CRC. * P = 0.038, ** P = 0.017. Error bars represent standard error of the mean.

References

    1. Vogelstein B, Papadopoulos N, Velculescu VE, Zhou S, Diaz LA, Jr, Kinzler KW. Cancer genome landscapes. Science. 2013;339:1546–58. doi: 10.1126/science.1235122. - DOI - PMC - PubMed
    1. Brahmer JR, Tykodi SS, Chow LQ, Hwu WJ, Topalian SL, Hwu P, et al. Safety and activity of anti-PD-L1 antibody in patients with advanced cancer. N Engl J Med. 2012;366:2455–65. doi: 10.1056/NEJMoa1200694. - DOI - PMC - PubMed
    1. Topalian SL, Hodi FS, Brahmer JR, Gettinger SN, Smith DC, McDermott DF, et al. Safety, activity, and immune correlates of anti-PD-1 antibody in cancer. N Engl J Med. 2012;366:2443–54. doi: 10.1056/NEJMoa1200690. - DOI - PMC - PubMed
    1. Heemskerk B, Kvistborg P, Schumacher TN. The cancer antigenome. EMBO J. 2013;32:194–203. doi: 10.1038/emboj.2012.333. - DOI - PMC - PubMed
    1. Linnemann C, van Buuren MM, Bies L, Verdegaal EM, Schotte R, Calis JJ, et al. High-throughput epitope discovery reveals frequent recognition of neo-antigens by CD4+ T cells in human melanoma. Nat Med. 2015;21:81–5. doi: 10.1038/nm.3773. - DOI - PubMed

Publication types