. 2015;54(10):682-90.
doi: 10.3109/14992027.2015.1028656. Epub 2015 Sep 2.

An examination of speech reception thresholds measured in a simulated reverberant cafeteria environment

Affiliations

An examination of speech reception thresholds measured in a simulated reverberant cafeteria environment

Virginia Best et al. Int J Audiol. 2015.

Abstract

Objective: There is increasing demand in the hearing research community for the creation of laboratory environments that better simulate challenging real-world listening environments. The hope is that the use of such environments for testing will lead to more meaningful assessments of listening ability, and better predictions about the performance of hearing devices. Here we present one approach for simulating a complex acoustic environment in the laboratory, and investigate the effect of transplanting a speech test into such an environment.

Design: Speech reception thresholds were measured in a simulated reverberant cafeteria, and in a more typical anechoic laboratory environment containing background speech babble.

Study sample: The participants were 46 listeners varying in age and hearing levels, including 25 hearing-aid wearers who were tested with and without their hearing aids.

Results: Reliable SRTs were obtained in the complex environment, but led to different estimates of performance and hearing-aid benefit from those measured in the standard environment.

Conclusions: The findings provide a starting point for future efforts to increase the real-world relevance of laboratory-based speech tests.

Keywords: Speech reception thresholds; hearing aids; hearing loss; real-world.


Figures

Figure 1
Figure 1. Audiograms for each listener (averaged across left and right ears), as well as group means for the NH group (squares) and the HI group (circles)
Figure 2
Figure 2
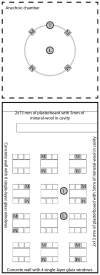
Schematic layout of the two environments. The standard environment (top) was an anechoic chamber, with a target (T) located directly in front of the listener (L), and four babble maskers (M) located at ±45° and ±135° azimuth. The complex environment (bottom) was a simulated reverberant cafeteria, including a kitchen area at one end of the room, and tables and chairs in the main area. The target was located directly in front of the listener and seven pairs of speech maskers were distributed in the room at different azimuths and distances. The floor was simulated as 6-mm pile carpet on closed-cell foam and the ceiling as 25 mm of mineral wool suspended by 200 mm from a concrete ceiling.
Figure 3
Figure 3
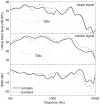
Critical band levels for the target (top panel) and masker (middle panel) signals for the standard (dashed gray lines) and complex (solid black lines) environment measured at the ears of a HATS placed inside the center of the 3D loudspeaker array. Due to the similarity of the ear signals the levels were averaged across the two ears. The critical band level of threshold simulating noise (TSN) is shown by the dotted lines. The bottom panel shows the SNR calculated as the difference between the above target and masker signals. The applied broadband SNR was 0 dB.
Figure 4
Figure 4
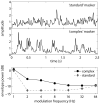
Temporal Hilbert envelopes of the masker in the standard (top panel) and complex (middle panel) condition and recorded at the left ear of a HATS placed in the center of the 3D loudspeaker array. The envelopes were calculated from the output of an auditory bandpass filter with a center frequency of 1 kHz and temporally smoothed using a 4th-order Butterworth lowpass filter with a cut-off frequency of 32 Hz. The corresponding amplitude modulation spectra are shown in the bottom panel. Signals were presented at 65 dB SPL.
Figure 5
Figure 5
Scatterplot showing individual SRTs in the complex environment against SRTs in the standard environment. Different symbols indicate NH listeners (squares) and unaided HI listeners (circles). The solid line shows the least squares fit.
Figure 6
Figure 6
Scatterplot showing individual hearing aid benefits in the complex environment against benefits in the standard environment (positive benefits indicate a reduction in the SRT, i.e. better aided performance). The solid line shows the least squares fit.
Figure 7
Figure 7. Scatterplot showing aided SRTs as a function of unaided SRTs in the standard (squares) and complex (circles) environments

References

    1. Agus TR, Akeroyd MA, Gatehouse S, Warden D. Informational masking in young and elderly listeners for speech masked by simultaneous speech and noise. Journal of the Acoustical Society of America. 2009;126:1926–1940. - PubMed
    1. ANSI S3.5-1997 Methods for calculation of the speech transmission index. A revision of ANSI S3.5-1969. American National Standard, 1997
    1. Bentler RA, Niebuhr DP, Getta JP, Anderson CV. Longitudinal study of hearing aid effectiveness II. Subjective measures J Speech Hear Res. 1993;36:820–831. - PubMed
    1. Bernstein JG, Grant KW. Auditory and auditory-visual intelligibility of speech in fluctuating maskers for normal-hearing and hearing-impaired listeners. Journal of the Acoustical Society of America. 2009;125:2258–3372. - PubMed
    1. Best V, Keidser G, Buchholz JM, Freeston K. Development and preliminary evaluation of a new test of ongoing speech comprehension. Submitted 2014 - PMC - PubMed

Publication types

MeSH terms

LinkOut - more resources