. 2015 Feb 20;16(1):39.
doi: 10.1186/s13059-015-0604-6.

DGEclust: differential expression analysis of clustered count data

DGEclust: differential expression analysis of clustered count data

Dimitrios V Vavoulis et al. Genome Biol. .

Abstract

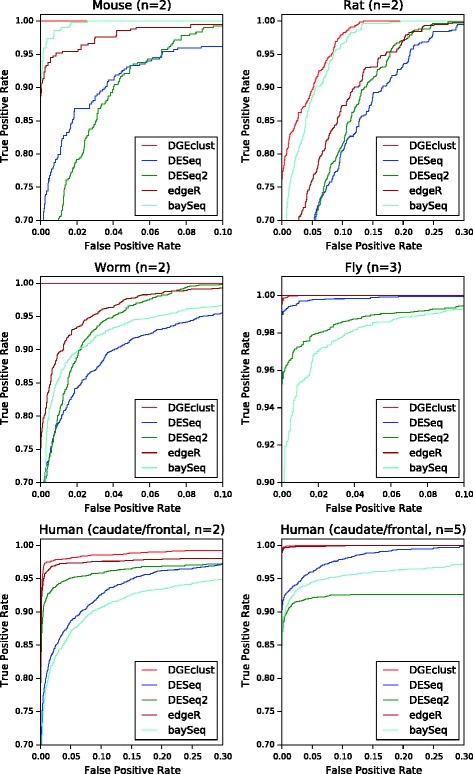
We present a statistical methodology, DGEclust, for differential expression analysis of digital expression data. Our method treats differential expression as a form of clustering, thus unifying these two concepts. Furthermore, it simultaneously addresses the problem of how many clusters are supported by the data and uncertainty in parameter estimation. DGEclust successfully identifies differentially expressed genes under a number of different scenarios, maintaining a low error rate and an excellent control of its false discovery rate with reasonable computational requirements. It is formulated to perform particularly well on low-replicated data and be applicable to multi-group data. DGEclust is available at http://dvav.github.io/dgeclust/.


Figures

Figure 1
Figure 1
Information sharing between genes and between sample classes. The statistical model in DGEclust internally models the counts for each gene i in each library j as random variables sampled from a negative binomial distribution with gene-specific parameters μ i and ϕ i and gene- and experimental condition- (or tissue-) specific log-fold-changes β il. Different genes within the same condition l may share the same log-fold-changes, which are randomly sampled from discrete, condition-specific random distributions (G 1 and G 2 in the figure). This imposes a clustering effect on genes in each experimental condition; genes in the same cluster have the same colour in the figure, while the probability of each cluster is proportional to the length of the vertical lines in distributions G 1 and G 2. The discreteness of G 1 and G 2 is because they are random samples themselves from a Dirichlet process with global base distribution G 0, which is also discrete. Since G 0 is shared among all experimental conditions, the clustering effect extends between them, i.e. a particular cluster may include genes from the same and/or different experimental conditions. Finally, G 0 is discrete, because it too is sampled from a Dirichlet process with base distribution H, like G 1 and G 2. If the expression profiles of a particular gene belong to two different clusters across two experimental conditions, then this gene is considered differentially expressed (see rows marked with stars in the figure).
Figure 2
Figure 2
Comparison of different methods. The area under the receiver operating characteristic curve is used as the performance measure. The box plots summarise the results obtained across three independent synthetic datasets for four different simulation settings. Each dataset included 10K genes and results across 2, 4 and 8 biological replicates are reported. DGEclust shows improved performance in comparison to other methods in all of the examined cases, particularly in the presence of a large proportion of differentially expressed genes (30%) and small sample sizes (n=2). The inclusion of non-over-dispersed genes significantly improves the performance of all methods, but the inclusion of outliers has the opposite effect. Still, DGEclust remains top-ranked among the alternative methods with respect to AUC scores. AUC, area under the receiver operating characteristic curve; DE, differentially expressed; ROC, receiver operating characteristic.
Figure 3
Figure 3
False discovery curves for all methods across the first 1,000 discoveries. The illustrated false discovery curves are averages over three independent repetitions of each synthetic dataset. DGEclust clearly keeps a lower number of false discoveries in comparison to the other methods in all cases. There is a single exception in the presence of outliers and at large sample sizes (n=8), where DESeq2 appears to be marginally better than DGEclust over the first 500 discoveries. DE, differentially expressed.
Figure 4
Figure 4
Type I errors for all methods at a pre-specified significance threshold. The box plots summarise results across three independently obtained simulated datasets for three different simulation settings. In all cases, exactly zero genes were truly differentially expressed. To make possible a comparison between methods that return P values (DESeq/DESeq2 and edgeR) and those that return posterior probabilities (DGEclust and baySeq), we report the Type I error rate at a relatively high false discovery rate, FDR = 10%. In all cases, DGEclust maintains a minimal Type I error rate, particularly for small sample sizes (n=2). DE, differentially expressed.
Figure 5
Figure 5
False discovery rates for all methods at a pre-specified significance threshold. The box plots summarise the FDRs obtained across three independently obtained simulated datasets at four different simulation settings at an imposed significance level of 10%. The ability of all methods to control their FDR increases with the sample size. In all cases, DGEclust demonstrates excellent control over its FD, particularly at small sample sizes (n=2). Interestingly, in the presence of outliers, DGEclust is the only method that keeps its FDR at or below the pre-specified threshold at all sample sizes. DE, differentially expressed; FD, false discovery; FDR, false discovery rate.
Figure 6
Figure 6
Comparison of ROC curves from different methods. The methods are applied to RNA-seq or CAGE data from a number of different species. In all cases, a ground truth was established by considering the absolute value of the log2 ratio of the mean expression across all replicas between two conditions [52]. DGEclust demonstrates excellent performance in all cases. At small sample sizes (n=2), it is ranked at the top, while for larger sizes (n=3 or n=5), it performs similarly to edgeR. CAGE, cap analysis of gene expression; RNA-seq, RNA sequencing; ROC, receiver operating characteristic.
Figure 7
Figure 7
Comparison of ROC curves for different methods. The methods were applied to CAGE data from different regions of the human brain. A ground truth was established as in Figure 6. DGEclust is top-ranked in all cases. All methods demonstrate excellent performance, achieving a TPR larger than 0.8 at FPRs less than 0.01. As indicated by the Venn diagrams constructed from DE genes obtained at an FDR equal to 0.1%, the three methods demonstrate a significant overlap, sharing more than 1K genes in most cases. In terms of the number of novel discoveries (i.e. DE genes identified as such only by a particular method), DGEclust occupies the middle spot between DESeq2 (first) and edgeR (third). CAGE, cap analysis of gene expression; DE, differentially expressed; FDR, false discovery rate; FPR, false positive rate; hippocamp., hippocampus; ROC, receiver operating characteristic; TPR, true positive rate.
Figure 8
Figure 8
Hierarchical clustering of brain regions based on CAGE data. We constructed a similarity matrix based on the number of differentially expressed transcripts discovered by DGEclust between all possible pairs of brain regions. This similarity matrix was then used as input to a hierarchical clustering algorithm using a Euclidean distance metric and average linkage. As illustrated by the generated heat map and dendrograms, cortical regions (frontal and temporal lobes) are clustered together with the hippocampus and all three are maximally distant from subcortical regions, i.e. the dorsal striatum (putamen and caudate nucleus) of the basal ganglia. CAGE, cap analysis of gene expression.
Figure 9
Figure 9
Computational requirements of DGEclust . Computation time and peak memory usage scale linearly with the number of genes and with the number of clusters. These measurements were obtained using IPython’s %timeit and %memit commands. Using multiple cores to process samples has a significant impact on simulation speeds (top right panel). Genes are processed in parallel by default.

Similar articles

Cited by

References

    1. Wang Z, Gerstein M, Snyder M. RNA-Seq: a revolutionary tool for transcriptomics. Nat Rev Genet. 2009;10:57–63. doi: 10.1038/nrg2484. - DOI - PMC - PubMed
    1. Shiraki T, Kondo S, Katayama S, Waki K, Kasukawa T, Kawaji H, et al. Cap analysis gene expression for high-throughput analysis of transcriptional starting point and identification of promoter usage. Proc Natl Acad Sci USA. 2003;100(1577):6–81. - PMC - PubMed
    1. Velculescu VE, Zhang L, Vogelstein B, Kinzler KW. Serial analysis of gene expression. Science. 1995;270:484–7. doi: 10.1126/science.270.5235.484. - DOI - PubMed
    1. Auer PL, Doerge RW. Statistical design and analysis of RNA sequencing data. Genetics. 2010;185:405–16. doi: 10.1534/genetics.110.114983. - DOI - PMC - PubMed
    1. Sun Z, Zhu Y. Systematic comparison of RNA-Seq normalization methods using measurement error models. Bioinformatics. 2012;28:2584–91. doi: 10.1093/bioinformatics/bts497. - DOI - PubMed

Publication types