. 2015 Apr 8;10(4):e0124124.
doi: 10.1371/journal.pone.0124124. eCollection 2015.

Impact of the CFTR-potentiator ivacaftor on airway microbiota in cystic fibrosis patients carrying a G551D mutation

Affiliations

Impact of the CFTR-potentiator ivacaftor on airway microbiota in cystic fibrosis patients carrying a G551D mutation

Cédric Bernarde et al. PLoS One. .

Abstract

Background: Airway microbiota composition has been clearly correlated with many pulmonary diseases, and notably with cystic fibrosis (CF), an autosomal genetic disorder caused by mutation in the CF transmembrane conductance regulator (CFTR). Recently, a new molecule, ivacaftor, has been shown to re-establish the functionality of the G551D-mutated CFTR, allowing significant improvement in lung function.

Objective and methods: The purpose of this study was to follow the evolution of the airway microbiota in CF patients treated with ivacaftor, using quantitative PCR and pyrosequencing of 16S rRNA amplicons, in order to identify quantitative and qualitative changes in bacterial communities. Three G551D children were followed up longitudinally over a mean period of more than one year covering several months before and after initiation of ivacaftor treatment.

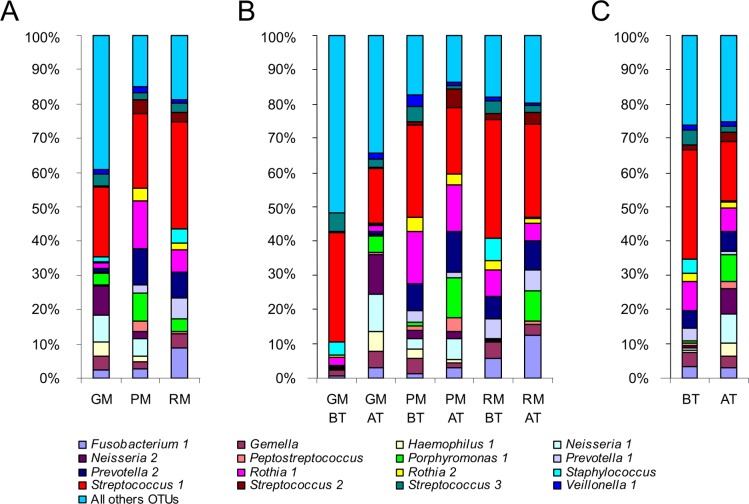
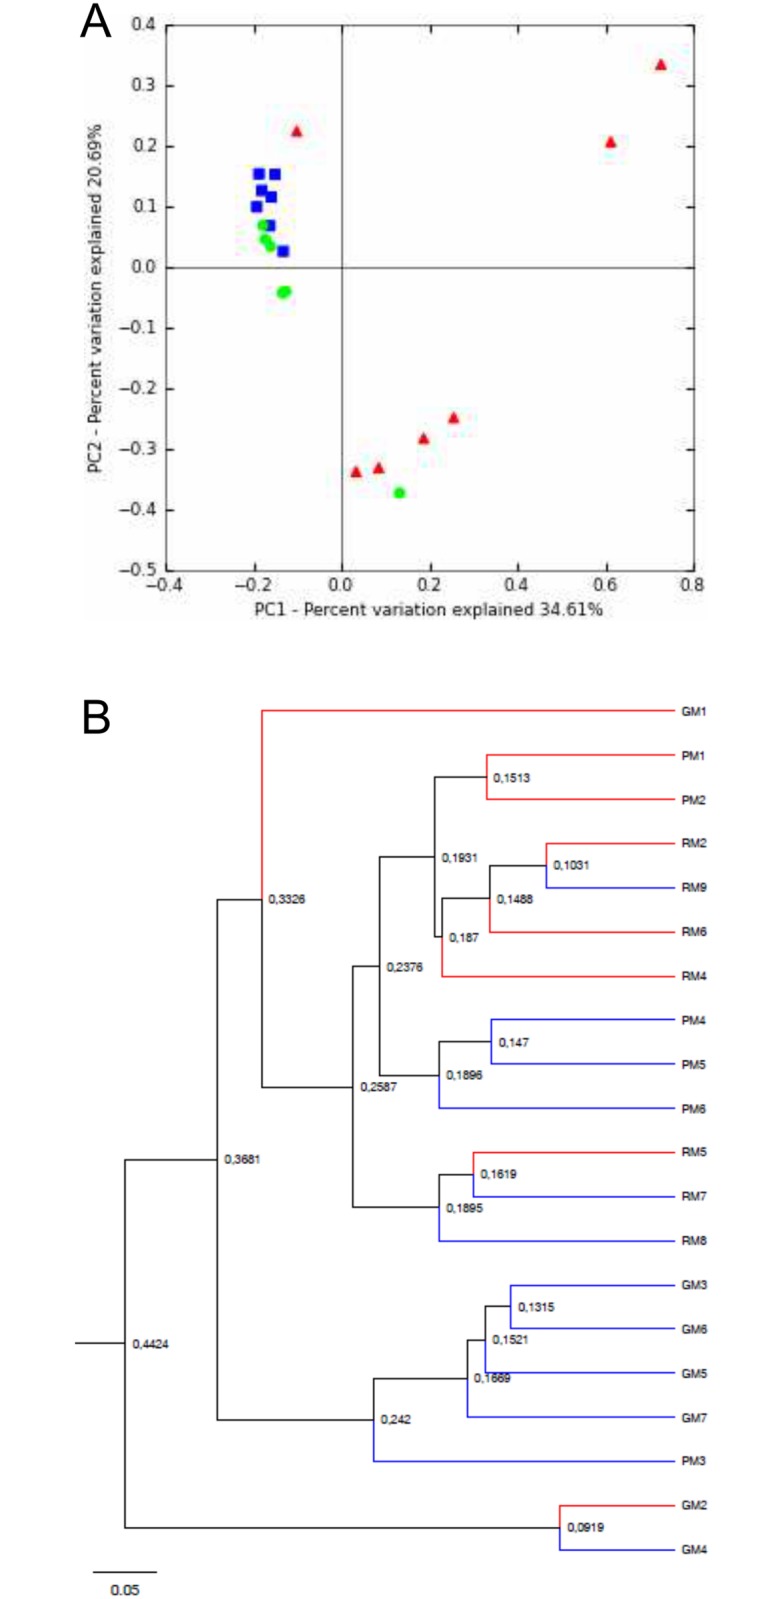
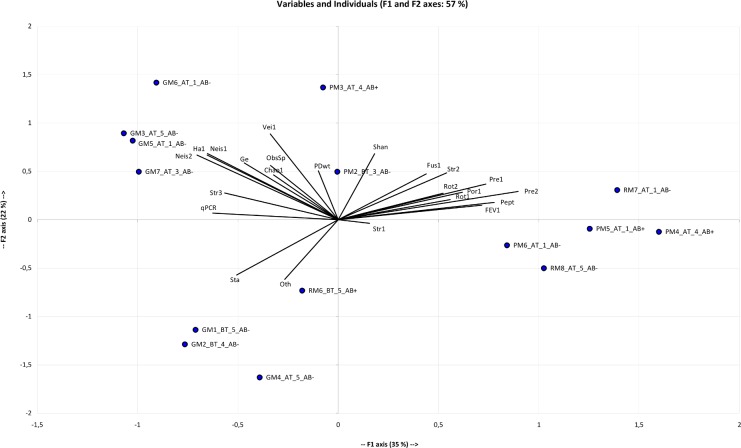
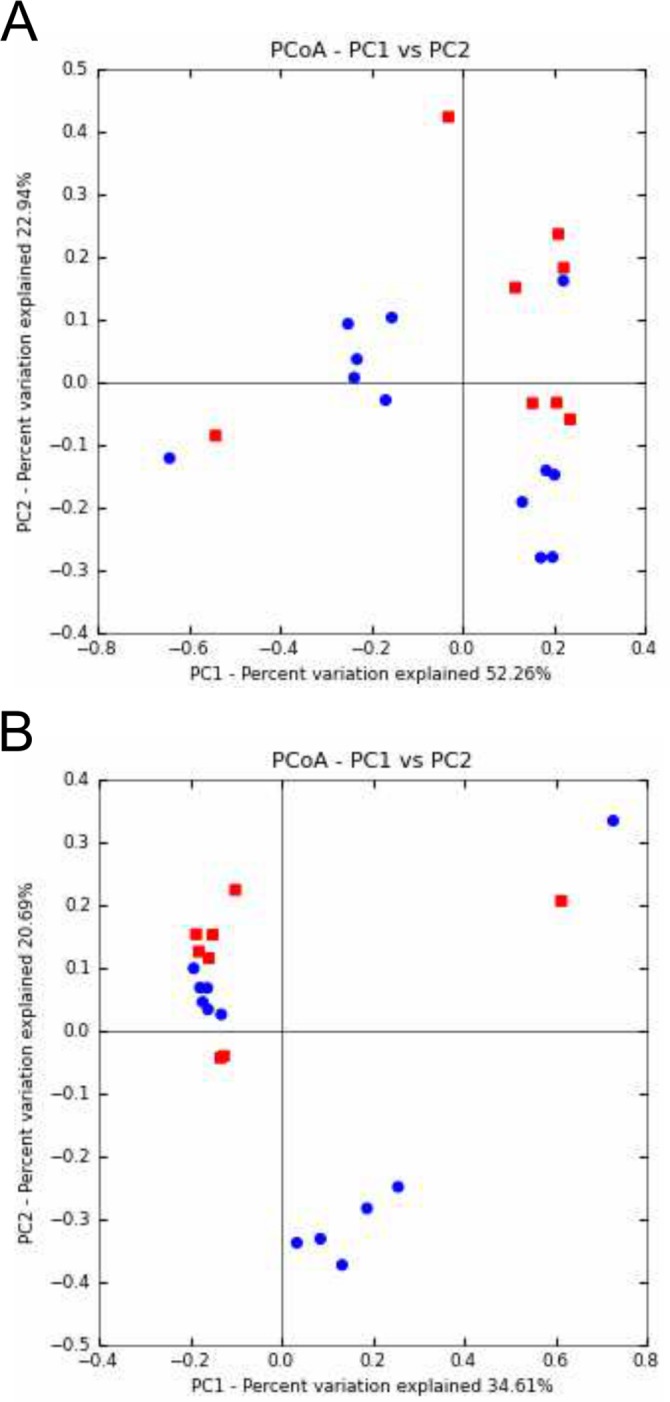
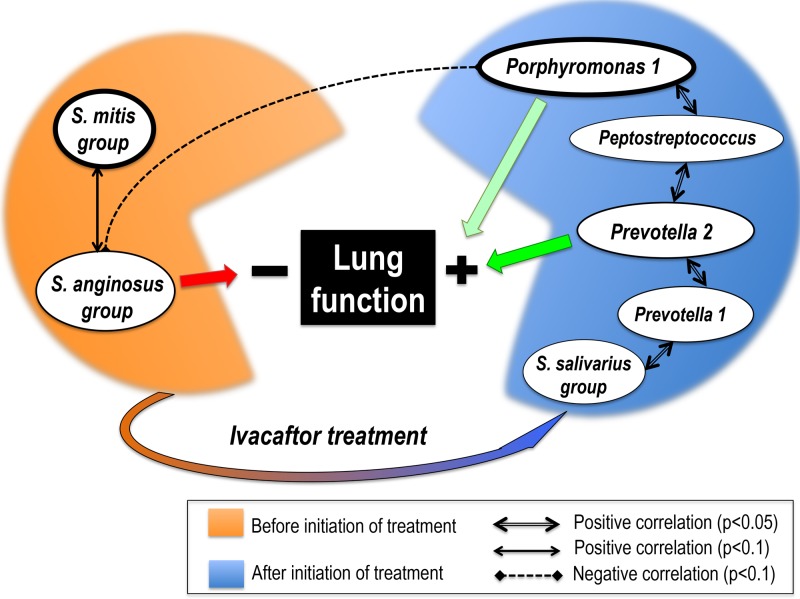
Results: 129 operational taxonomy units (OTUs), representing 64 genera, were identified. There was no significant difference in total bacterial load before and after treatment. Comparison of global community composition found no significant changes in microbiota. Two OTUs, however, showed contrasting dynamics: after initiation of ivacaftor, the relative abundance of the anaerobe Porphyromonas 1 increased (p<0.01) and that of Streptococcus 1 (S. mitis group) decreased (p<0.05), possibly in relation to the anti-Gram-positive properties of ivacaftor. The anaerobe Prevotella 2 correlated positively with the pulmonary function test FEV-1 (r=0.73, p<0.05). The study confirmed the presumed positive role of anaerobes in lung function.

Conclusion: Several airway microbiota components, notably anaerobes (obligate or facultative anaerobes), could be valuable biomarkers of lung function improvement under ivacaftor, and could shed light on the pathophysiology of lung disease in CF patients.


Conflict of interest statement

Competing Interests: The authors have declared that no competing interests exist.

Figures

Fig 1
Fig 1. Relative abundance (RA) of OTUs belonging to the major core microbiota.
A) RA of OTUs for the three patients (GM, PM, and RM) highlighted that each individual harbored his or her own microbiota, even if several genera were shared. B) RA of OTUs before ivacaftor treatment (BT) and after the beginning of ivacaftor treatment (AT) for each patient. RA of Streptococcus 1 showed a tendency to decrease from BT to AT samples, whereas Porphyromonas 1 increased. C) Grouping all BT samples (on the left of the graph) and all AT samples (on the right of the graph) confirmed the tendency observed per patient: after ivacaftor treatment, the RA of Streptococcus 1 decreased while that of Porphyromonas 1 increased.
Fig 2
Fig 2. Analysis of microbiota data for the 20 CF sputum samples based on non-phylogenetic distances.
A) Principal coordinate analysis of microbial community structure per patient using Bray Curtis distances. PC1 and PC2 represented 55.3% of the variability. Red triangles: patient GM’s samples. Green circles: patient PM’s samples. Blue squares: patient RM’s samples. B) UPGMA clustering of samples using Bray Curtis distances. BT samples are represented by red branches and AT samples by blue branches. The scale bar represents a 5% sequence divergence.
Fig 3
Fig 3. Principal component analysis (PCA) of the 20 sputum samples according to different quantitative variables.
For each sample, the name contained the group (BT: before ivacaftor treatment; AT: after the beginning of ivacaftor treatment), cytologic class (1 to 5) and presence (AB+) or absence (AB-) of antibiotic treatment. The F1 and F2 axes explained respectively 35% and 22% of the variability. Only 15 samples are represented, because FEV-1 data were lacking for 5 samples (Table 1). The F1 axis was positively correlated with FEV-1, Peptostreptococcus (Pept), Prevotella 1&2 (Pre1&2), Porphyromonas 1 (Por1), Rothia 1&2 (Rot1&2) and Streptococcus 2 (Str2). These variables also correlated positively with each other, suggesting that these taxa may be positively correlated with FEV-1 improvement. In contrast, the F1 axis correlated negatively with qPCR, Haemophilus 1 (Ha1), Neisseria 1&2 (Neis1&2), Staphylococcus aureus (Sta) and Streptococcus 3 (Str3), indicating that these taxa may be more abundant and with higher bacterial density when respiratory capacity is lower. The F2 axis opposed S. aureus and OTUs not belonging to the core microbiota (Oth) to Veillonella (Veil), Neisseria 1&2, Haemophilus 1, Gemella (Ge) and higher diversity indices (Shannon index (Shan), phylogenetic diversity whole tree (PDwt) and observed species (ObsSp)).
Fig 4
Fig 4. Principal coordinates analysis (PCoA) of CF sputum samples according to ivacaftor treatment and microbial community composition and abundance.
A) PCoA of microbial community structures using weighted and normalized UniFrac phylogenetic distances. A clustering of 6 of the 8 BT samples (before ivacaftor treatment; red squares) was observed. Conversely, AT samples (after ivacaftor treatment; blue circles) appeared scattered on the graph. PC1 and PC2 represented 75.2% of the variability. B) PCoA of microbial community structures using Bray Curtis non-phylogenetic distances. Seven of the 8 BT samples (red squares) were clustered. PC1 and PC2 represented 55.3% of the variability.
Fig 5
Fig 5. Dynamics and interrelations of 7 key-role OTUs throughout ivacaftor treatment, and their correlations with lung function.
Streptococcus 1 (S. mitis group) and Porphyromonas 1 were the two OTUs for which a significant association with ivacaftor treatment period emerged (Colin-White test; See S2 Table): Streptococcus 1 (S. mitis group) was associated with sputum samples collected before (p<0.05) and Porphyromonas 1 with samples collected after initiation of treatment (p<0.01). The depicted correlations between OTUs were all statistically significant with the adjusted p-values (Spearman correlation test; see Table 3). Significant correlations between OTUs and lung function (on FEV-1 test) are shown by red arrow when negative (p<0.05) and green arrow (light green if p<0.1; dark green if p<0.05) when positive (adjusted p-values; see Table 2).

References

    1. Willner D, Furlan M, Haynes M, Schmieder R, Angly FE, Silva J, et al. Metagenomic analysis of respiratory tract DNA viral communities in cystic fibrosis and non-cystic fibrosis individuals. PLOS One. 2009;4:e7370 10.1371/journal.pone.0007370 - DOI - PMC - PubMed
    1. Hilty M, Burke C, Pedro H, Cardenas P, Bush A, Bossley C, et al. Disordered microbial communities in asthmatic airways. PLOS One. 2010;5:e8578 10.1371/journal.pone.0008578 - DOI - PMC - PubMed
    1. Charlson ES, Bittinger K, Haas AR, Fitzgerald AS, Frank I, Yadav A, et al. Topographical continuity of bacterial populations in the healthy human respiratory tract. Am J Respir Crit Care Med. 2011;184:957–963. 10.1164/rccm.201104-0655OC - DOI - PMC - PubMed
    1. Segal LN, Alekseyenko AV, Clemente JC, Kulkarni R, Wu B, Gao Z, et al. Enrichment of lung microbiome with supraglottic taxa is associated with increased pulmonary inflammation. Microbiome. 2013;1:19 10.1186/2049-2618-1-19 - DOI - PMC - PubMed
    1. Rogers GB, Hart CA, Mason JR, Hughes M, Walshaw MJ, Bruce KD. Bacterial diversity in cases of lung infection in cystic fibrosis patients: 16S ribosomal DNA (rDNA) length heterogeneity PCR and 16S rDNA terminal restriction fragment length polymorphism profiling. J Clin Microbiol. 2003;41:3548–3558. - PMC - PubMed

Publication types

MeSH terms