. 2015 Sep;9(9):1941-53.
doi: 10.1038/ismej.2015.6. Epub 2015 Mar 13.

Marked seasonality and high spatial variability of protist communities in shallow freshwater systems

Affiliations

Marked seasonality and high spatial variability of protist communities in shallow freshwater systems

Marianne Simon et al. ISME J. 2015 Sep.

Abstract

Small eukaryotes have key roles in aquatic ecosystems, influencing their local environment, global biogeochemical cycles and climate. Their impact depends on community structure, which varies along time. However, very few studies take into account temporal variation. This is especially true for small, shallow freshwater systems, which remain largely understudied despite their wide variety, global surface and intense microbial activity. We have monthly followed changes in the community structure of small microbial eukaryotes (0.2-5 μm cell diameter) for 2 years in four ponds and one brook located in North-Western France based on massive 18S rDNA amplicon 454 pyrosequencing. We detected a total of 3742 stringently defined operational taxonomic units (OTUs) encompassing all recognized eukaryotic supergroups and lineages of uncertain affiliation. Although geographically close, protist communities in the five ecosystems were contrasting, with very few shared OTUs, suggesting that environmental selection mainly drives community structure. The temporal dynamics of different high-rank taxa appeared complex and rapid at monthly scales. Despite this, a clear and reproducible seasonality was observed. As expected, low-abundance OTUs dominated the community. Although some of them appeared sporadically or remained at low frequencies during the survey, others occasionally reached relatively high abundances, sometimes recurrently. This shows that at least a fraction of low-abundance eukaryotes constitutes a seed bank. The annual proportion of primary producers, free-living heterotrophs and parasites appeared remarkably constant among the different ecosystems, suggesting underlying trends of ecosystem carrying capacity for these functional groups.


Figures
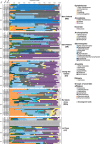
Figure 1
Figure 1
Histograms showing the relative abundance of 18S rDNA amplicon reads assigned to high-rank taxa, in all samples from the five ecosystems over the 2-years survey. Hatched bars correspond to missing data because of the drought periods: the Ru Sainte Anne was dried in August and September 2012, and La Claye from the end of July to December 2011 and in September 2012.
Figure 2
Figure 2
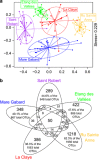
Distinct communities in the five freshwater ecosystems. (a) Non-metric multidimensional scaling plot, built on square-root-transformed and Wisconsinstandardized Bray–Curtis dissimilarities between all samples. (b) Venn diagram showing the number of OTUs shared by several ecosystems or specific to an ecosystem. Proportions of OTUs specific to each ecosystem among all OTUs detected in this ecosystem are indicated. All samples from the 2-year survey are pooled for each ecosystem.
Figure 3
Figure 3
Relative abundance of five OTUs showing different types of dynamics, in samples from the five ecosystems, over the 2-year survey. Each color corresponds to the relative abundance (proportion of reads) dynamics in one of the sampled systems (see legend in Figure 1). The name and taxonomic affiliations of OTUs are indicated at each panel. Ru Sainte Anne dried in August and September 2012, and La Claye pond from the end of July to December 2011 and in September 2012. Missing data are indicated by dashed lines.
Figure 4
Figure 4
Pairwise Bray–Curtis dissimilarities between samples separated from 1 to 12 months. Each point represents the mean of pairwise Bray–Curtis dissimilarities between samples 1 to 12 months apart, plotted with standard errors. All means are based on 12 dissimilarities except for Ru Sainte Anne and La Claye pond because of missing data due to drought periods. The color reproduction of this figure is available on the ISME Journal journal online
Figure 5
Figure 5
CCA plot. CCA was conducted on all samples and on the 37 OTUs detected in at least 25% of samples and having a mean relative abundance per sample of 0.1% or above, after a Wisconsin standardization. Both physicochemical parameters measured in the ecosystems' water and weather information were included in the analysis. Dots represent OTUs, with color and form indicating their taxonomic affiliation. CCTHK, Cryptophyta, Centroheliozoa, Telonema, Haptophyta, Katablepharida; Chl a, chlorophyll a; Cond, conductivity; DOC, dissolved organic carbon; Rad, mean daily solar radiation of the week before sampling; Rain, rainfall during the week before sampling; Temp, water temperature; Wind, mean wind speed at 10 m high during the sampling day.
Figure 6
Figure 6
Distribution of relative abundances of reads affiliated to potential parasites, other heterotrophs and primary producers in all samples from the five ecosystems. The thickest line inside each box represents the median of the distribution, bottom and top borders of boxes correspond to the first and third quartiles and whiskers extend to minimal and maximal values. Notches are drawn to indicate whether medians of the three distributions can be considered as different for each ecosystem (Chambers et al., 1983, p. 62). Putative parasites: Apicomplexa, Rozellida, Oomyceta, Perkinsea, Ichthyosporea; potential other heterotrophs: Ancyromonadida, Apusomonadida, Bicosoecida, Centroheliozoa, Cercozoa, Choanoflagellida, Ciliophora, Colpodellida, Conosa, Discosea, Fungi, Katablepharida, Labyrinthulida, Lobosa, Malawimonadida, MAST, Metamonada, Telonema; putative primary producers: Bacillariophyceae, Chlorophyta, Chrysophyceae–Synurophyceae, Cryptophyta, Dictyochophyceae, Dinophyta, Glaucophyta, Haptophyta, Rhodophyta, Streptophyta, Xanthophyceae.

References

    1. Adl SM, Simpson AGB, Lane CE, Lukeš J, Bass D, Bowser SS et al. (2012). The revised classification of eukaryotes. J Eukaryot Microbiol 59: 429–493. - PMC - PubMed
    1. Anderson MJ. (2001). A new method for non-parametric multivariate analysis of variance. Austral Ecol 26: 32–46.
    1. Bachy C, Dolan JR, López-García P, Deschamps P, Moreira D. (2013). Accuracy of protist diversity assessments: morphology compared with cloning and direct pyrosequencing of 18S rRNA genes and ITS regions using the conspicuous tintinnid ciliates as a case study. ISME J 7: 244–255. - PMC - PubMed
    1. Bamforth SS. (1958). ecological studies on the planktonic protozoa of a small artificial pond. Limnol Oceanogr 3: 398–412.
    1. Bolker B, Bonekakke L, Gentleman R, Liaw WHA, Lumley T, Maechler M et al. (2012), gplots: Various R programming tools for plotting data. R package version 2.11.0. Available at: http://cran.r-project.org/package=gplots.

Publication types