

Mucosal-associated invariant T cell is a potential marker to distinguish fibromyalgia syndrome from arthritis
- PMID: 25853812
- PMCID: PMC4390316
- DOI: 10.1371/journal.pone.0121124
Mucosal-associated invariant T cell is a potential marker to distinguish fibromyalgia syndrome from arthritis
Abstract
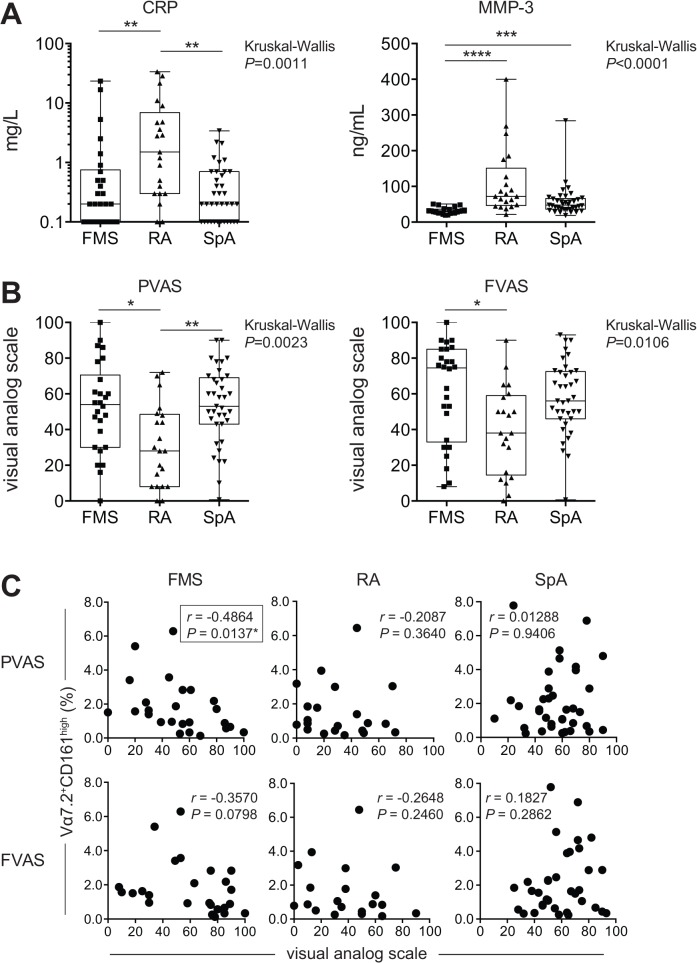
Background: Fibromyalgia (FM) is defined as a widely distributed pain. While many rheumatologists and pain physicians have considered it to be a pain disorder, psychiatry, psychology, and general medicine have deemed it to be a syndrome (FMS) or psychosomatic disorder. The lack of concrete structural and/or pathological evidence has made patients suffer prejudice that FMS is a medically unexplained symptom, implying inauthenticity. Furthermore, FMS often exhibits comorbidity with rheumatoid arthritis (RA) or spondyloarthritis (SpA), both of which show similar indications. In this study, disease specific biomarkers were sought in blood samples from patients to facilitate objective diagnoses of FMS, and distinguish it from RA and SpA.
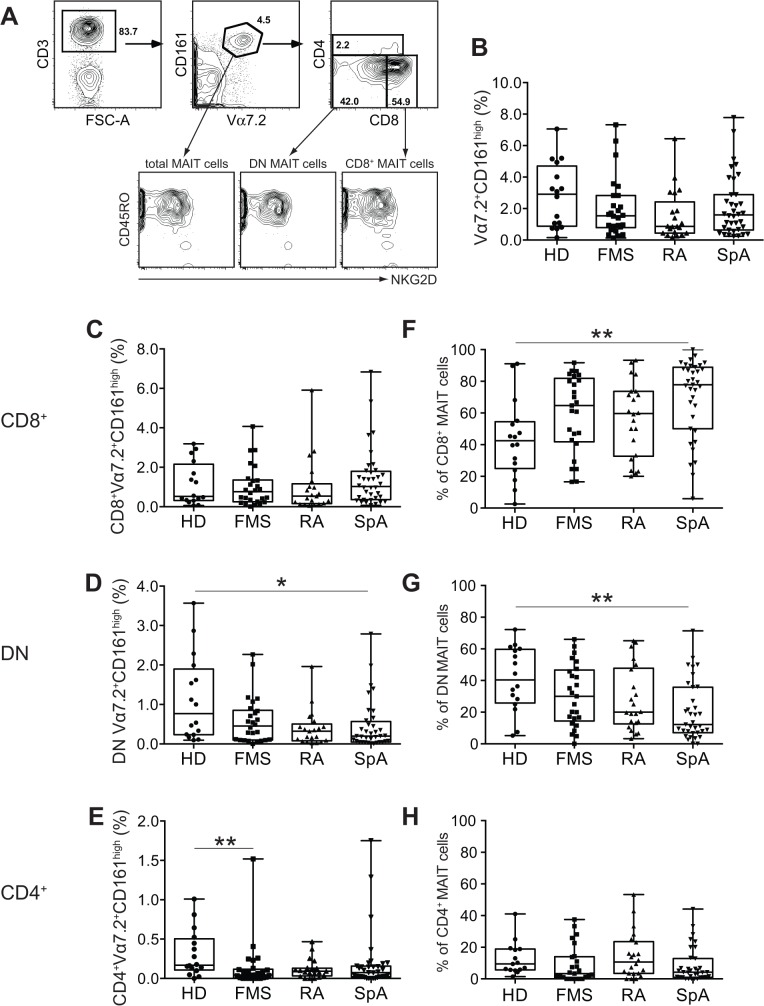
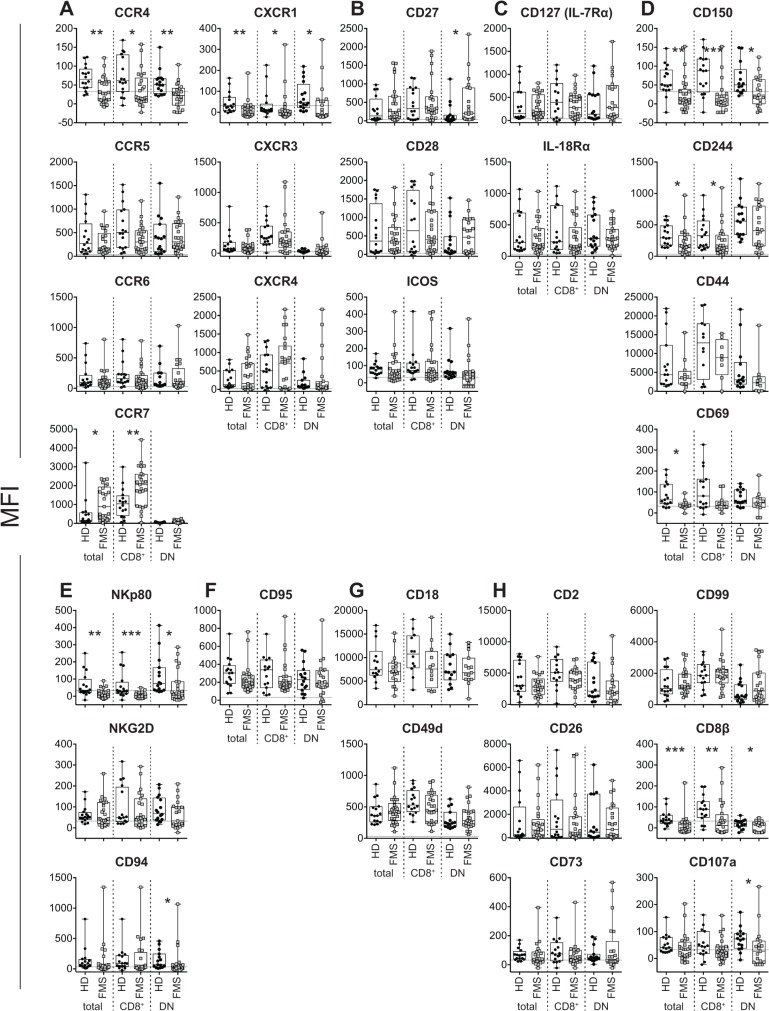
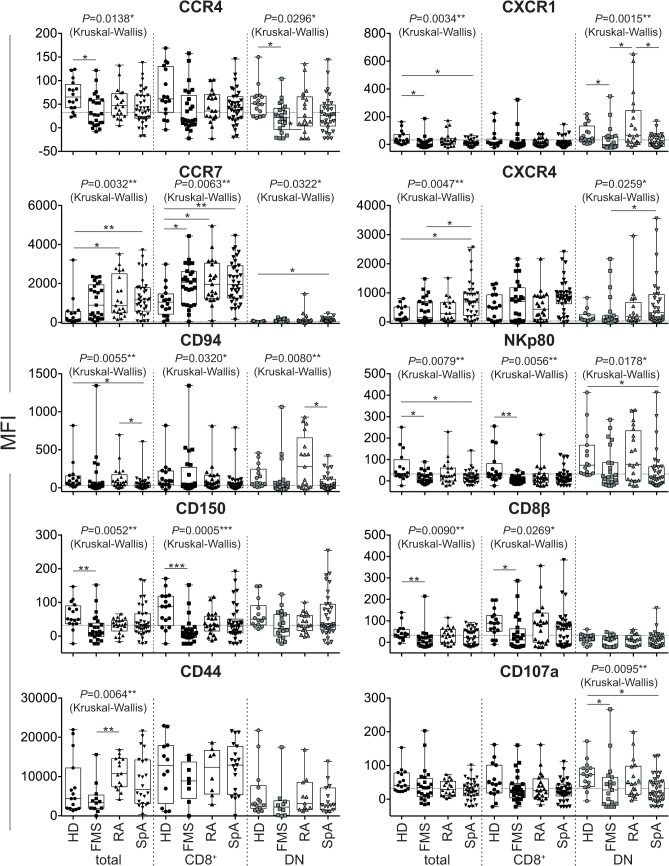
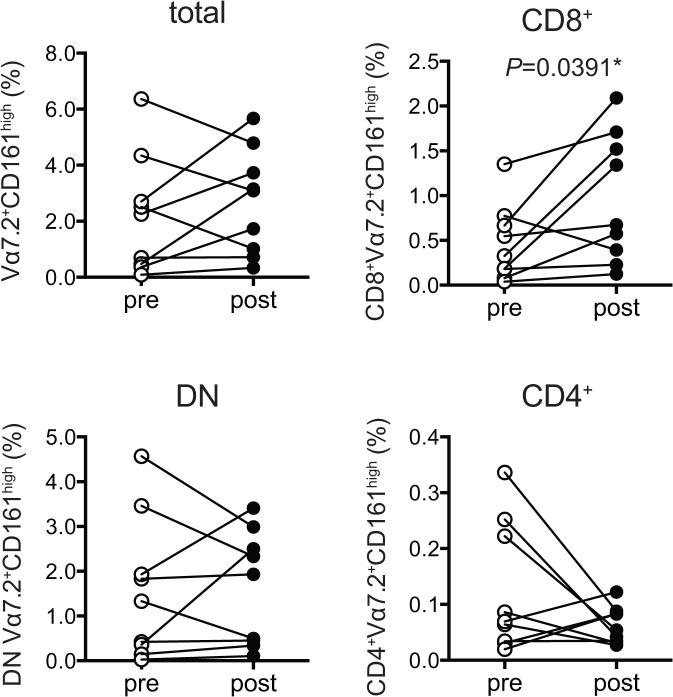
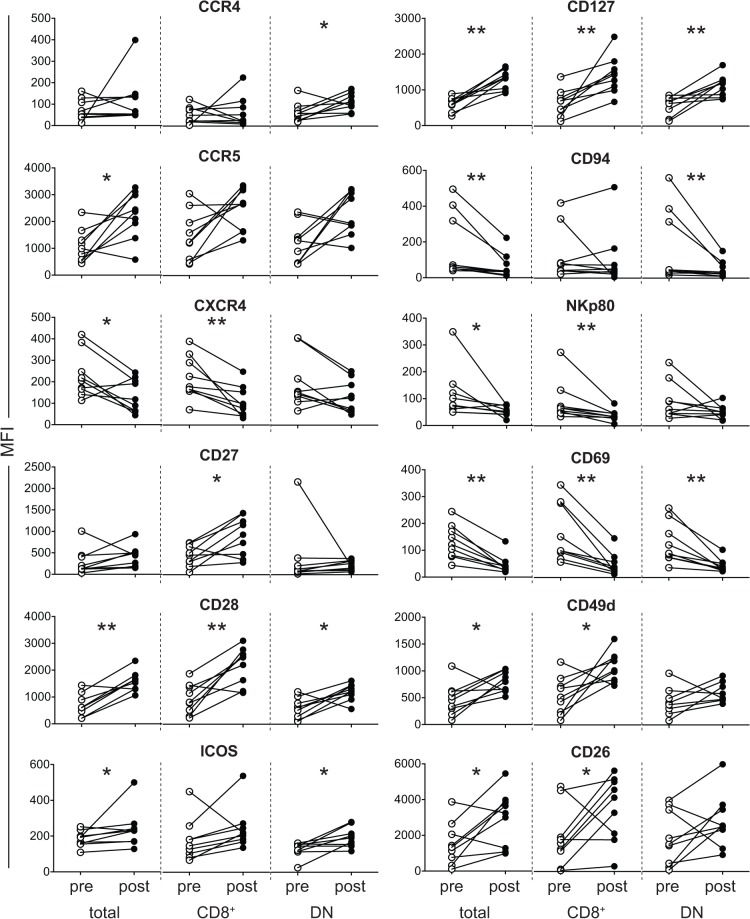
Methods: Peripheral blood mononuclear cells (PBMCs) from patients and healthy donors (HD) were subjected to multicolor flow cytometric analysis. The percentage of mucosal-associated invariant T (MAIT) cells in PBMCs and the mean fluorescent intensity (MFI) of cell surface antigen expression in MAIT cells were analyzed.
Results: There was a decrease in the MAIT cell population in FMS, RA, and SpA compared with HD. Among the cell surface antigens in MAIT cells, three chemokine receptors, CCR4, CCR7, and CXCR1, a natural killer (NK) receptor, NKp80, a signaling lymphocyte associated molecule (SLAM) family, CD150, a degrunulation marker, CD107a, and a coreceptor, CD8β emerged as potential biomarkers for FMS to distinguish from HD. Additionally, a memory marker, CD44 and an inflammatory chemokine receptor, CXCR1 appeared possible markers for RA, while a homeostatic chemokine receptor, CXCR4 deserved for SpA to differentiate from FMS. Furthermore, the drug treatment interruption resulted in alternation of the expression of CCR4, CCR5, CXCR4, CD27, CD28, inducible costimulatory molecule (ICOS), CD127 (IL-7 receptor α), CD94, NKp80, an activation marker, CD69, an integrin family member, CD49d, and a dipeptidase, CD26, in FMS.
Conclusions: Combined with the currently available diagnostic procedures and criteria, analysis of MAIT cells offers a more objective standard for the diagnosis of FMS, RA, and SpA, which exhibit multifaceted and confusingly similar clinical manifestations.
Conflict of interest statement
Figures
Similar articles
-
Altered composition and phenotype of mucosal-associated invariant T cells in early untreated rheumatoid arthritis.Arthritis Res Ther. 2019 Jan 5;21(1):3. doi: 10.1186/s13075-018-1799-1. Arthritis Res Ther. 2019. PMID: 30611306 Free PMC article.
-
Clinical utility of red blood cell distribution width in inflammatory and non-inflammatory joint diseases.Int J Rheum Dis. 2019 Jan;22(1):47-54. doi: 10.1111/1756-185X.13332. Epub 2018 Aug 30. Int J Rheum Dis. 2019. PMID: 30168259
-
Cytokine and chemokine profiles in fibromyalgia, rheumatoid arthritis and systemic lupus erythematosus: a potentially useful tool in differential diagnosis.Rheumatol Int. 2015 Jun;35(6):991-6. doi: 10.1007/s00296-014-3172-2. Epub 2014 Nov 7. Rheumatol Int. 2015. PMID: 25377646 Free PMC article.
-
Fibromyalgia and arthritides.Reumatismo. 2012 Sep 28;64(4):286-92. doi: 10.4081/reumatismo.2012.286. Reumatismo. 2012. PMID: 23024973 Review.
-
[Fibromyalgia syndrome as a psychosomatic disorder - diagnosis and therapy according to current evidence-based guidelines].Z Psychosom Med Psychother. 2013;59(2):132-52. doi: 10.13109/zptm.2013.59.2.132. Z Psychosom Med Psychother. 2013. PMID: 23775553 Review. German.
Cited by
-
Mucosal-Associated Invariant T Cells in Autoimmune Diseases.Front Immunol. 2018 Jun 11;9:1333. doi: 10.3389/fimmu.2018.01333. eCollection 2018. Front Immunol. 2018. PMID: 29942318 Free PMC article. Review.
-
Markers of Tissue Deterioration and Pain on Earth and in Space.J Pain Res. 2024 May 8;17:1683-1692. doi: 10.2147/JPR.S450180. eCollection 2024. J Pain Res. 2024. PMID: 38742243 Free PMC article.
-
Mucosal-associated invariant T cells from induced pluripotent stem cells: A novel approach for modeling human diseases.World J Stem Cells. 2016 Apr 26;8(4):158-69. doi: 10.4252/wjsc.v8.i4.158. World J Stem Cells. 2016. PMID: 27114747 Free PMC article. Review.
-
Mucosal-associated invariant T cells and disease.Nat Rev Immunol. 2019 Oct;19(10):643-657. doi: 10.1038/s41577-019-0191-y. Nat Rev Immunol. 2019. PMID: 31308521 Review.
-
Association of high complement and low immunoglobulins with the clinical symptoms of patients with fibromyalgia.Biopsychosoc Med. 2025 Jan 21;19(1):1. doi: 10.1186/s13030-024-00321-9. Biopsychosoc Med. 2025. PMID: 39838480 Free PMC article.
References
-
- Kroenke K (2007) Somatoform disorders and recent diagnostic controversies. Psychiatr Clin North Am 30: 593–619. - PubMed
-
- Lipowski ZJ (1988) Somatization: the concept and its clinical application. Am J Psychiatry 145: 1358–1368. - PubMed
-
- Pernambuco AP, Schetino LP, Alvim CC, Murad CM, Viana RS, Carvalho LS, et al. (2013) Increased levels of IL-17A in patients with fibromyalgia. Clin Exp Rheumatol 31: S60–S63. - PubMed
Publication types
MeSH terms
Substances
LinkOut - more resources
Full Text Sources
Other Literature Sources
Medical
Research Materials
Miscellaneous
