. 2015 Feb 22;16(1):41.
doi: 10.1186/s13059-015-0608-2.

Transcript and protein expression decoupling reveals RNA binding proteins and miRNAs as potential modulators of human aging

Transcript and protein expression decoupling reveals RNA binding proteins and miRNAs as potential modulators of human aging

Yu-Ning Wei et al. Genome Biol. .

Abstract

Background: In studies of development and aging, the expression of many genes has been shown to undergo drastic changes at mRNA and protein levels. The connection between mRNA and protein expression level changes, as well as the role of posttranscriptional regulation in controlling expression level changes in postnatal development and aging, remains largely unexplored.

Results: Here, we survey mRNA and protein expression changes in the prefrontal cortex of humans and rhesus macaques over developmental and aging intervals of both species' lifespans. We find substantial decoupling of mRNA and protein expression levels in aging, but not in development. Genes showing increased mRNA/protein disparity in primate brain aging form expression patterns conserved between humans and macaques and are enriched in specific functions involving mammalian target of rapamycin (mTOR) signaling, mitochondrial function and neurodegeneration. Mechanistically, aging-dependent mRNA/protein expression decoupling could be linked to a specific set of RNA binding proteins and, to a lesser extent, to specific microRNAs.

Conclusions: Increased decoupling of mRNA and protein expression profiles observed in human and macaque brain aging results in specific co-expression profiles composed of genes with shared functions and shared regulatory signals linked to specific posttranscriptional regulators. Genes targeted and predicted to be targeted by the aging-dependent posttranscriptional regulation are associated with biological processes known to play important roles in aging and lifespan extension. These results indicate the potential importance of posttranscriptional regulation in modulating aging-dependent changes in humans and other species.


Figures
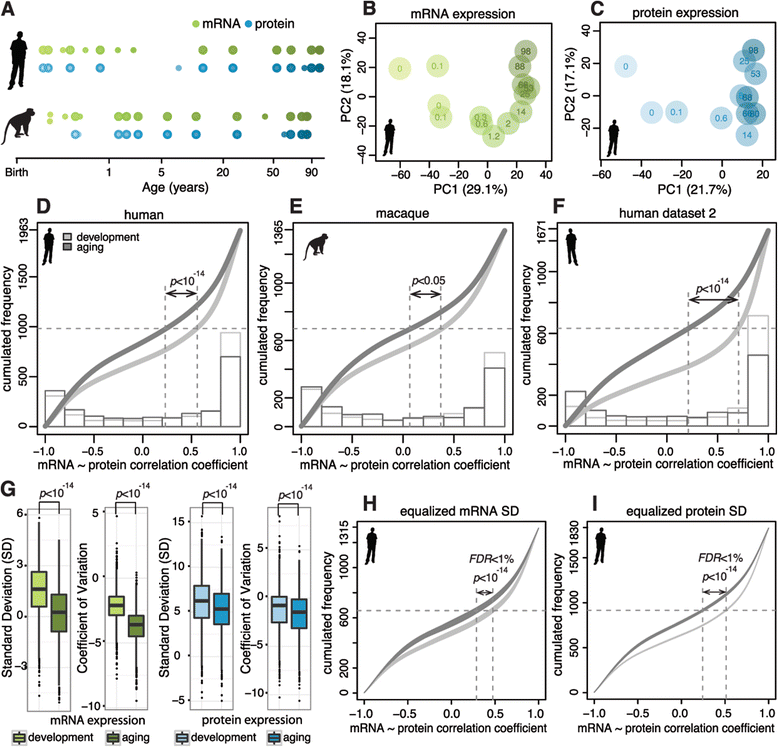
Figure 1
Figure 1
mRNA/protein decoupling in human and macaque over their lifespans. (A) Sample age distribution of mRNA (green) and protein (blue) datasets. Each dot represents an individual. Darker shades of color represent older age. Larger dots represent samples used for both mRNA and protein measurements. (B,C) The first two principal components of mRNA (B) and protein (C) expression in human PFC time series. Each circle represents an individual; darker shades of color represent older age; numbers show each individual’s age in years. Proportions of variance explained by each principal component are shown in parentheses. See also Figures S1 and S3 in Additional file 1. (D-F) Cumulative frequency of Spearman’s rank correlation coefficients based on mRNA and protein expression changes in developmental (light grey curves) and aging (dark grey curves) intervals. Dashed lines show median values of curves; P-values show significance of the difference between medians (Wilcoxon test). Histograms at the bottom of the panels show distributions of Spearman’s rank correlation coefficients in developmental (light grey) and aging (dark grey) intervals composing the curves. Results are shown for human PFC time series (D), macaque PFC time series (E) and human PFC time series with another RNA-seq dataset (F). The y-axis shows gene numbers used in each comparison. See also Figure S4 in Additional file 1. (G) Box plots show distributions of standard deviation (SD) and coefficient of variation measurements calculated for each gene expressed in human PFC, for developmental (light color) and aging (dark color) intervals, for mRNA (green) and protein (blue) datasets. P-values of Wilcoxon tests comparing two distributions are marked above plots. (H,I) Distributions of cumulative frequency of Spearman’s rank correlation coefficients based on human mRNA and protein expression changes in developmental (light grey) and aging (dark grey) intervals. Curves are based on 1,000 times subsampling of mRNA and protein expression values. FDR, false discovery rate.
Figure 2
Figure 2
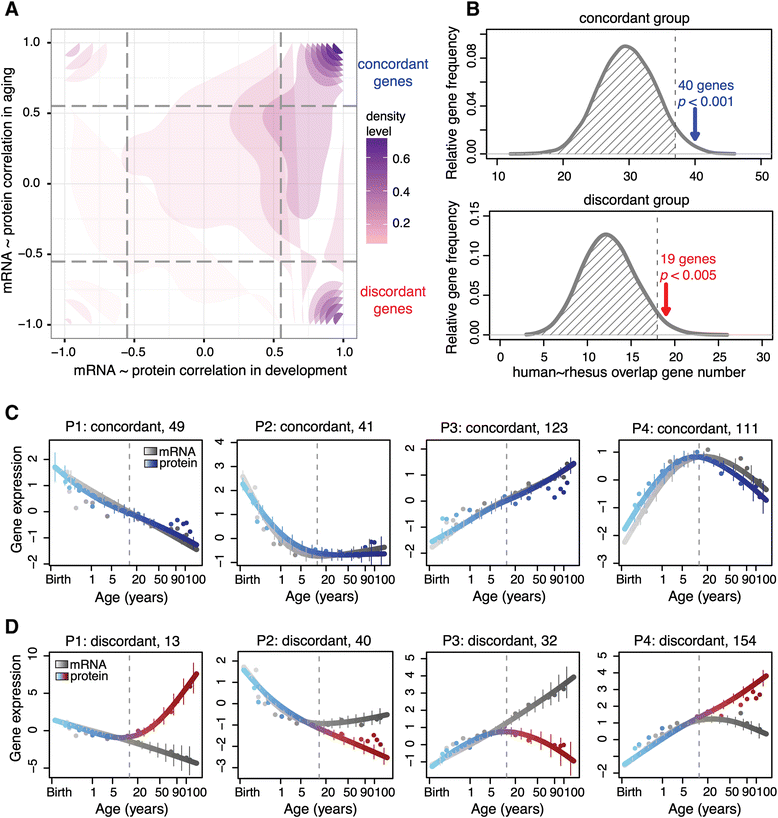
Concordant and discordant mRNA/protein expression. (A) Two-dimensional density plot showing distribution of mRNA-protein Spearman’s rank correlation coefficients measured during developmental (x-axis) and aging (y-axis) intervals in human PFC. The grey dashed lines show the correlation coefficient cutoffs used to define concordant and discordant gene groups (P < 0.05, Spearman’s rank correlation; FDR <0.05, permutations). See also Figure S5 in Additional file 1. (B) The overlap of concordant and discordant gene groups between human and rhesus macaque time series. The arrows show numbers of overlap found in the actual data; the distributions show chance overlap estimated by 1,000 permutations of gene labels. The dashed line indicates the 95% quantile of the distribution. See also Figure S5 in Additional file 1. (C,D) Four main patterns of age-dependent mRNA expression separated into concordant (C) and discordant (D) gene groups. The curves show the average mRNA (gray) and protein (colored) expression calculated using cubic spline regression. The points show the mean expression in each individual. The y-axis shows mRNA and protein expression, normalized to the mean and standard deviation of corresponding expression levels in the developmental interval. The vertical error bars show the standard deviation range of the curves. The pattern number and the number of genes in each group are shown on the top of the panels. The vertical dashed line marks separation of developmental and aging intervals. See also Figure S8 in Additional file 1.
Figure 3
Figure 3
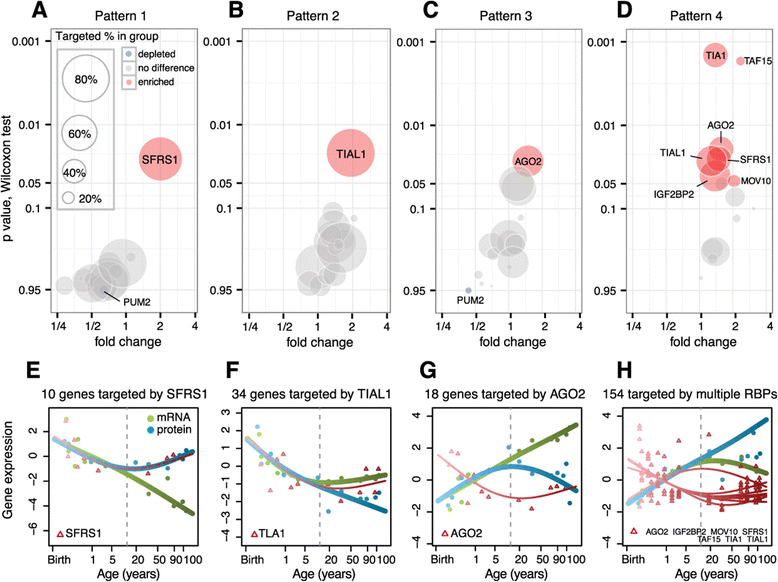
Regulation of mRNA/protein expression decoupling by RBPs. (A-D) Enrichment of RBP binding sites within discordant genes in each of the four main expression patterns, compared with concordant genes from the same pattern. The x-axis shows the enrichment fold change based on the binding site number; the y-axis shows the significance of the binding site density difference. Each circle represents one RBP. The circle radius shows the proportion of discordant genes targeted by the RBP within the group. The colors indicate RBPs showing significant enrichment (red), no difference (grey) or significant depletion (blue) of binding sites within discordant genes compared with concordant ones. See also Figure S9 in Additional file 1. (E-H) The average mRNA (green) and protein (blue) expression, as well as expression of RBP genes showing significant enrichment of binding sites among discordant genes (red) in each of the four expression patterns. The curves are calculated using cubic spline regression. The symbols show the mean expression in each individual. The y-axis shows mRNA and protein expression, normalized to the mean and standard deviation of corresponding expression levels in the developmental interval. The RBPs and the numbers of target genes in each group are shown on the top of the panels. The vertical dashed line marks separation of the developmental and aging intervals. See also Figure S10 in Additional file 1.
Figure 4
Figure 4
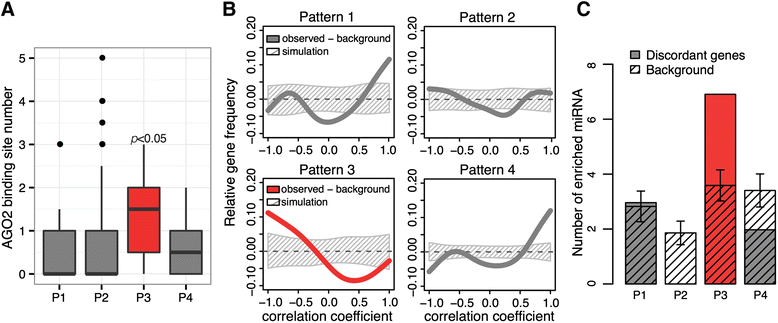
Regulation of mRNA/protein expression decoupling by miRNAs. (A) Number of AGO2 binding sites in discordant genes in the four expression patterns. Boxplots show the distribution of AGO2 binding sites in discordant genes and the variation determined by bootstrapping genes within each pattern 1,000 times. The one-sided Wilcoxon test P-value shows the significance of the AGO2 binding site excess in P3 compared with the other three patterns. (B) Difference between the distribution of predicted miRNA-target correlations and the chance background. The curves show predicted miRNA-target distribution of the Spearman’s rank correlation coefficients measured based on expression profiles of age-dependent miRNA and protein expression of their predicted target transcripts in the aging interval. The background chance distribution was estimated by generating the same number of predicted miRNA-target pairs based on randomly chosen age-dependent miRNA and target genes within the discordant group of each pattern 1,000 times. The shaded areas show the 95% confidence interval of the correlation coefficients’ chance distribution. The median of background chance distribution was subtracted from both the predicted miRNA-target and the chance background distributions. See also Figure S11 in Additional file 1. (C) The number of age-dependent miRNAs showing predicted target enrichment among discordant genes of the four patterns. Shaded grey bars show the amount of enriched miRNAs found by generating the same number of predicted miRNA-target pairs based on randomly chosen age-dependent miRNA and target genes within each pattern 1,000 times. See also Figure S12 in Additional file 1.
Figure 5
Figure 5
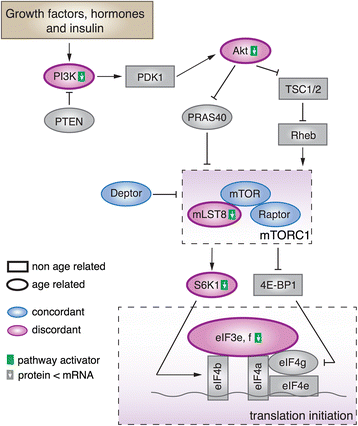
Discordant and concordant gene expression in the PI3K-Akt-mTORC1 signaling cascade. A schematic representation of selected components of the PI3K-Akt-mTORC1 signaling cascade based on [59-62]. The shapes indicate age-dependent (ovals) and non-age-dependent (rectangles) expression of pathway components. The colors indicate concordant (blue) and discordant (rose) expression in the aging interval. For each discordant gene, the green square next to the gene name illustrates its activator function in the pathway, while the white arrow in the square indicates the mRNA-protein expression relationship detected in our data. See also Figure S13 in Additional file 1.

Similar articles

Cited by

References

    1. Yoo AS, Sun AX, Li L, Shcheglovitov A, Portmann T, Li Y, et al. MicroRNA-mediated conversion of human fibroblasts to neurons. Nature. 2011;476:228–31. - PMC - PubMed
    1. van Kouwenhove M, Kedde M, Agami R. MicroRNA regulation by RNA-binding proteins and its implications for cancer. Nat Rev Cancer. 2011;11:644–56. - PubMed
    1. Siegel G, Saba R, Schratt G. microRNAs in neurons: manifold regulatory roles at the synapse. Curr Opin Genet Dev. 2011;21:491–7. - PubMed
    1. Janga SC, Vallabhaneni S. MicroRNAs as post-transcriptional machines and their interplay with cellular networks. Adv Exp Med Biol. 2011;722:59–74. - PubMed
    1. Glisovic T, Bachorik JL, Yong J, Dreyfuss G. RNA-binding proteins and post-transcriptional gene regulation. FEBS Lett. 2008;582:1977–86. - PMC - PubMed

Publication types