

Effect of genome and environment on metabolic and inflammatory profiles
- PMID: 25853885
- PMCID: PMC4390246
- DOI: 10.1371/journal.pone.0120898
Effect of genome and environment on metabolic and inflammatory profiles
Abstract
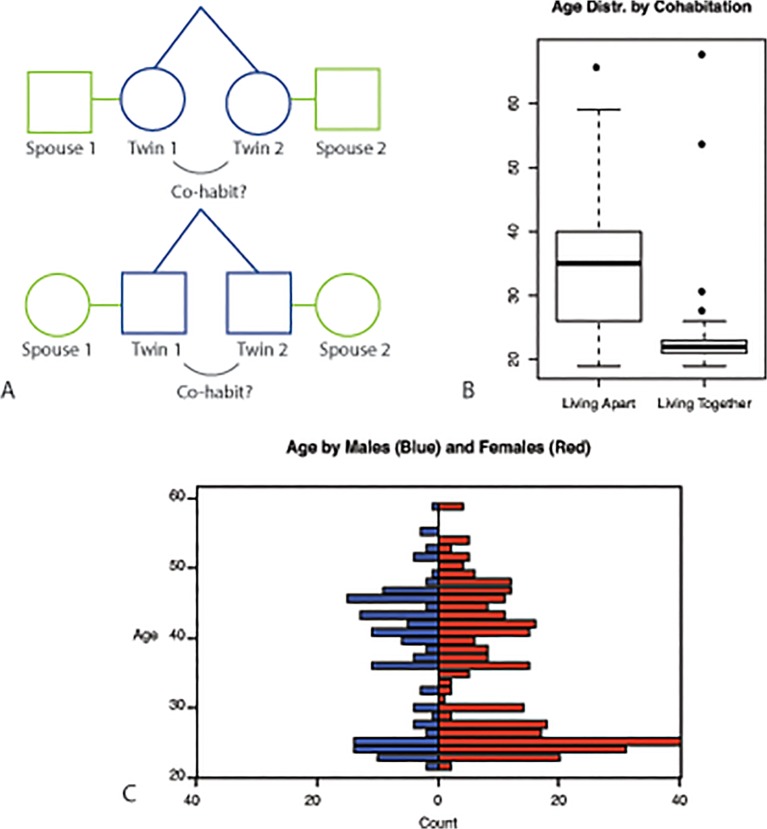
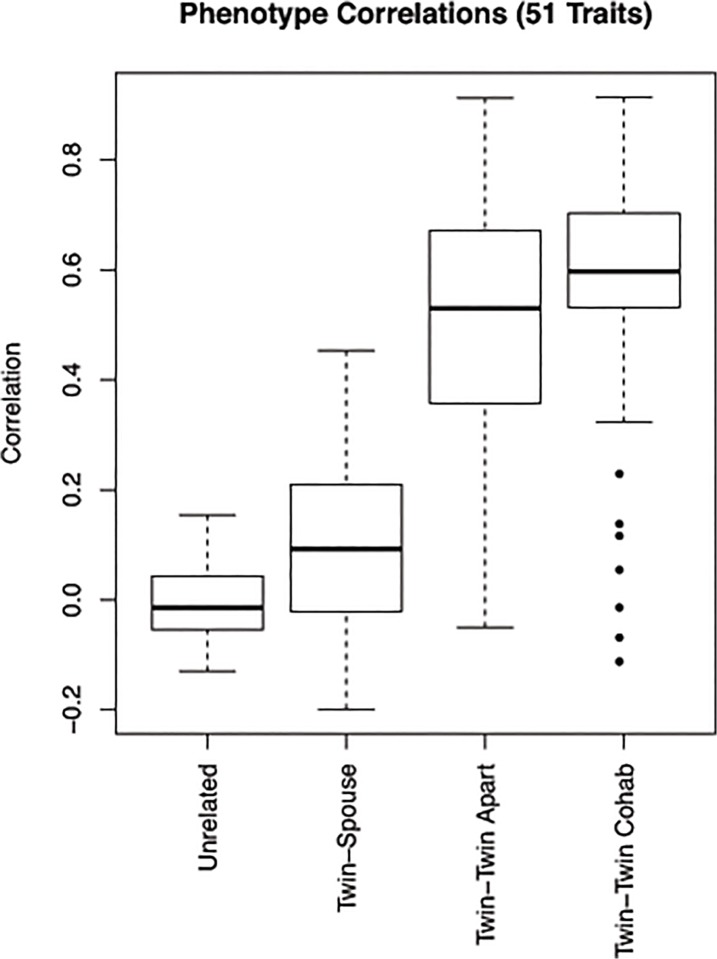
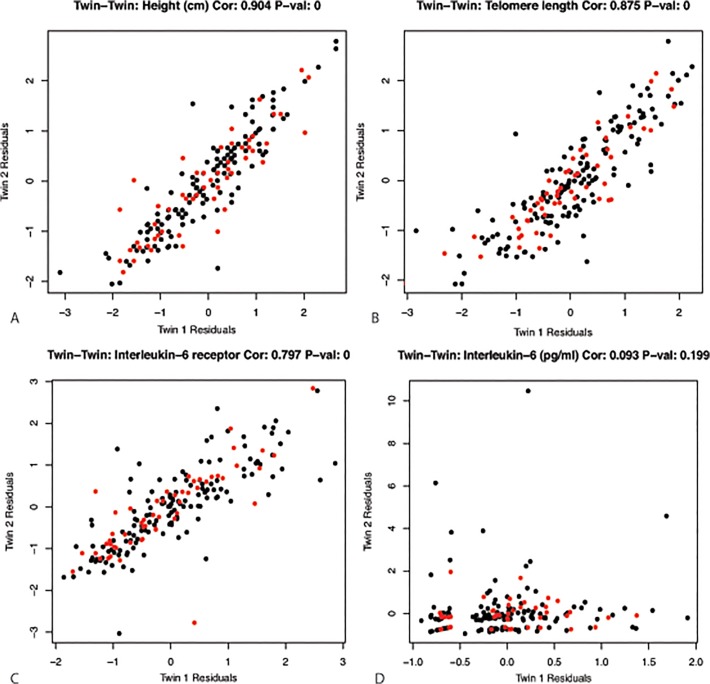
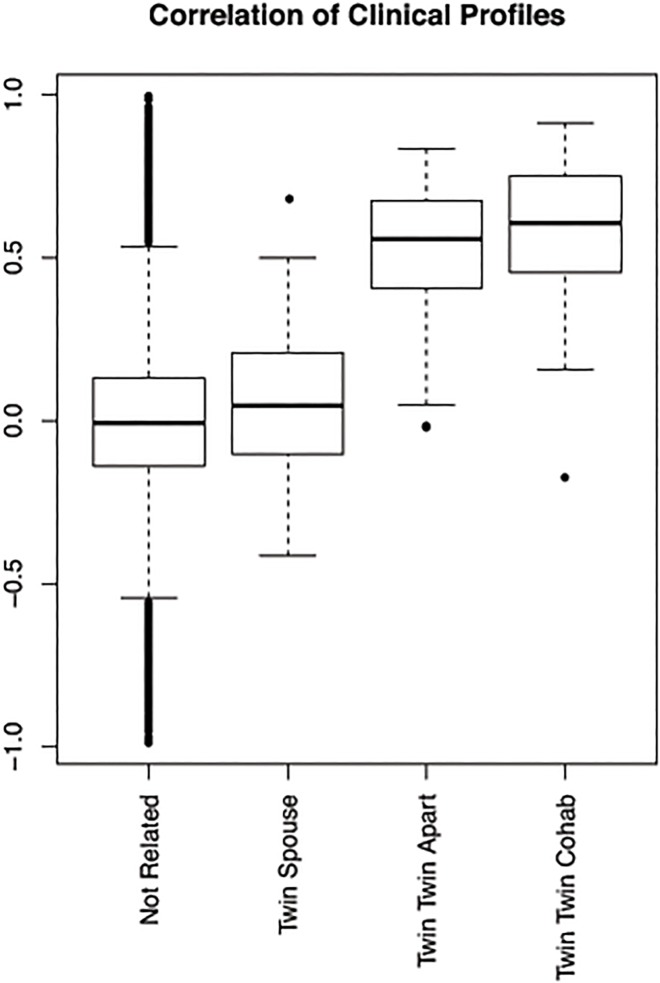
Twin and family studies have established the contribution of genetic factors to variation in metabolic, hematologic and immunological parameters. The majority of these studies analyzed single or combined traits into pre-defined syndromes. In the present study, we explore an alternative multivariate approach in which a broad range of metabolic, hematologic, and immunological traits are analyzed simultaneously to determine the resemblance of monozygotic (MZ) twin pairs, twin-spouse pairs and unrelated, non-cohabiting individuals. A total of 517 participants from the Netherlands Twin Register, including 210 MZ twin pairs and 64 twin-spouse pairs, took part in the study. Data were collected on body composition, blood pressure, heart rate, and multiple biomarkers assessed in fasting blood samples, including lipid levels, glucose, insulin, liver enzymes, hematological measurements and cytokine levels. For all 51 measured traits, pair-wise Pearson correlations, correcting for family relatedness, were calculated across all the individuals in the cohort. Hierarchical clustering techniques were applied to group the measured traits into sub-clusters based on similarity. Sub-clusters were observed among metabolic traits and among inflammatory markers. We defined a phenotypic profile as the collection of all the traits measured for a given individual. Average within-pair similarity of phenotypic profiles was determined for the groups of MZ twin pairs, spouse pairs and pairs of unrelated individuals. The average similarity across the full phenotypic profile was higher for MZ twin pairs than for spouse pairs, and lowest for pairs of unrelated individuals. Cohabiting MZ twins were more similar in their phenotypic profile compared to MZ twins who no longer lived together. The correspondence in the phenotypic profile is therefore determined to a large degree by familial, mostly genetic, factors, while household factors contribute to a lesser degree to profile similarity.
Conflict of interest statement
Figures

Similar articles
-
Cohabitation is associated with a greater resemblance in gut microbiota which can impact cardiometabolic and inflammatory risk.BMC Microbiol. 2019 Oct 22;19(1):230. doi: 10.1186/s12866-019-1602-8. BMC Microbiol. 2019. PMID: 31640566 Free PMC article.
-
Gene expression profile of subcutaneous adipose tissue in BMI-discordant monozygotic twin pairs unravels molecular and clinical changes associated with sub-types of obesity.Int J Obes (Lond). 2017 Aug;41(8):1176-1184. doi: 10.1038/ijo.2017.95. Epub 2017 Apr 25. Int J Obes (Lond). 2017. PMID: 28439093
-
Chorionicity and Heritability Estimates from Twin Studies: The Prenatal Environment of Twins and Their Resemblance Across a Large Number of Traits.Behav Genet. 2016 May;46(3):304-14. doi: 10.1007/s10519-015-9745-3. Epub 2015 Sep 26. Behav Genet. 2016. PMID: 26410687 Free PMC article.
-
Identical but not the same: the value of discordant monozygotic twins in genetic research.Am J Med Genet B Neuropsychiatr Genet. 2010 Sep;153B(6):1134-49. doi: 10.1002/ajmg.b.31091. Am J Med Genet B Neuropsychiatr Genet. 2010. PMID: 20468073 Review.
-
Twin resemblance in somatotype and comparisons with other twin studies.Hum Biol. 1994 Jun;66(3):453-64. Hum Biol. 1994. PMID: 8026815 Review.
Cited by
-
Cohabitation is associated with a greater resemblance in gut microbiota which can impact cardiometabolic and inflammatory risk.BMC Microbiol. 2019 Oct 22;19(1):230. doi: 10.1186/s12866-019-1602-8. BMC Microbiol. 2019. PMID: 31640566 Free PMC article.
-
Ketone body 3-hydroxybutyrate as a biomarker of aggression.Sci Rep. 2021 Mar 12;11(1):5813. doi: 10.1038/s41598-021-84635-6. Sci Rep. 2021. PMID: 33712630 Free PMC article.
-
Spousal associations of serum metabolomic profiles by nuclear magnetic resonance spectroscopy.Sci Rep. 2021 Nov 3;11(1):21587. doi: 10.1038/s41598-021-00531-z. Sci Rep. 2021. PMID: 34732718 Free PMC article.
-
The anti-inflammatory effects of asiatic acid in lipopolysaccharide-stimulated human corneal epithelial cells.Int J Ophthalmol. 2017 Feb 18;10(2):179-185. doi: 10.18240/ijo.2017.02.01. eCollection 2017. Int J Ophthalmol. 2017. PMID: 28251074 Free PMC article.
-
Linking the gut microbiome to host DNA methylation by a discovery and replication epigenome-wide association study.BMC Genomics. 2024 Dec 19;25(1):1224. doi: 10.1186/s12864-024-11136-x. BMC Genomics. 2024. PMID: 39702006 Free PMC article.
References
-
- McCartney K, Harris MJ, Bernieri F. Growing up and growing apart: a developmental meta-analysis of twin studies. Psychological bulletin. 1990;107(2):226–37. - PubMed
-
- Boomsma D, Busjahn A, Peltonen L. Classical twin studies and beyond. Nature reviews Genetics. 2002;3(11):872–82. - PubMed
-
- van Rijn MJ, Schut AF, Aulchenko YS, Deinum J, Sayed-Tabatabaei FA, Yazdanpanah M, et al. Heritability of blood pressure traits and the genetic contribution to blood pressure variance explained by four blood-pressure-related genes. Journal of hypertension. 2007;25(3):565–70. - PubMed
Publication types
MeSH terms
LinkOut - more resources
Full Text Sources
Other Literature Sources
